. 2021 May;160(6):2055-2071.e0.
doi: 10.1053/j.gastro.2021.01.221. Epub 2021 Jan 29.

Mucosal Genomics Implicate Lymphocyte Activation and Lipid Metabolism in Refractory Environmental Enteric Dysfunction

Affiliations

Mucosal Genomics Implicate Lymphocyte Activation and Lipid Metabolism in Refractory Environmental Enteric Dysfunction

Yael Haberman et al. Gastroenterology. 2021 May.

Abstract

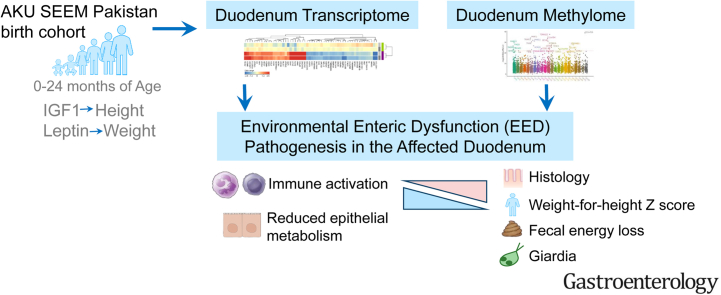
Background & aims: Environmental enteric dysfunction (EED) limits the Sustainable Development Goals of improved childhood growth and survival. We applied mucosal genomics to advance our understanding of EED.

Methods: The Study of Environmental Enteropathy and Malnutrition (SEEM) followed 416 children from birth to 24 months in a rural district in Pakistan. Biomarkers were measured at 9 months and tested for association with growth at 24 months. The duodenal methylome and transcriptome were determined in 52 undernourished SEEM participants and 42 North American controls and patients with celiac disease.

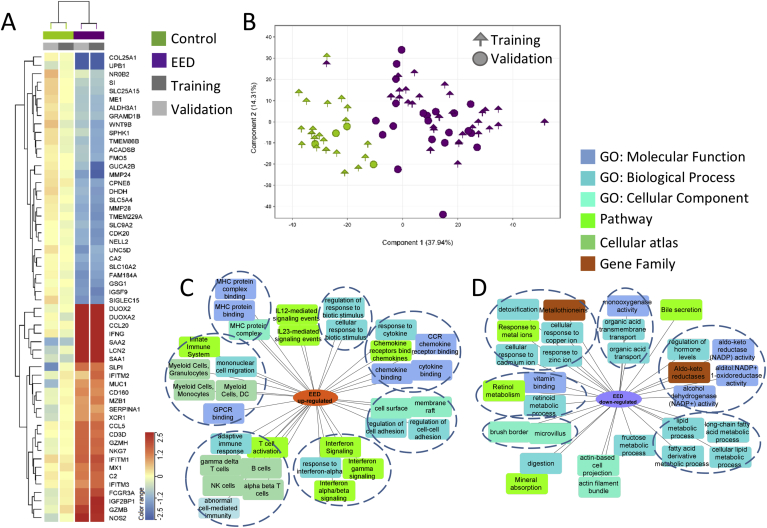
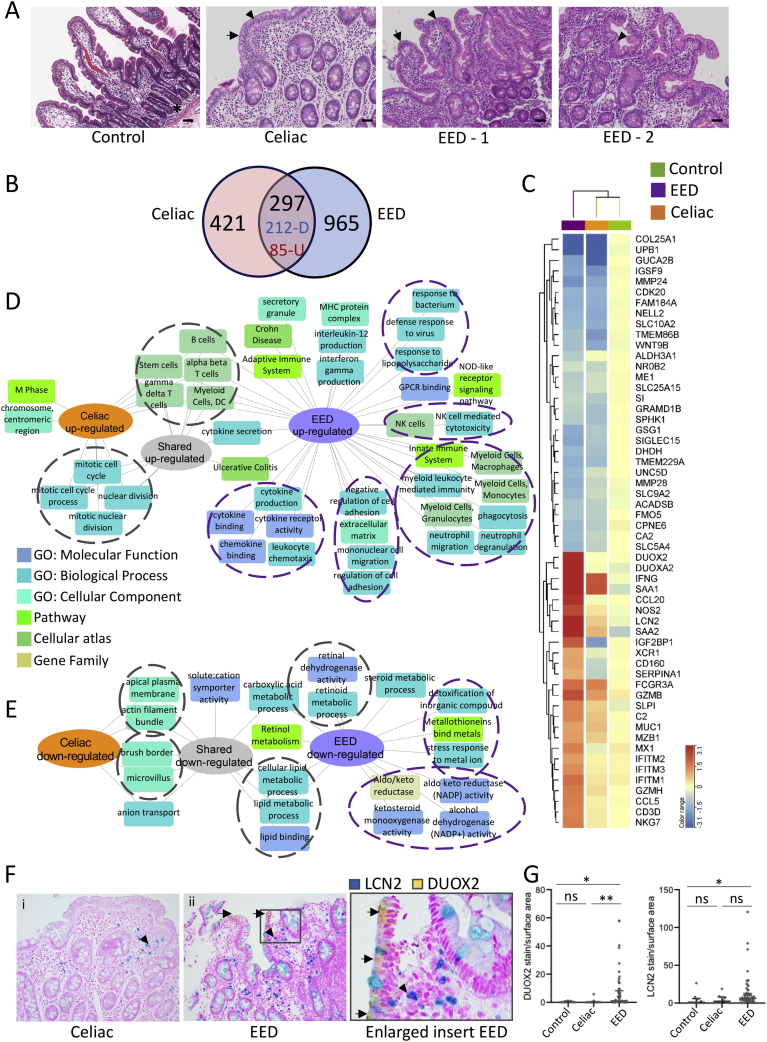
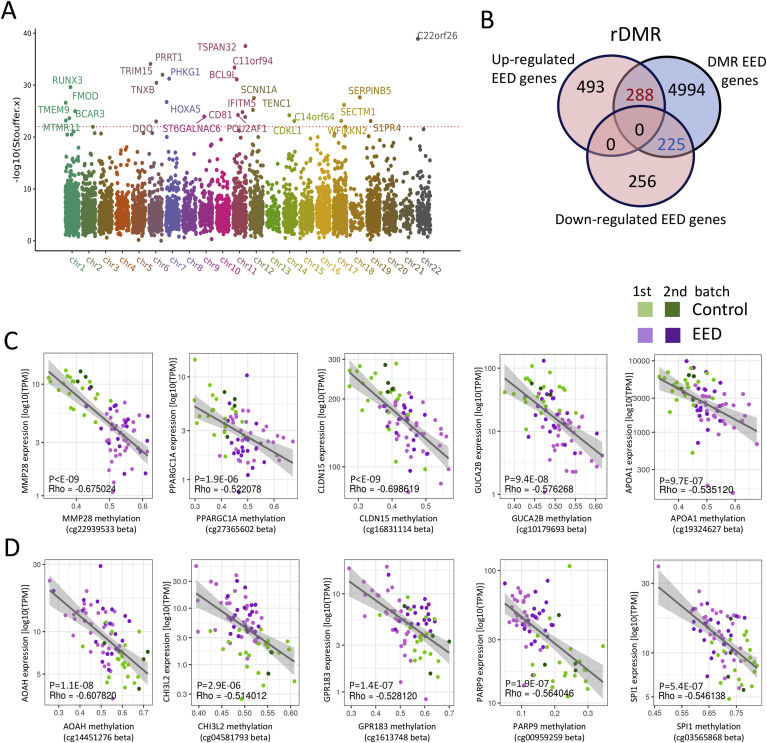
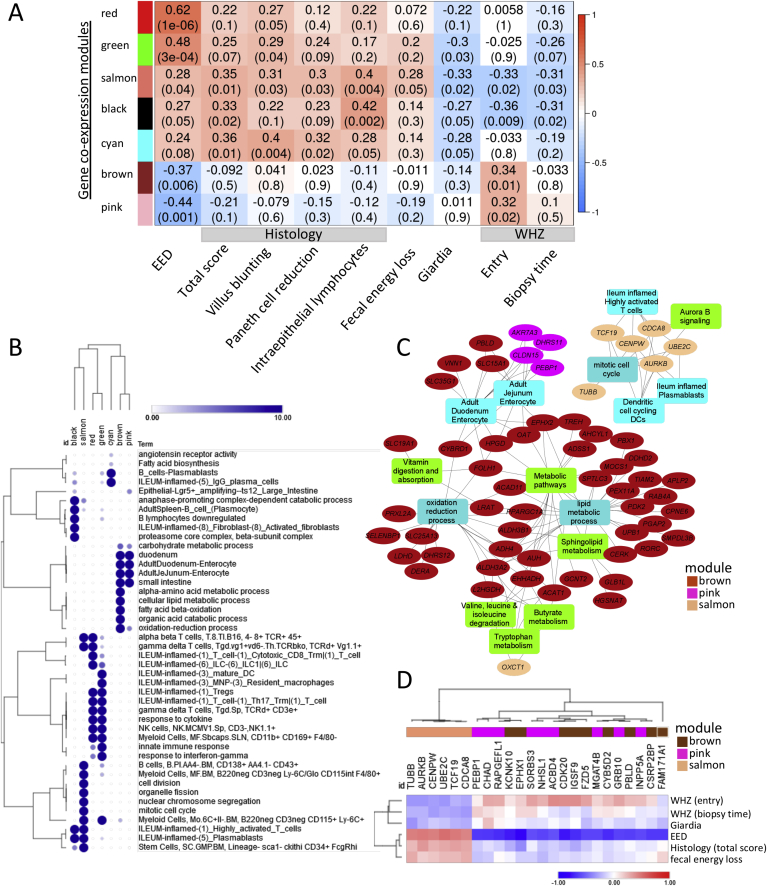
Results: After accounting for growth at study entry, circulating insulin-like growth factor-1 (IGF-1) and ferritin predicted linear growth, whereas leptin correlated with future weight gain. The EED transcriptome exhibited suppression of antioxidant, detoxification, and lipid metabolism genes, and induction of anti-microbial response, interferon, and lymphocyte activation genes. Relative to celiac disease, suppression of antioxidant and detoxification genes and induction of antimicrobial response genes were EED-specific. At the epigenetic level, EED showed hyper-methylation of epithelial metabolism and barrier function genes, and hypo-methylation of immune response and cell proliferation genes. Duodenal coexpression modules showed association between lymphocyte proliferation and epithelial metabolic genes and histologic severity, fecal energy loss, and wasting (weight-for-length/height Z < -2.0). Leptin was associated with expression of epithelial carbohydrate metabolism and stem cell renewal genes. Immune response genes were attenuated by giardia colonization.

Conclusions: Children with reduced circulating IGF-1 are more likely to experience stunting. Leptin and a gene signature for lymphocyte activation and dysregulated lipid metabolism are implicated in wasting, suggesting new approaches for EED refractory to nutritional intervention. ClinicalTrials.gov, Number: NCT03588013. (https://clinicaltrials.gov/ct2/show/NCT03588013).

Keywords: Anthropometrics; DNA Methylation; Intestine; RNA Sequencing.


Figures

None
Graphical abstract
Figure 1
Figure 1
The EED intestinal transcriptome and enriched biologic pathways. The core EED transcriptome was comprised of 1,262 genes (481 down- and 781 up-regulated) differentially expressed between 31 AKU-EED malnourished cases and 21 Cincinnati well-nourished controls in the training set (FDR < 0.05 and fold change [FC] ≥1.5 using bulk RNASeq of duodenal RNA) and assessed in an independent validation set of 21 EED and 4 Ctl. Unsupervised hierarchical clustering is visualized as a heatmap in (A) demonstrating the averaged normalized expression in AKU-EED malnourished cases and Cincinnati well-nourished controls in the training and validation groups for the top differentially expressed genes (more detailed heatmap in Supplementary Figure 4). (B) Principal component analysis (PCA) using the 1,262 EED genes transcriptome (determined only using the training subset) showing separation of the AKU-EED malnourished cases and the well-nourished controls from Cincinnati in both the training and validation groups on the PC1 axis that explains 38% of the total variance in gene expression. Functional enrichment analyses of the 781 up- (C) and 481 down-regulated (D) genes between AKU-EED malnourished cases and Cincinnati well-nourished controls was performed using ToppGene/ToppCluster and was visualized using Cytoscape.
Figure 2
Figure 2
Shared and disease-specific immune and metabolic intestinal gene expression features of EED and celiac disease. (A) Representative hematoxylin and eosin stained duodenal biopsy specimens from a Cincinnati well-nourished control, a Cincinnati celiac disease patient (Marsh celiac disease score 3a; EED histology score of 12), a malnourished AKU-EED-1 case with EED histology score of 9, and a malnourished AKU-EED-2 case with EED histology score of 4 are shown. ∗Paneth cells in a Cincinnati well-nourished control. Arrow indicates villous blunting and arrowhead indicates intraepithelial lymphocytes in a patient from Cincinnati with celiac disease and a malnourished AKU-EED case. Bar equals 247 μm. (B) The Venn diagram shows the overlap between the 718 genes comprising the celiac disease transcriptome (differentially expressed genes between 17 patients from Cincinnati with celiac disease and 25 well-nourished controls from Cincinnati, FDR < 0.05 and fold change [FC] ≥ 1.5 using bulk RNASeq of duodenal RNA) and 1,262 genes comprising the EED transcriptome. This demonstrates 212 shared down- and 85 shared up-regulated genes. (C) Unsupervised hierarchical clustering heatmap with the top differentially expressed genes in the EED transcriptome demonstrating the averaged normalized expression across malnourished AKU-EED cases, patients from Cincinnati with celiac disease, and Cincinnati well-nourished controls. Functional enrichment analysis of the up- (D) and down-regulated (E) shared and unique genes in the EED and celiac disease transcriptomes was performed using ToppGene/ToppCluster and was visualized using Cytoscape. (F) Immunohistochemistry was performed using antibodies against DUOX2 (yellow chromogen) and LCN2 (teal chromogen) in a dual stain. Original magnification x200 for i & ii. (G) Data for the relative tissue area exhibiting staining for the analytes, normalized against the total area of tissue in each sample, are shown for controls (n = 10), celiac disease (n = 10), and EED (n = 57); Kruskal-Wallis test with Dunn multiple comparisons test; ∗∗P < .01; ∗P < .05.
Figure 3
Figure 3
Variation in DNAm associated with expression of immune and metabolic genes in EED. Genome-wide intestinal DNAm was profiled in DNA prepared from duodenal biopsy specimens using the Illumina Infinium MethylationEPIC BeadChip platform. (A) A Manhattan plot is shown displaying the overlapping DMRs associated with EED in 2 methylation profile batches including 31 malnourished AKU-EED cases compared with 21 well-nourished Cincinnati controls in batch 1, and 33 malnourished AKU-EED cases compared with 9 well-nourished Cincinnati controls in batch 2, of which 12 AKU-EED cases and 5 Cincinnati controls were tested in both batches. The corrected P values (−log10 Stouffer) of each DMR are plotted against their respective positions on each chromosome. (B) The Venn diagram shows the overlap between 481 down- and 781 up-regulated genes in the EED transcriptome and DMRs highlighting 453 rDMR including genes that show evidence for both differential methylation (DM) and differential expression (DE). Beta-value methylation levels of differentially methylated points within rDMR showing a significant relationship (P < 1E-6) between methylation levels and expression (TPM) of specific down- (C) and up-regulated (D) genes as indicated. We highlight genes that are expressed in intestinal epithelial cells based upon a previous isolated ileal epithelial cell dataset and single-cell datasets. The gray lines illustrate a linear model fit, whereas rho values indicate the Spearman correlation coefficients.
Figure 4
Figure 4
Gene coexpression modules are associated with EED diagnosis and measures of clinical and histologic severity. WGCNA was implemented to identify modules of coexpressed genes. For each module, the first principal component, referred to as the eigengene, was considered to be the module representative tested for association with phenotypic traits. (A) Heatmap representation of the WGCNA demonstrates gene coexpression modules (represented by module eigengenes), which were correlated with EED diagnosis (first column, EED), in an analysis that included 52 malnourished AKU-EED cases and 25 well-nourished Cincinnati controls and other clinical traits as shown in an analysis limited to the 52 malnourished AKU-EED cases. Seven gene coexpression modules identified based on the correlation strength with the EED diagnosis are shown, together with the results for correlations with clinical traits within the AKU-EED cases. Data are shown as the correlation coefficient and P value for each comparison. (B) A representation plot of hierarchically clustered selected top functionally enriched (FDR P < .05) biological processes, pathways, and cell types in each of the 7 gene coexpression modules is shown. The size of the circles and the intensity of the color is proportional to the enrichment strength. (C) Hub genes (ovals) are shown that were also differentially methylated together with functionally enriched pathways from 3 gene coexpression modules that were strongly correlated with WHZ (salmon, pink, and brown modules). (D) A heatmap of specific hub genes from (C) and their correlation with EED diagnosis and other clinical traits including WHZ around birth as indicated is shown.

References

    1. Victora C.G., Adair L., Fall C. Maternal and child undernutrition: consequences for adult health and human capital. Lancet. 2008;371:340–357. - PMC - PubMed
    1. Lunn P.G., Northrop-Clewes C.A., Downes R.M. Intestinal permeability, mucosal injury, and growth faltering in Gambian infants. Lancet. 1991;338:907–910. - PubMed
    1. Fasano A., Catassi C. Clinical practice. Celiac disease. N Engl J Med. 2012;367:2419–2426. - PubMed
    1. Campbell D.I., Murch S.H., Elia M. Chronic T cell-mediated enteropathy in rural west African children: relationship with nutritional status and small bowel function. Pediatr Res. 2003;54:306–311. - PubMed
    1. Chen R.Y., Kung V.L., Das S. Duodenal microbiota in stunted undernourished children with enteropathy. N Engl J Med. 2020;383:321–333. - PMC - PubMed

Publication types

MeSH terms

Associated data