. 2021 Apr 15:230:117815.
doi: 10.1016/j.neuroimage.2021.117815. Epub 2021 Jan 29.

Measuring functional connectivity with wearable MEG

Affiliations

Measuring functional connectivity with wearable MEG

Elena Boto et al. Neuroimage. .

Abstract

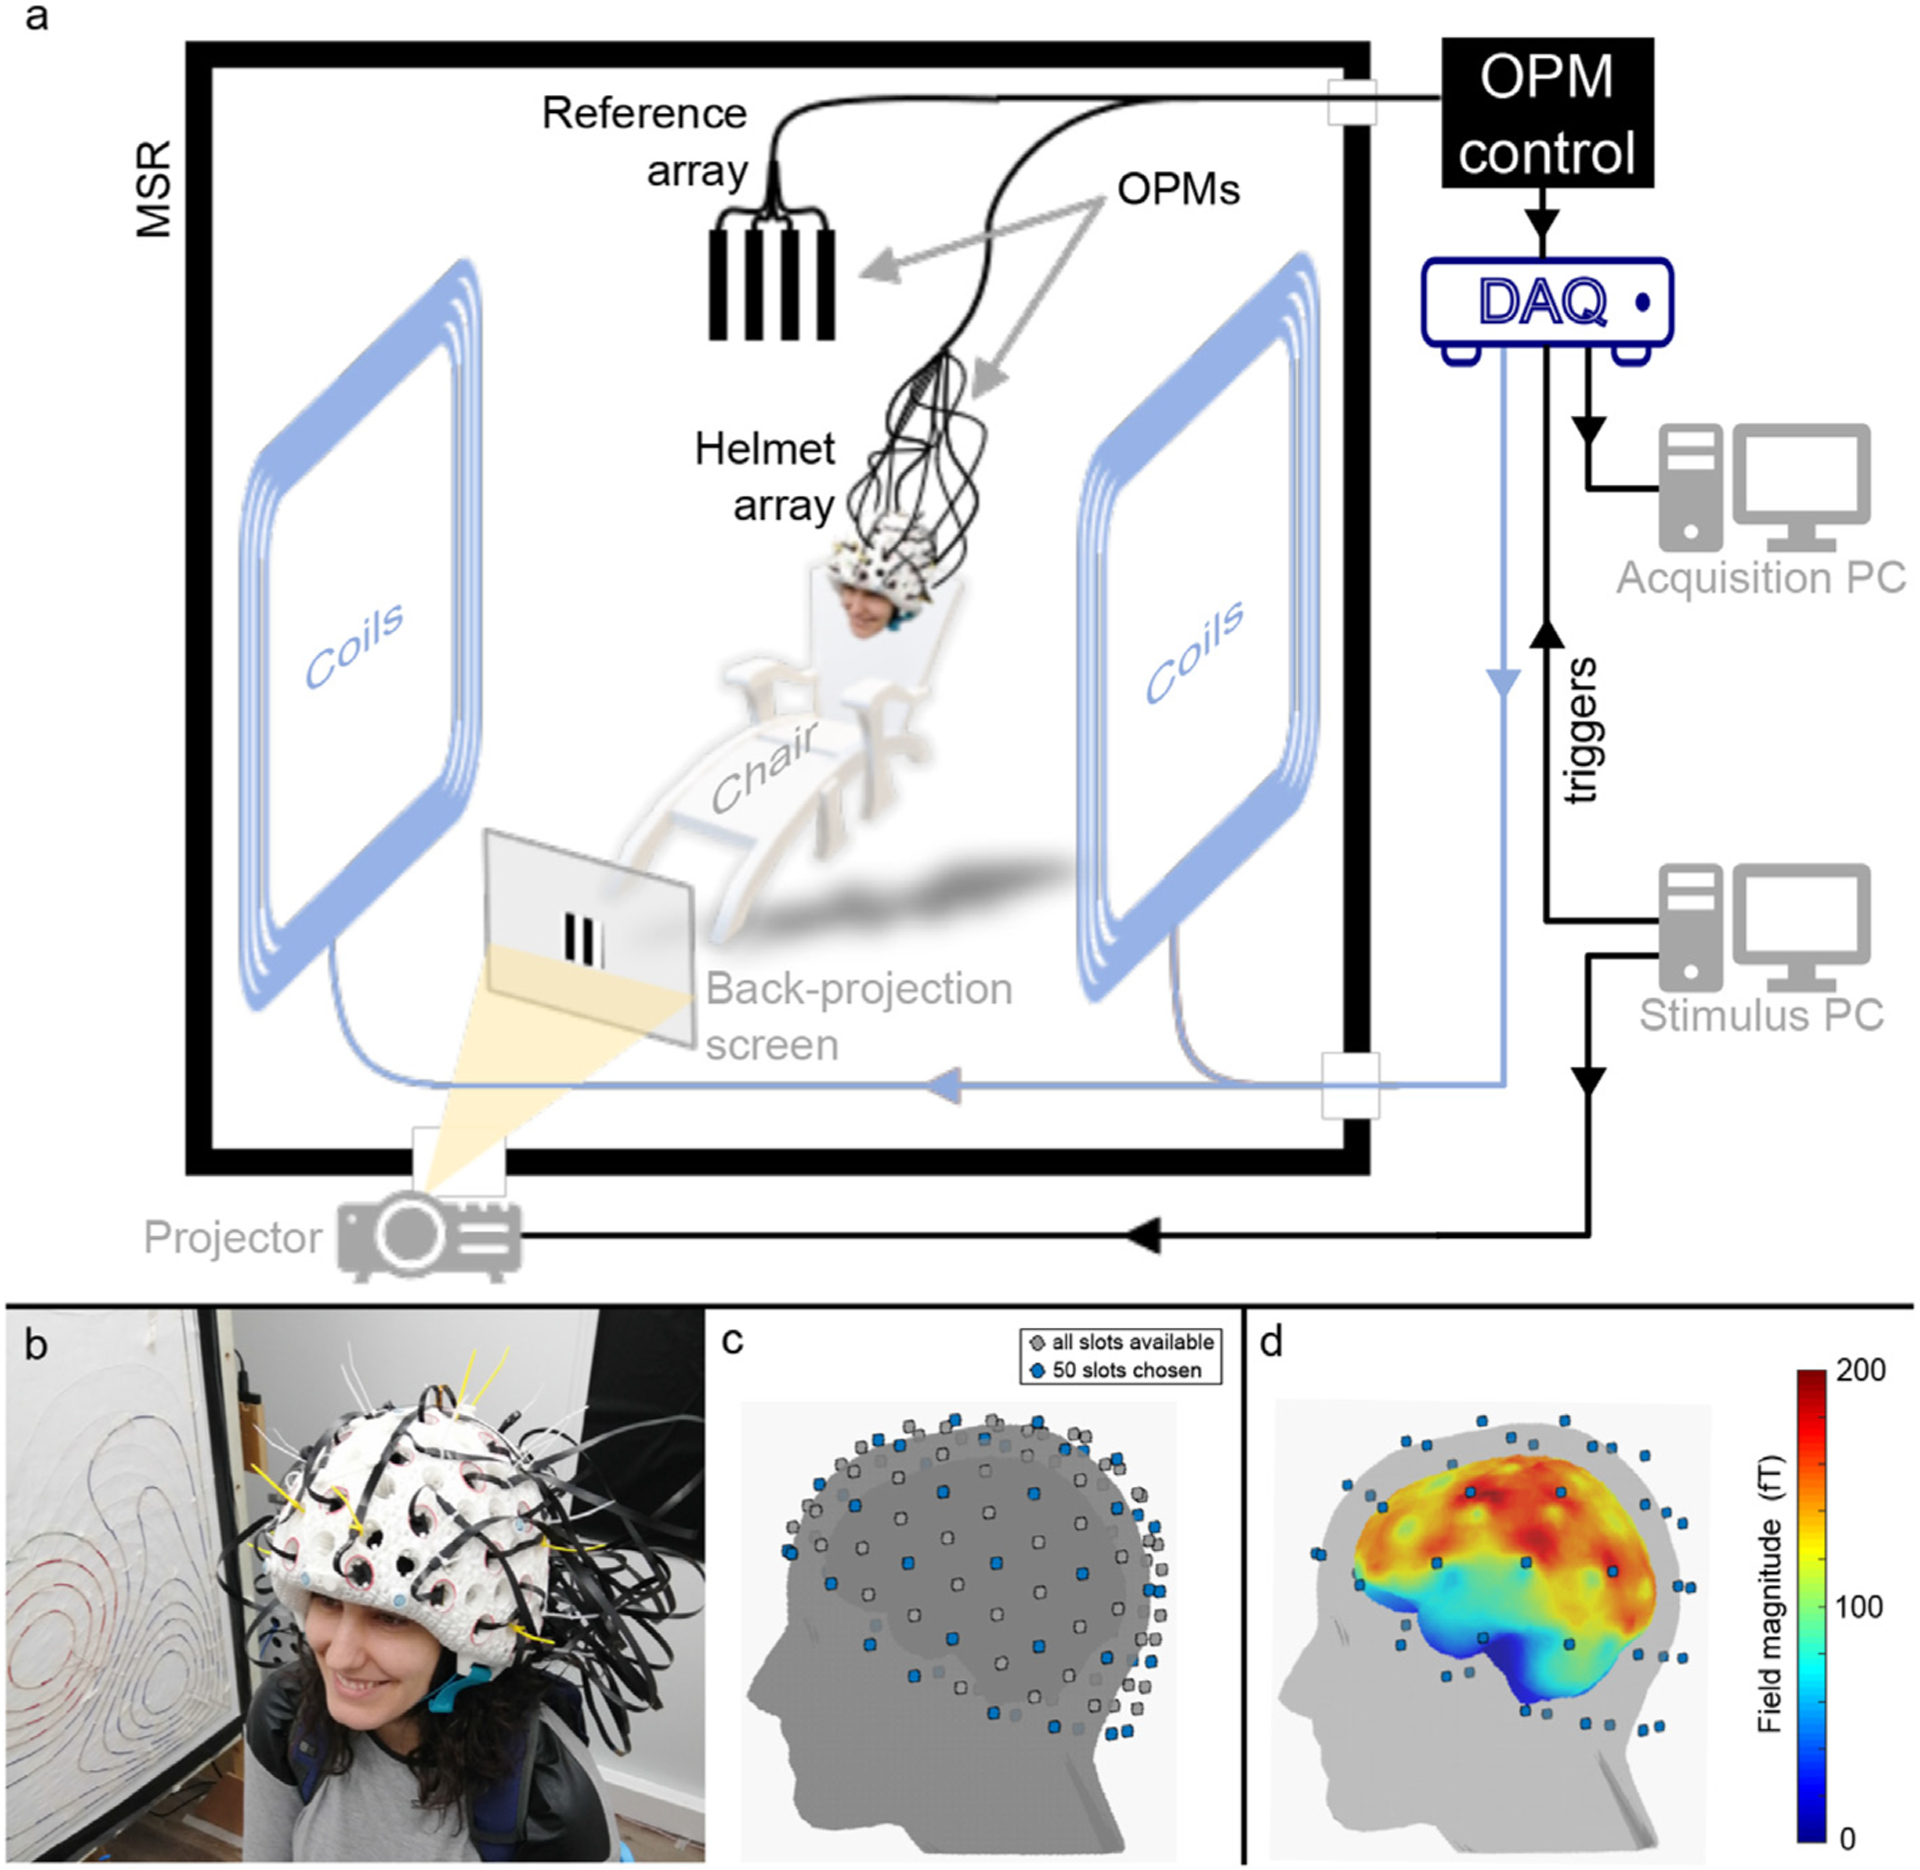
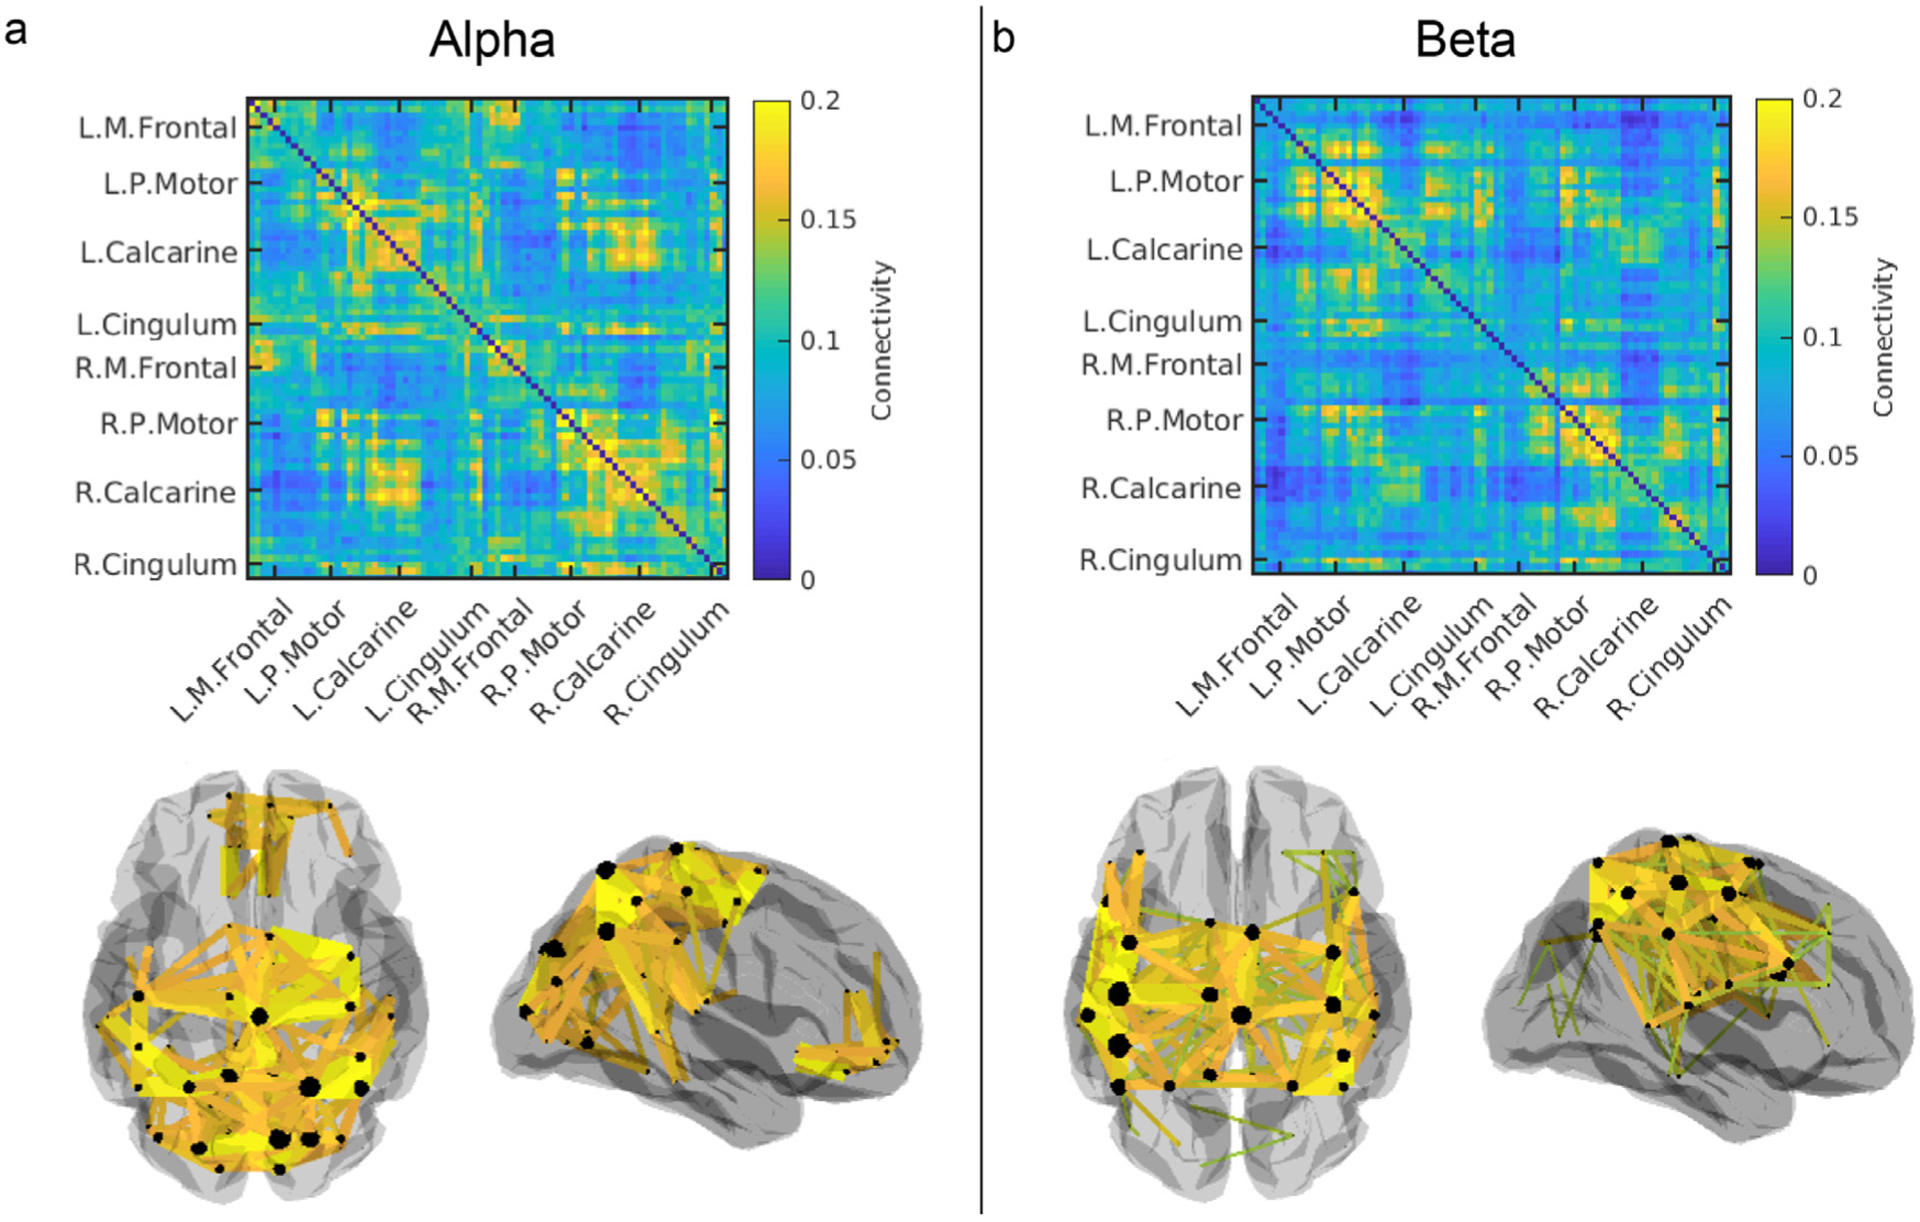
Optically-pumped magnetometers (OPMs) offer the potential for a step change in magnetoencephalography (MEG) enabling wearable systems that provide improved data quality, accommodate any subject group, allow data capture during movement and potentially reduce cost. However, OPM-MEG is a nascent technology and, to realise its potential, it must be shown to facilitate key neuroscientific measurements, such as the characterisation of brain networks. Networks, and the connectivities that underlie them, have become a core area of neuroscientific investigation, and their importance is underscored by many demonstrations of their disruption in brain disorders. Consequently, a demonstration of network measurements using OPM-MEG would be a significant step forward. Here, we aimed to show that a wearable 50-channel OPM-MEG system enables characterisation of the electrophysiological connectome. To this end, we measured connectivity in the resting state and during a visuo-motor task, using both OPM-MEG and a state-of-the-art 275-channel cryogenic MEG device. Our results show that resting-state connectome matrices from OPM and cryogenic systems exhibit a high degree of similarity, with correlation values >70%. In addition, in task data, similar differences in connectivity between individuals (scanned multiple times) were observed in cryogenic and OPM-MEG data, again demonstrating the fidelity of the OPM-MEG device. This is the first demonstration of network connectivity measured using OPM-MEG, and results add weight to the argument that OPMs will ultimately supersede cryogenic sensors for MEG measurement.

Keywords: AEC; Amplitude-envelope correlation; Functional connectivity; MEG; Magnetoencephalography; Network; OPM; OPM-MEG; Optically-pumped magnetometer; Wearable MEG.


Conflict of interest statement

Declaration of Competing Interest V.S. is the founding director of QuSpin, the commercial entity selling OPM magnetometers. J.O. is an employee of QuSpin. E.B. and M.J.B. are directors of Cerca Magnetics Limited, a newly established spin-out company whose aim is to commercialise aspects of OPM-MEG technology. E.B., M.J.B., R.B., N.H. and R.H. hold founding equity in Cerca Magnetics Limited.

Figures

Fig. A1.
Fig. A1.
Presentation of the heartbeat artefact in OPM-MEG: a) Sensor-space data filtered to the beta band. Four channels are shown (indicated on the sensor layout on the right) and despite the separation of approximately 40 cm between the heart itself and the head-mounted sensors, the magnetocardiogram can be seen clearly. b) Correlation between the heartbeat artefact and source-localised data, across 78 AAL regions. Top left: beamforming applied with the cardiac artefact removed. Top right: beamforming applied to the full dataset with no regularisation. Bottom left: beamforming applied with 5% regularisation. Bottom right: beamforming applied with 15% regularisation.
Fig. 1.
Fig. 1.
The OPM-MEG system. a) Schematic of the OPM-MEG suite. b) Photograph of subject wearing an additively-manufactured helmet with 50 OPM sensors mounted within it. c) Digitised head surface for an example participant, showing the 133 slots available in the helmet (grey) and the 50 chosen for this study (blue). Note that OPMs were made sensitive to the field in the radial direction only. d) Cortical coverage achieved by the selected 50 OPM locations: the norm of the forward fields across all sensors is plotted at each vertex of the brain surface.
Fig. 2.
Fig. 2.
Task-based functional connectivity matrices. Average connectivity matrices (across 6 runs) in the alpha (left), beta (middle) and gamma (right) bands for participants 1 (top) and 2 (bottom). For each participant, both OPM-derived (top) and cryogenic-derived (bottom) matrices are shown. Colour bars show connectivity (i.e. Pearson correlation between amplitude envelope) values. Alongside the matrices, the 3D brains show the 50 connections with the highest connectivity values.
Fig. 3.
Fig. 3.
Cryogenic vs OPM connectivity in the beta band. a) Scatter plots showing connectivity values derived from cryogenic data plotted against connectivity values derived from OPM data (each dot depicts a measured connection). Left column shows within-subject correlation for subject 1 (top) and subject 2 (bottom). Right column corresponds to between-subject correlation. b) Bar plot showing the mean within- and between-subject correlation of connectome matrices. Connectome repeatability is calculated in three ways; cryogenic-to-cryogenic (dark grey; here we compare connectome matrices taken using the cryogenic system in separate runs); OPM-to-OPM (middle grey; comparing matrices taken using the OPM system in separate runs); and OPM-to-cryogenic (light grey; comparing matrices derived using the OPM system to matrices derived using the cryogenic system). Error bar corresponds to standard deviation across the 15 or 36 comparisons. Crosses and triangles indicate individual values from a single calculation of correlation between two matrices – i.e. all raw data are shown.
Fig. 4.
Fig. 4.
Connectivity strength in the beta band. a) Normalised connectivity strength recorded using cryogenic- (red) and OPM- (blue) derived data. Values are plotted for all 78 AAL regions, for participants 1 (top) and 2 (bottom). The shaded area represents standard deviation across 6 runs. Note the similarities between cryogenic and OPM plots. b) Normalised connectivity strength plotted on the brain surface for both subjects and both systems. c) Same as (a) but grouped by scanner type: normalised connectivity strength recorded using cryogenic- (bottom) and OPM- (top) derived data for participants 1 (solid line) and 2 (dashed line). d) Brain areas showing significant difference between participants (grey indicates no significant difference). Note both systems highlight similar regions.
Fig. 5.
Fig. 5.
Resting-state connectivity plots derived from OPM data. Alpha- (a) and beta- (b) band connectivity matrices averaged across the 7 participants. Brain plots show the top 200 connections.
Fig. 6.
Fig. 6.
Resting-state group connectivity matrices from cryogenic data and a comparison with the OPM-derived connectome. Alpha- (a) and beta- (b) band connectivity matrices from 9 groups of 7 subjects. 3D brain plots show dominant connections (top 200). Note that even though these are group-averaged results, clear differences across groups remain (although the overall pattern appears robust). c) Results for alpha (top row) and beta (bottom row). The scatter plots on the left show cryogenic-derived connectivity values, with different groups plotted against each other i.e. each data point shows connectivity for the same connection, in two different subject groups, plotted against each other. The black line shows y = x; the grey lines show lines of best fit for the 36 different possible comparisons between independent groups. The scatter plots in the centre show cryogenic-derived connectivity versus OPM-derived connectivity values. 9 separate comparisons are made between the OPM-derived connectome (averaged across 7 subjects) and 9 separate cryogenic-derived connectomes (each the average of 7 subjects). The bar chart shows mean correlation values for cryogenic-to-cryogenic connectivity (left-hand bar) and OPM-to-cryogenic connectivity (right-hand bar). The individual points (squares/triangles) show individual correlation values from all possible matrix parings. The dashed line shows the 99th percentile of the null distribution.

Comment in

References

    1. Altarev I, Fierlinger P, Lins T, Marino MG, Nießen B, Petzoldt G, Reisner M, Stuiber S, Sturm M, Taggart Singh J, Taubenheim B, Rohrer HK, Schläpfer U, 2015. Minimizing magnetic fields for precision experiments. J. Appl. Phys 117. doi:10.1063/1.4922671. - DOI
    1. Baker AP, Brookes MJ, Rezek IA, Smith SM, Behrens T, Smith PJP, Woolrich M, 2014. Fast transient networks in spontaneous human brain activity. Elife 2014, e01867. doi:10.7554/eLife.01867. - DOI - PMC - PubMed
    1. Barry DN, Tierney TM, Holmes N, Boto E, Roberts G, Leggett J, Bowtell R, Brookes MJ, Barnes GR, Maguire EA, 2019. Imaging the human hippocampus with optically-pumped magnetoencephalography. Neuroimage 203. doi:10.1016/j.neuroimage.2019.116192. - DOI - PMC - PubMed
    1. Beckmann CF, DeLuca M, Devlin JT, Smith SM, 2005. Investigations into resting-state connectivity using independent component analysis. Philos. Trans. R. Soc. B Biol. Sci 360, 1001–1013. doi:10.1098/rstb.2005.1634. - DOI - PMC - PubMed
    1. Benjamini Y, Hochberg Y, 1995. Controlling the false discovery rate: a practical and powerful approach to multiple testing. J. R. Stat. Soc. Ser. B doi:10.1111/j.2517-6161.1995.tb02031.x. - DOI

Publication types