. 2021 Mar:222:113213.
doi: 10.1016/j.ultramic.2021.113213. Epub 2021 Jan 21.

Defocus-dependent Thon-ring fading

Affiliations

Defocus-dependent Thon-ring fading

Robert M Glaeser et al. Ultramicroscopy. 2021 Mar.

Abstract

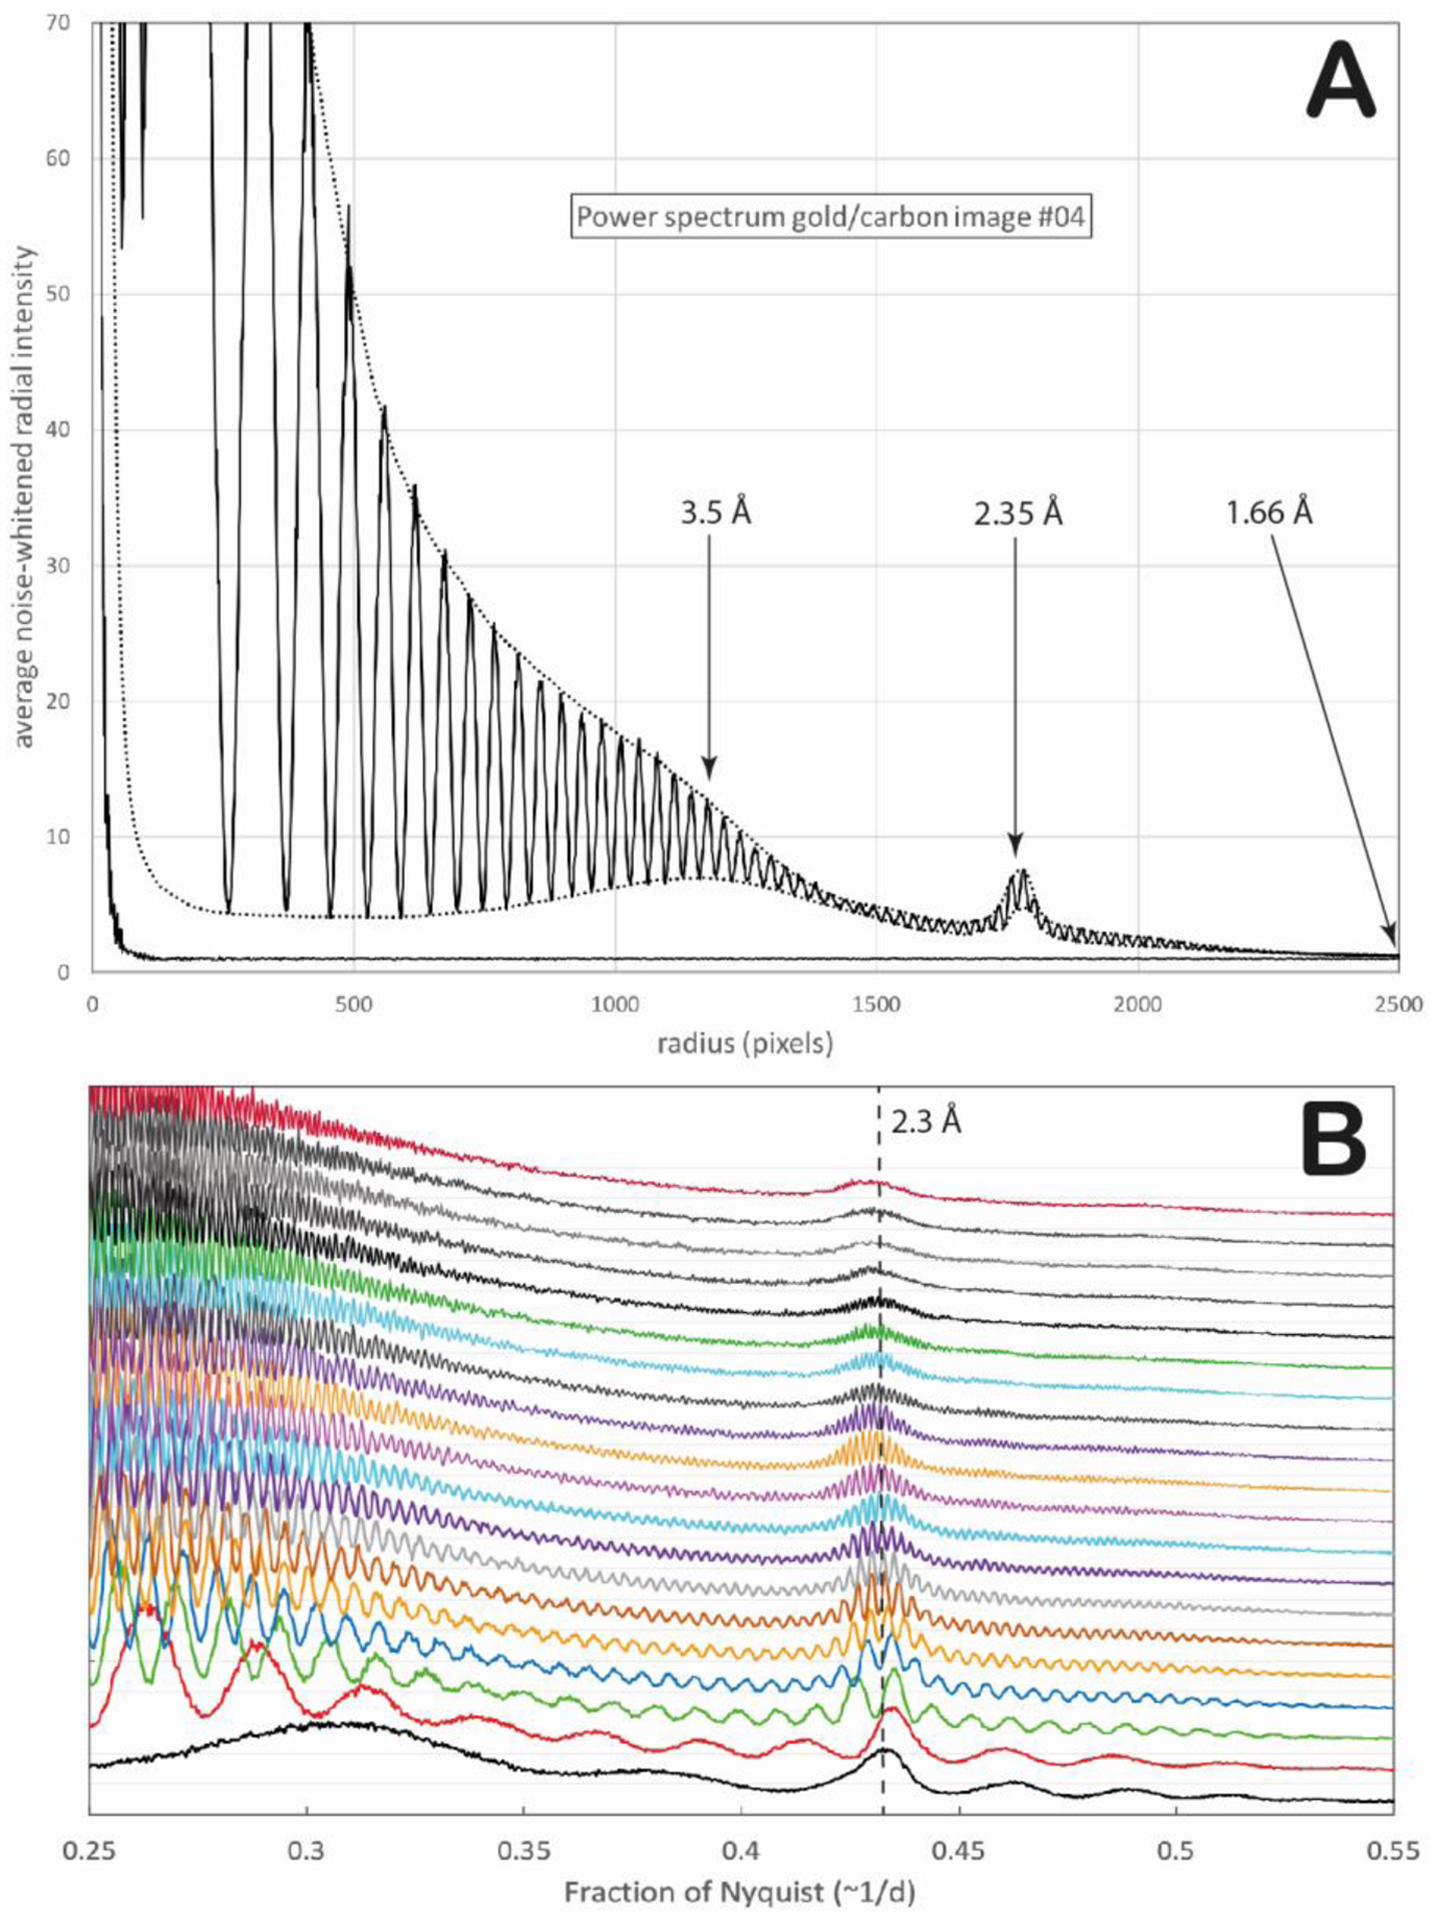
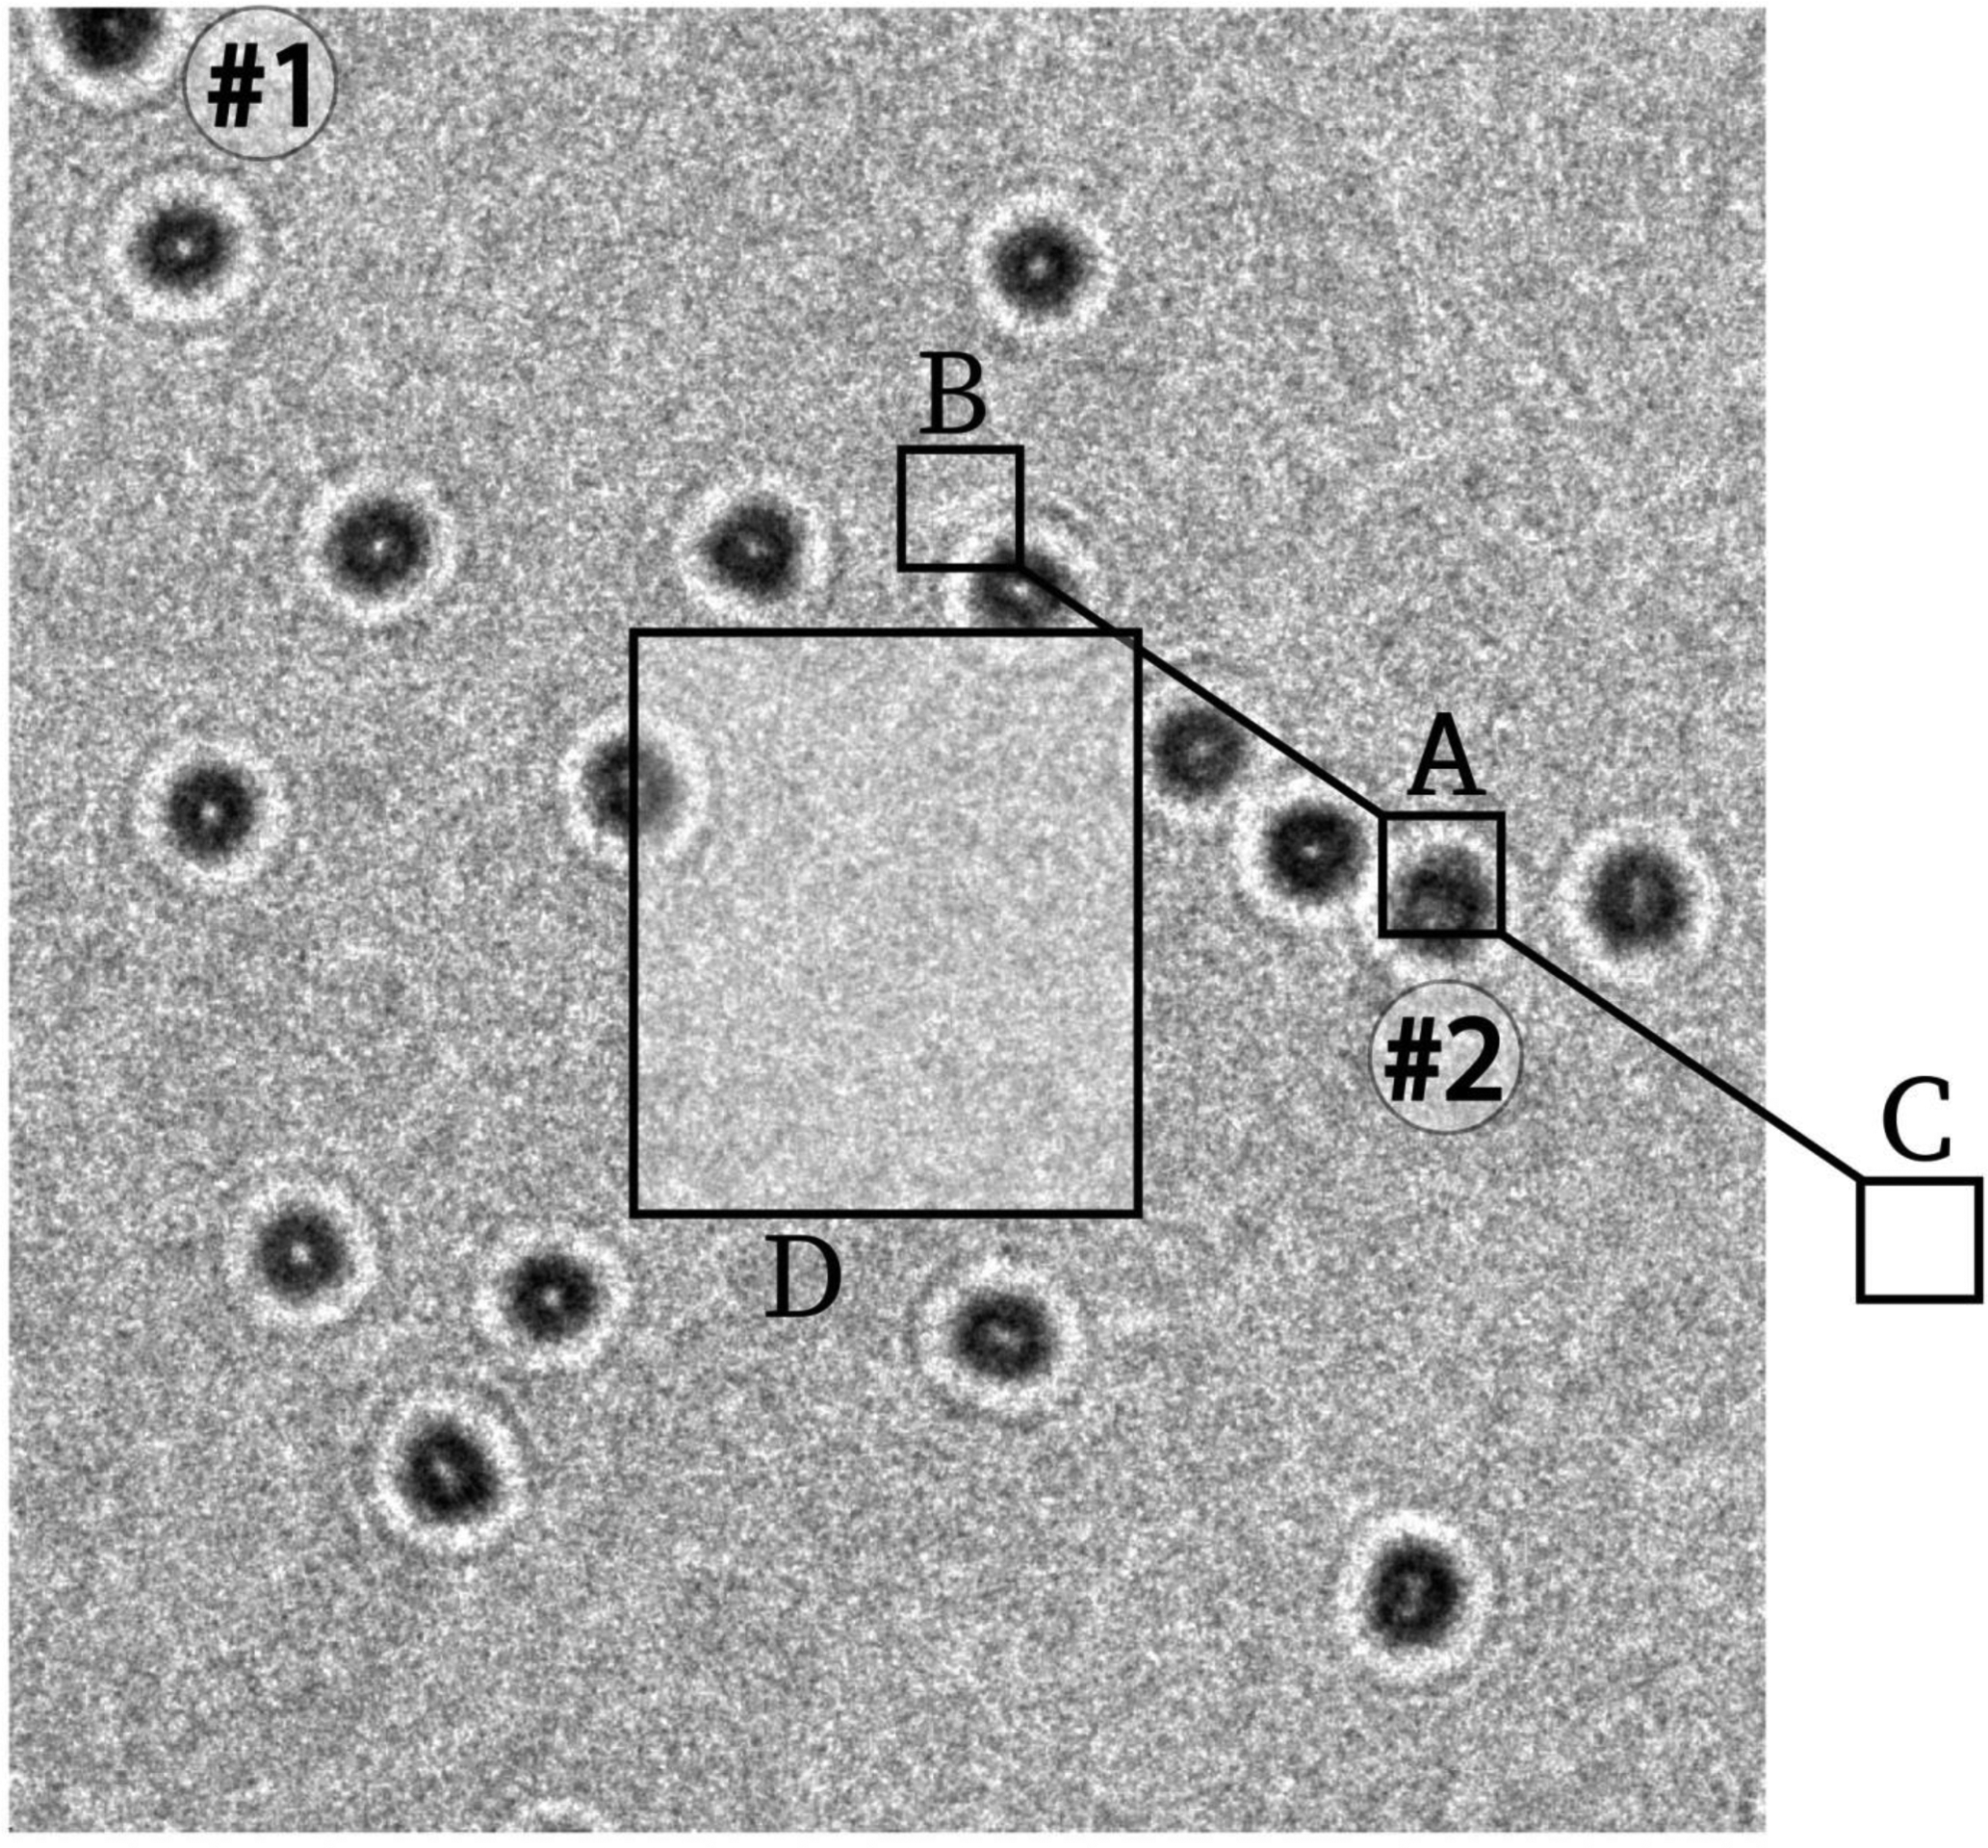
The brightness of modern Schottky field-emission guns can produce electron beams that have very high spatial coherence, especially for the weak-illumination conditions that are used for single-particle electron cryo-microscopy in structural biology. Even so, many users have observed defocus-dependent Thon-ring fading that has led them to restrict their data collection strategy to imaging with relatively small defocus values. In this paper, we reproduce the observation of defocus-dependent Thon-ring fading and produce a quantitative analysis and clear explanation of its causes. We demonstrate that a major cause is the delocalization of high-resolution Fourier components outside the field of view of the camera. We also show that, to correctly characterize the phenomenon, it is important to make a correction for linear magnification anisotropy. Even when the anisotropy is quite small, it is present at all defocus values before circular averaging of the Thon rings, as is also true before merging data from particles in many orientations. Under the conditions used in this paper, which are typical of those used in single-particle electron cryomicroscopy, fading of the Thon rings due to source coherence is negligible. The principal conclusion is that much higher values of defocus can be used to record images than is currently thought to be possible, keeping in mind that the above-mentioned delocalization of Fourier components will ultimately become a limitation. This increased understanding should give electron microscopists the confidence to use higher amounts of defocus to allow, for example, better visibility of their particles and Ewald sphere correction.

Keywords: Delocalization; High defocus; Spatial coherence.


Conflict of interest statement

Conflict of information statement

All authors declare that they have no conflicts of information related to this paper.

Figures

Figure 1.
Figure 1.
Examples showing the focus-dependent delocalization of information carried by interference between scattered electrons and the unscattered, reference wave. (A) Low-magnification view of the 4 images (gold-01 to gold-04) taken with the least amount of defocus, namely 0.02, 0.43, 0.87 and 1.3 μm. The strongest diffraction from an individual gold nanoparticle can be seen in the top left particle, labelled #1, of the last (1.3 μm defocus) image shown. This is the same particle shown at higher magnification in the left panel of Fig. 1B. Particle #2, whose fringes are shown in the right panel of Fig. 1B, is also labelled. (B) Subregions of two images showing the gold (111) fringes at 2.35 Å spacing. These images are for particle #1 from gold-04 image with 1.3 μm defocus, and for particle #2 from gold-20 image with 8 μm defocus. The region shown in the right panel is region B in Fig.3, showing that the gold-lattice fringes from particle #2 are separated by 700 Å from the image of particle #2 itself. (C) Fourier transform of the image recorded at a defocus value of 1.3 μm (gold-04), showing the Thon-ring sampling of the Au (111) spots.
Figure 2.
Figure 2.
1-D power spectra of images recorded at various values of defocus. (A) The power spectrum for the image taken at 1.3 μm defocus, along with that of an image recorded without a specimen, are shown to illustrate the methodology of the data analysis presented in this paper. (B) Power spectra of the region between 0.25–0.55 Nyquist for all 20 images, offset from one another in order to see the gradual changes in the modulation of Thon rings that occur as the amount of defocus increases from 0.0 μm to 8.0 μm, in defocus steps of 4250 Å.
Figure 3.
Figure 3.
Image “gold-20”, recorded at 8 μm defocus, showing how delocalization of one of the half-wavelets corresponding to the Au (111) lattice planes is moved outside the field of view of the camera. Gold nanoparticle #2 is labelled, with the diffracting crystallite labelled A, and the positions of 2.35 Å lattice fringe patches labelled B and C. Area C is outside the field of view, so this half-wavelet is not observed and it does not contribute to the power spectrum. Area B is shown at higher magnification in the right panel of Fig. 1B. The area outlined in the center would be the only region able to produce Thon-ring modulations at the 2.35 Å gold-lattice spacing in all directions, but, within this field of view, there is only about half of one of the 17 gold particles that is located within the outlined area. As a result, the power spectrum of this image shows no Thon-ring contribution to the power spectrum of such nanoparticles.
Figure 4.
Figure 4.
Plots showing how the Thon-ring modulation depths, in different resolution bands, decrease as the defocus is increased. Theoretical curves show the fraction of the area of the field-of-view for which both wavelets remain in the recorded image, whereas circles (9 Å), triangles (7 Å), and diamonds (2.3 Å) represent the experimental data shown in Figure 2B. The Thon-ring modulations at 2.3 Å come from the limited number of gold nanoparticles, some of which are not all in the correct orientation to diffract at that resolution, and others of which have fringes that are delocalized out of the field of view when the defocus is high enough. We believe that this may contribute to the scatter in the last few points at 2.3 Å.

References

    1. Born M, Wolf E, 1997. Principles of optics: electromagnetic theory of propagation, interference and diffraction of light, 6th ed. Cambridge University Press, Cambridge, UK.
    1. Börrnert F, Renner J, Kaiser U, 2018. Electron Source Brightness and Illumination Semi-Angle Distribution Measurement in a Transmission Electron Microscope. Microscopy and Microanalysis 24, 249–255. - PubMed
    1. Cheng YF, 2015. Single-Particle Cryo-EM at Crystallographic Resolution. Cell 161, 450–457. - PMC - PubMed
    1. Crowther RA, Henderson R, Smith JM, 1996. MRC image processing programs. Journal of Structural Biology 116, 9–16. - PubMed
    1. de Jong AF, Van Dyck D, 1993. Ultimate resolution and information in electron microscopy II. The information limit of transmission electron microscopes. Ultramicroscopy 49, 66–80.

Publication types

LinkOut - more resources