Clinical Trial
. 2021 Mar:118:102598.
doi: 10.1016/j.jaut.2021.102598. Epub 2021 Jan 22.

COVID-19 convalescent plasma composition and immunological effects in severe patients

Affiliations
Clinical Trial

COVID-19 convalescent plasma composition and immunological effects in severe patients

Yeny Acosta-Ampudia et al. J Autoimmun. 2021 Mar.

Abstract

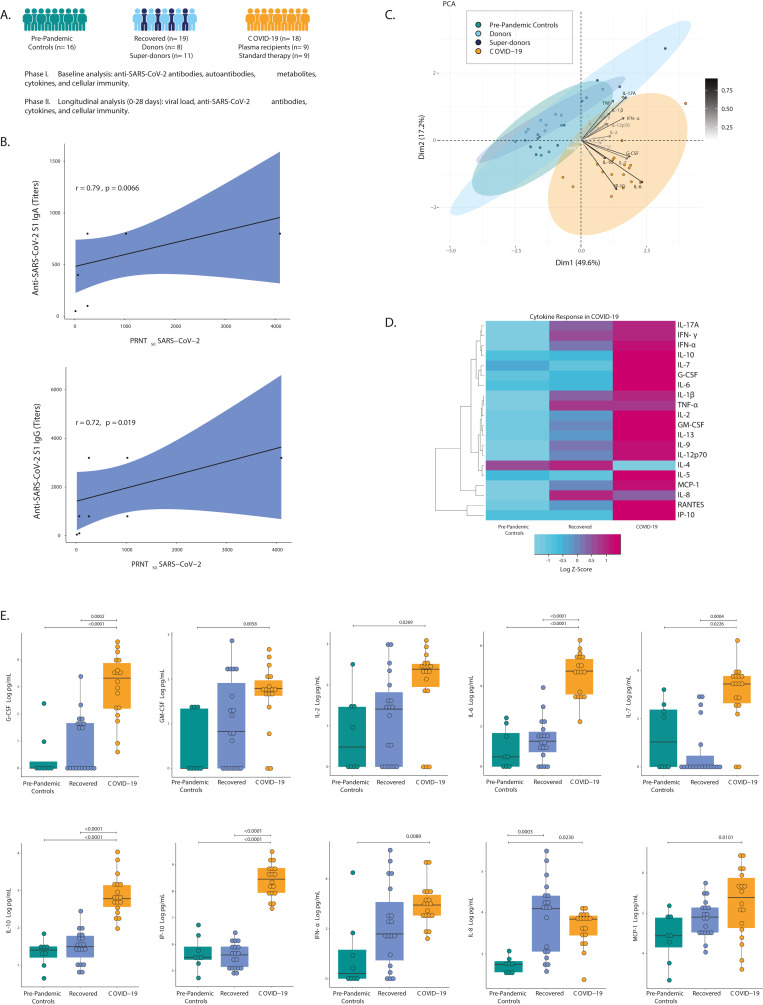
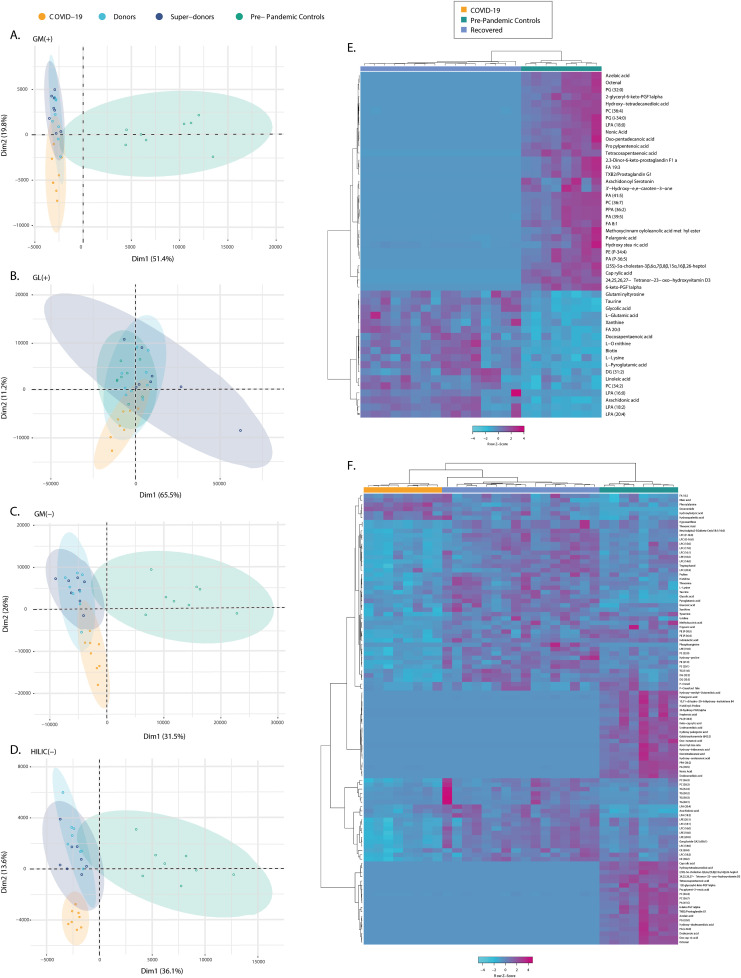
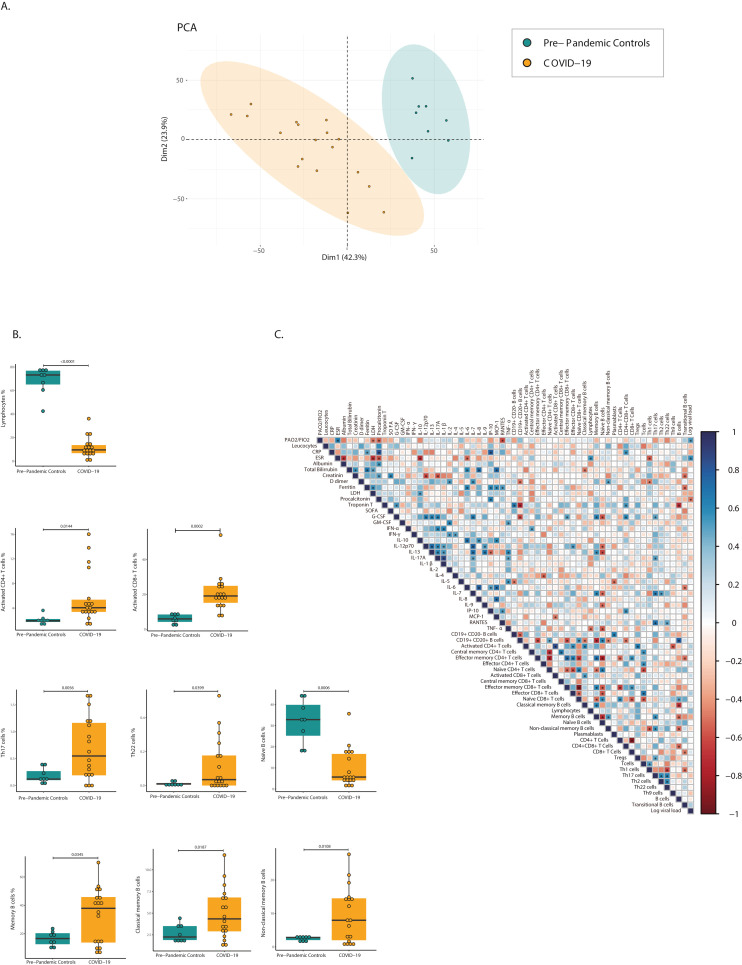
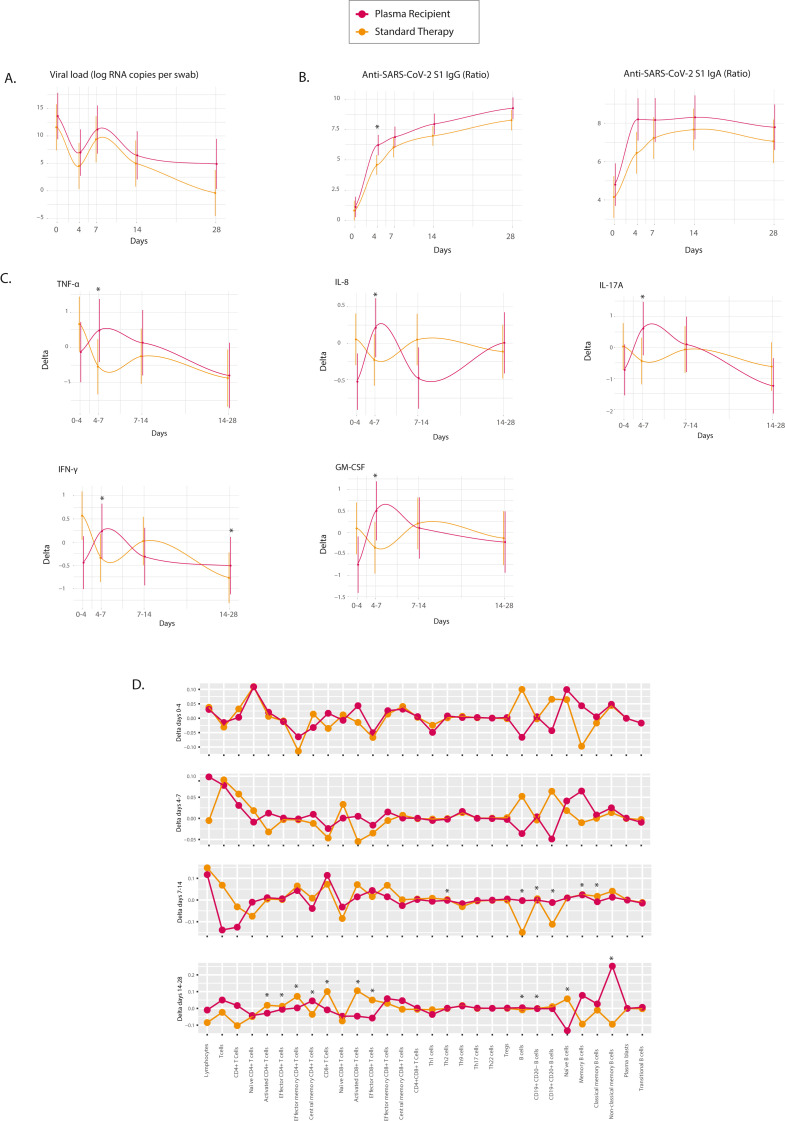
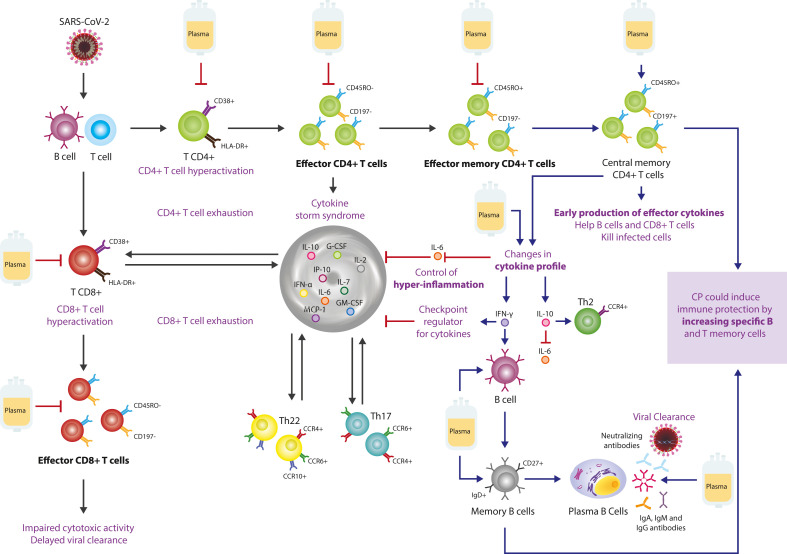
Convalescent plasma (CP) has emerged as a treatment for COVID-19. However, the composition and mechanism of action are not fully known. Therefore, we undertook a two-phase controlled study in which, first the immunological and metabolomic status of recovered and severe patients were evaluated. Secondly, the 28-day effect of CP on the immune response in severe patients was assessed. Nineteen recovered COVID-19 patients, 18 hospitalized patients with severe disease, and 16 pre-pandemic controls were included. Patients with severe disease were treated with CP transfusion and standard therapy (i.e., plasma recipients, n = 9) or standard therapy alone (n = 9). Clinical and biological assessments were done on day 0 and during follow-up on days 4, 7, 14, and 28. Clinical parameters, viral load, total immunoglobulin (Ig) G and IgA anti-S1-SARS-CoV-2 antibodies, neutralizing antibodies (NAbs), autoantibodies, cytokines, T and B cells, and metabolomic and lipidomic profiles were examined. Total IgG and IgA anti-S1-SARS-CoV-2 antibodies were key factors for CP selection and correlated with NAbs. In severe COVID-19 patients, mostly interleukin (IL)-6 (P = <0.0001), IL-10 (P = <0.0001), IP-10 (P = <0.0001), fatty acyls and glycerophospholipids were higher than in recovered patients. Latent autoimmunity and anti-IFN-α antibodies were observed in both recovered and severe patients. COVID-19 CP induced an early but transient cytokine profile modification and increases IgG anti-S1-SARS-CoV-2 antibodies. At day 28 post-transfusion, a decrease in activated, effector and effector memory CD4+ (P < 0.05) and activated and effector CD8+ (P < 0.01) T cells and naïve B cells (P = 0.001), and an increase in non-classical memory B cells (P=<0.0001) and central memory CD4+ T cells (P = 0.0252) were observed. Moreover, IL-6/IFN-γ (P = 0.0089) and IL-6/IL-10 (P = 0.0180) ratios decreased in plasma recipients compared to those who received standard therapy alone. These results may have therapeutic implications and justify further post-COVID-19 studies.

Keywords: Autoantibodies; COVID-19; Convalescent plasma; Cytokines; Memory cells; Metabolomic profile.


Conflict of interest statement

None.

Figures

Fig. 1
Fig. 1
Immunological features of recovered and COVID-19 patients. A, Study summary flow diagram. Clinical analyses were done (see text for details, section 2.7). B, Strong Spearman correlation of IgA and IgG anti-SARS-CoV-2 titers by ELISA and neutralizing antibodies by PRNT50 in recovered patients. C, Analysis of cytokines by PCA shows that pre-pandemic controls, donors, and super-donors aggregate, whereas COVID-19 patient data segregates as an independent group. Color shows the data grouping. D, Heatmap of cytokine analysis among pre-pandemic controls, the recovered group, and COVID-19 patients. The color of the heatmap varies from blue, which indicates under-expression, to purple, which indicates over-expression. Row clustering was performed using the ward agglomeration method. The log-transformed cytokine concentration was used to construct the heatmap. The heatmap reflects the z scores of cytokines across groups, and it does not represent statistical significance. E, Representative box plots of cytokines that were plotted as log-transformed concentrations. Statistical analysis was performed using generalized linear mixed models that were adjusted for group, age, and sex. Abbreviations: G-CSF: Granulocyte colony-stimulating factor; GM -CSF: Granulocyte-macrophage colony stimulating factor; IFN: Interferon; Ig: Immunoglobulin; IL: Interleukin; IP-10: interferon-γ induced protein 10; MCP-1: Monocyte chemotactic protein-1; RANTES: Regulated on activation, normal T cell expressed and secreted; PCA, principal-component analysis; PRNT, plaque reduction neutralization test; TNF-α: Tumor necrosis factor-alpha.
Fig. 2
Fig. 2
PCA score plots for global lipidomics (GL) and metabolomics (GM) and heatmaps of significant metabolites. A, GL by RP-LC-QTOF-MS (+): R2 (cum): 0.92, Q2 (cum): 0.798. B, GM by LC-QTOF-MS (+): R2 (cum): 0.832, Q2 (cum): 0.72. C, GM by LC-QTOF-MS (−): R2 (cum): 0.697, Q2 (cum): 0.475. D, GM by HILIC-LC-QTOF-MS (−): R2 (cum): 0.704, Q2 (cum): 0.444. Color shows the data grouping. COVID-19 (n = 8); donors (n = 8); super-donors (n = 8); and pre-pandemic controls (n = 8). E, Heatmap of recovered vs. pre-pandemic controls comparison. F, Heatmap of COVID-19 vs. recovered and pre-pandemic controls comparison. The significant features were selected by: 1) UVA (p-value with a Benjamin–Hochberg false discovery rate (FDR) post hoc correction < 0.05); and 2) multivariate analysis (MVA) criteria VIP>2 with JK not including the zero value from orthogonal partial least-squares discriminant analysis (OPLS-DA) with CV-ANOVA < 0.05); and 3) Percent change >50%. Abbreviations: CE: Cholesteryl; DG: Diacylglycerols; FA: Fatty acyls; GM: Global metabolomics; GL: Global lipidomics; HILIC: Hydrophilic interaction liquid chromatography; LPA: Lysophosphatidic acid; LPC: Lysophosphatidylcholine; LPE: Lysophosphatidylethanolamine; PC: Phosphatidylcholine; PE: Phosphatidylethanolamine; PS: Phosphoserine; TXB2: Thromboxane B2. (For interpretation of the references to color in this figure legend, the reader is referred to the Web version of this article.)
Fig. 3
Fig. 3
Cellular immune profile and correlation between biological and clinical parameters in COVID-19. A, Principal component analysis of 30 cell subsets that were analyzed in pre-pandemic controls and COVID-19 patients. Color shows the data grouping for pre-pandemic controls (n = 8) and COVID-19 (n = 18). B, Significant differences in immune cell subsets between pre-pandemic controls and COVID-19 patients are plotted as percentages. Each dot represents a subject. For all box plots, the center is the median of the measurement, and the lower and upper lines of the box correspond to the first and third percentiles. Statistical analysis was performed using generalized linear mixed models adjusted for group, age, and sex. C, Correlation matrix of cytokines, cell subsets, and clinical features of COVID-19 patients at day 0. Spearman correlation coefficient is visualized by color intensity. Only significant correlations (P < 0.05) and those adjusted by Holm's correction are presented with an asterisk. Abbreviations: CD: Cluster of differentiation; CRP: C reactive protein; ESR: Erythrocyte sedimentation rate; G-CSF: Granulocyte colony-stimulating factor; GM-CSF: Granulocyte-macrophage colony stimulating factor; IFN: Interferon; IL: Interleukin; IP-10: interferon-γ induced protein 10; LDH: Lactate dehydrogenase; MCP-1: Monocyte chemotactic protein-1; RANTES: Regulated on activation, normal T cell expressed and secreted; SOFA: Sequential organ failure assessment; Th: T helper; TNF- α: Tumor necrosis factor-alpha; Tregs: Regulatory T cells. (For interpretation of the references to color in this figure legend, the reader is referred to the Web version of this article.)
Fig. 4
Fig. 4
Longitudinal immune profile of standard therapy vs. convalescent plasma recipients. A, Temporal delta changes in the viral load were plotted as log RNA copies per swab against days of follow-up for standard therapy (n = 9) and plasma recipient (n = 9) groups. B, Dynamics of the SARS-CoV-2 antibody response and the change in anti-SARS-CoV-2 IgA and IgG ratios (OD sample/OD calibrator) were plotted against days of follow-up. Estimated ratios from generalized linear mixed models are presented. C, Estimated delta of significant cytokine concentrations in standard therapy vs. the plasma recipient group. D, Estimated delta of all the lymphocyte subsets in standard therapy vs. the plasma recipient group. All significant β interactions for delta change in day × therapy are depicted with an asterisk. Abbreviations: CD: Cluster of differentiation; GM-CSF: Granulocyte-macrophage colony stimulating factor; IFN: Interferon; Ig: Immunoglobulin; IL: Interleukin; Th: T helper; TNF- α: Tumor necrosis factor-alpha; Tregs: Regulatory T cells.
Fig. 5
Fig. 5
Possible mechanisms of action of convalescent plasma in severe COVID-19 patients. Upon infection with SARS-CoV-2, T cells are activated by viral proteins presented by B cells, then they undergo clonal expansion. Enrichment of activated CD38+ HLA-DR + CD4+ and CD8+ T cells leads to dysfunctional effector cells with an ineffective state of differentiation, preceding T cell exhaustion. Th17 and Th22 perpetuates inflammation. CP blocks the hyperactivation of CD4+ and CD8+ T cells, and decreases effector T cells. Most effector T cells die, but a subset persists, transitioning to memory T cells. CP decreases IL-6 and increases IFN-γ and IL-10, and increases central memory CD4+ T cells, which can be located in secondary lymphoid tissues, to be reactivated by exposure to antigen. CP also increases B and memory B cells, which can differentiate into long-lived plasma cells to maintain long-term antibody production. Black lines indicate the effect induced by SARS-CoV-2 infection. Blue lines indicate the stimulation effect generated by the CP. Red lines indicate the inhibitory effect generated by CP. Abbreviations: CCR: C–C chemokine receptor; CD: Cluster of differentiation; CP: Convalescent plasma; HLA: human leukocyte antigen, Ig: Immunoglobulin; IL: Interleukin; IP-10: interferon-γ induced protein 10; IFN: Interferon; G-CSF: Granulocyte colony-stimulating factor; GM-CSF: Granulocyte-macrophage colony stimulating factor; MCP-1: Monocyte Chemotactic Protein-1; Th: T helper. (For interpretation of the references to color in this figure legend, the reader is referred to the Web version of this article.)

References

    1. Guan W.-J., Ni Z.-Y., Hu Y., Liang W.-H., Ou C.-Q., He J.-X., Liu L., Shan H., Lei C.-L., Hui D.S.C., Du B., Li L.-J., Zeng G., Yuen K.-Y., Chen R.-C., Tang C.-L., Wang T., Chen P.-Y., Xiang J., Li S.-Y., Wang J.-L., Liang Z.-J., Peng Y.-X., Wei L., Liu Y., Hu Y.-H., Peng P., Wang J.-M., Liu J.-Y., Chen Z., Li G., Zheng Z.-J., Qiu S.-Q., Luo J., Ye C.-J., Zhu S.-Y., Zhong N.-S. Clinical characteristics of coronavirus disease 2019 in China. N. Engl. J. Med. 2020;382:1708–1720. doi: 10.1056/NEJMoa2002032. - DOI - PMC - PubMed
    1. Berenguer J., Ryan P., Rodríguez-Baño J., Jarrín I., Carratalà J., Pachón J., Yllescas M., Arriba J.R. vol. 26. The Official Publication of the European Society of Clinical Microbiology and Infectious Diseases; 2020. pp. 1525–1536. (Characteristics and Predictors of Death Among 4035 Consecutively Hospitalized Patients with COVID-19 in Spain., Clinical Microbiology and Infection). - DOI - PMC - PubMed
    1. Rojas M., Rodríguez Y., Monsalve D.M., Acosta-Ampudia Y., Camacho B., Gallo J.E., Rojas-Villarraga A., Ramírez-Santana C., Díaz-Coronado J.C., Manrique R., Mantilla R.D., Shoenfeld Y., Anaya J.-M. Convalescent plasma in Covid-19: possible mechanisms of action. Autoimmun. Rev. 2020;19:102554. doi: 10.1016/j.autrev.2020.102554. - DOI - PMC - PubMed
    1. Wood E.M., Estcourt L.J., McQuilten Z. How should we use convalescent plasma therapies for COVID-19? Blood. 2020 doi: 10.1182/blood.2020008903. blood.2020008903. - DOI - PMC - PubMed
    1. van Griensven J., Edwards T., de Lamballerie X., Semple M.G., Gallian P., Baize S., Horby P.W., Raoul H., Magassouba N., Antierens A., Lomas C., Faye O., Sall A.A., Fransen K., Buyze J., Ravinetto R., Tiberghien P., Claeys Y., De Crop M., Lynen L., Bah E.I., Smith P.G., Delamou A., De Weggheleire A., Haba N. Evaluation of convalescent plasma for Ebola virus disease in Guinea. N. Engl. J. Med. 2016;374:33–42. doi: 10.1056/NEJMoa1511812. - DOI - PMC - PubMed

Publication types