

Host transcriptional response to TB preventive therapy differentiates two sub-groups of IGRA-positive individuals
- PMID: 33524936
- PMCID: PMC7985621
- DOI: 10.1016/j.tube.2020.102033
Host transcriptional response to TB preventive therapy differentiates two sub-groups of IGRA-positive individuals
Abstract
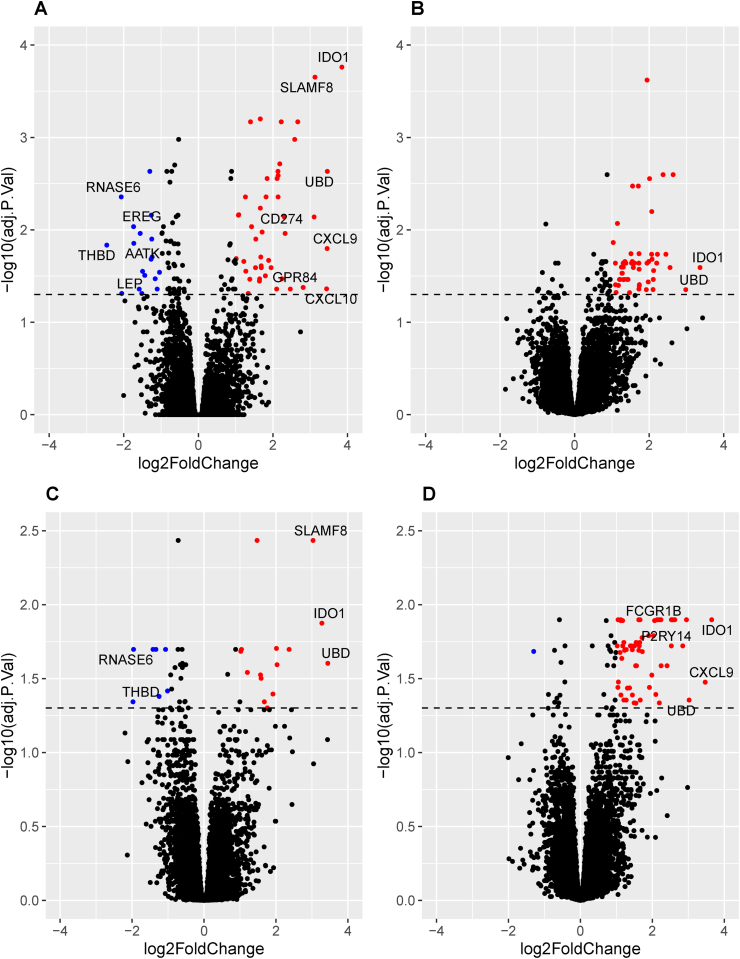
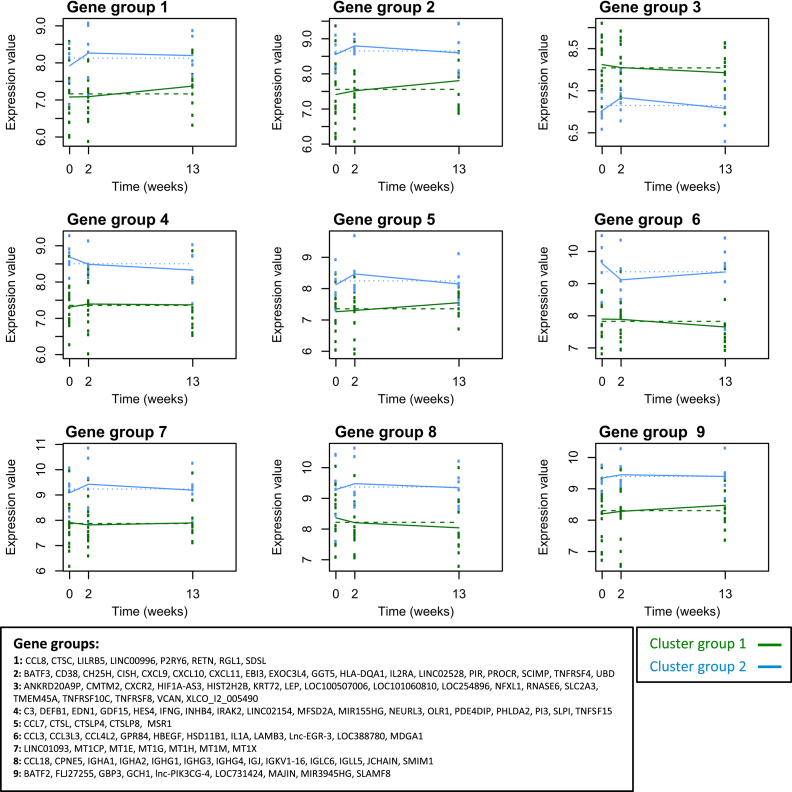
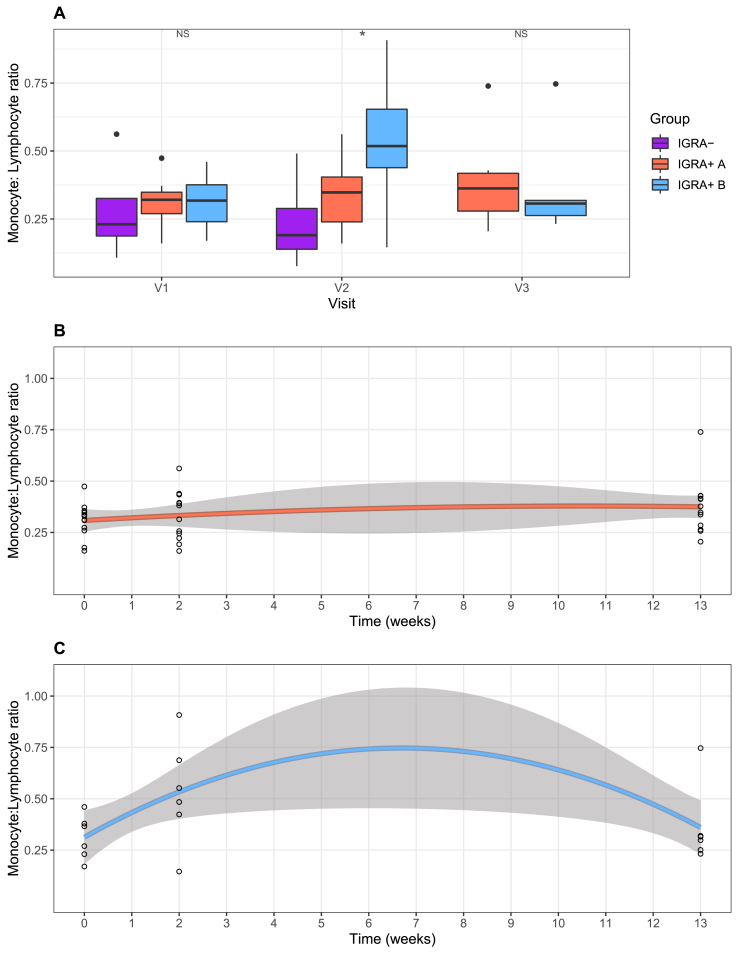
We hypothesised that individuals with immunological sensitisation to Mycobacterium tuberculosis (Mtb), conventionally regarded as evidence of latent tuberculosis infection (LTBI), would demonstrate binary responses to preventive therapy (PT), reflecting the differential immunological consequences of the sterilisation of viable infection in those with active Mtb infection versus no Mtb killing in those who did not harbour viable bacilli. We investigated longitudinal whole blood transcriptional profile responses to PT of Interferon gamma release assay (IGRA)-positive tuberculosis contacts and IGRA-negative, tuberculosis-unexposed controls. Longitudinal unsupervised clustering analysis with a subset of 474 most variable genes in antigen-stimulated blood separated the IGRA-positive participants into two distinct subgroups, one of which clustered with the IGRA-negative controls. 117 probes were differentially expressed over time between the two cluster groups, many of them associated with immunological pathways important in mycobacterial control. We contend that the differential host RNA response reflects lack of Mtb viability in the group that clustered with the IGRA-negative unexposed controls, and Mtb viability in the group (1/3 of IGRA-positives) that clustered away. Gene expression patterns in the blood of IGRA-positive individuals emerging during the course of PT, which reflect Mtb viability, could have major implications in the identification of risk of progression, treatment stratification and biomarker development.
Keywords: Latent tuberculosis infection; Preventive therapy; Transcriptome.
Copyright © 2020 The Authors. Published by Elsevier Ltd.. All rights reserved.
Figures
References
-
- World Health Organisation . 2018. Latent tuberculosis infection: updated and consolidated guidelines for programmatic management. Geneva. - PubMed
-
- Whalen C.C., Johnson J.L., Okwera A., Hom D.L., Huebner R., Mugyenyi P. A trial of three regimens to prevent tuberculosis in Ugandan adults infected with the human immunodeficiency virus. Uganda-Case Western Reserve University Research Collaboration. N Engl J Med. 1997;337(12):801–808. - PubMed
-
- Chain B. agilp: Agilent expression array processing package. http://bioconductor.org/packages/release/bioc/html/agilp.html R package version 3.14.0. 2018 [Available from:
Publication types
MeSH terms
Substances
Grants and funding
LinkOut - more resources
Full Text Sources
Other Literature Sources
