. 2021 Apr;112(4):1589-1602.
doi: 10.1111/cas.14833. Epub 2021 Feb 16.

Epstein-Barr virus latent membrane protein-1 upregulates autophagy and promotes viability in Hodgkin lymphoma: Implications for targeted therapy

Affiliations

Epstein-Barr virus latent membrane protein-1 upregulates autophagy and promotes viability in Hodgkin lymphoma: Implications for targeted therapy

Hui-Chen Lin et al. Cancer Sci. 2021 Apr.

Abstract

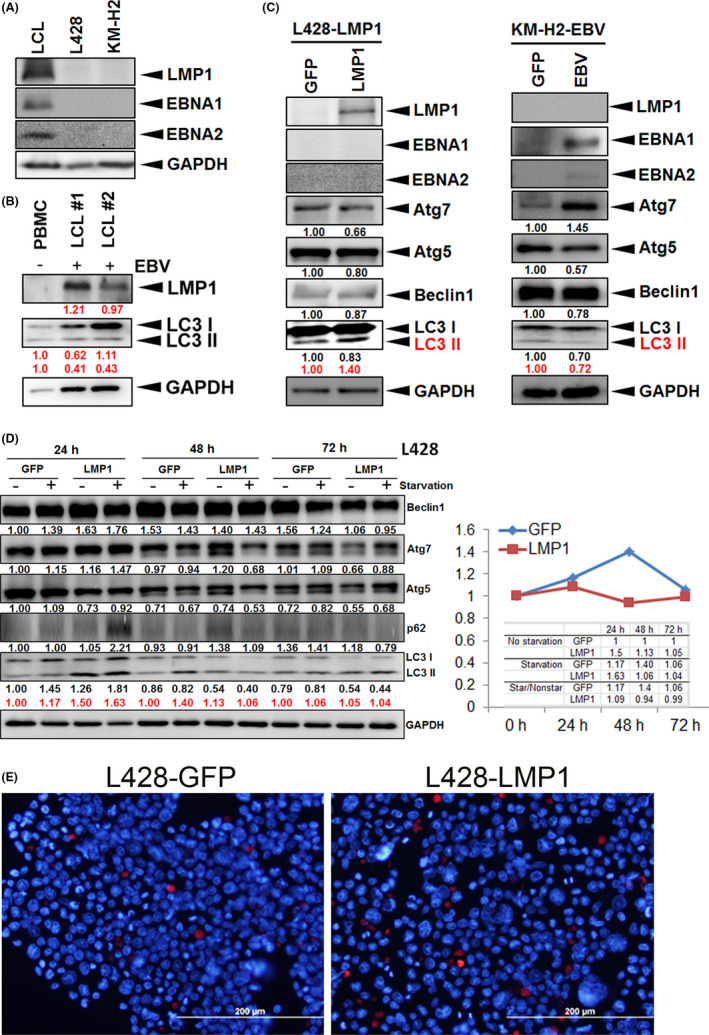
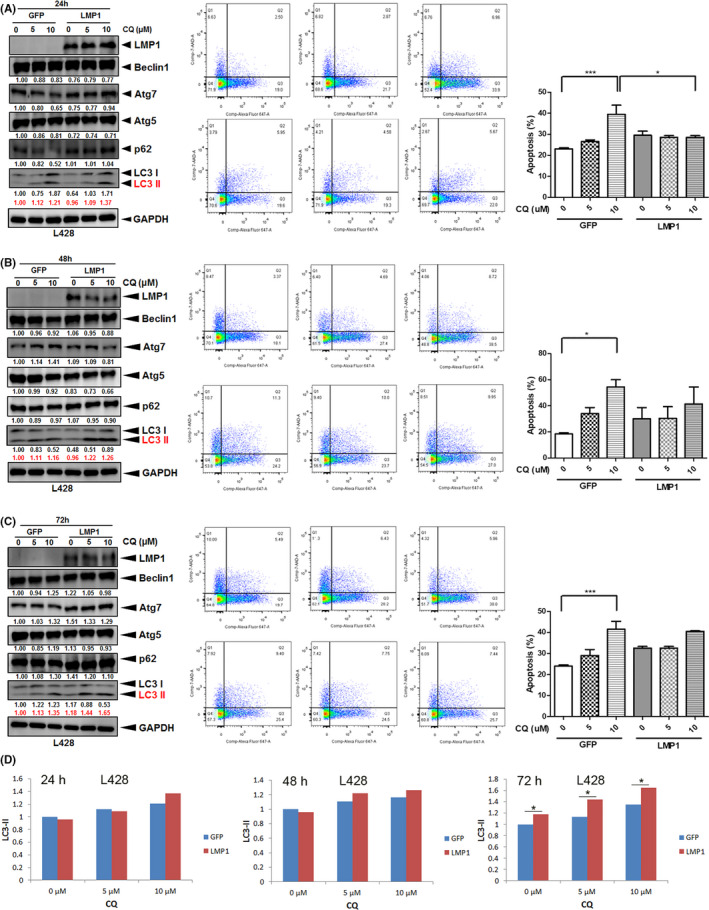
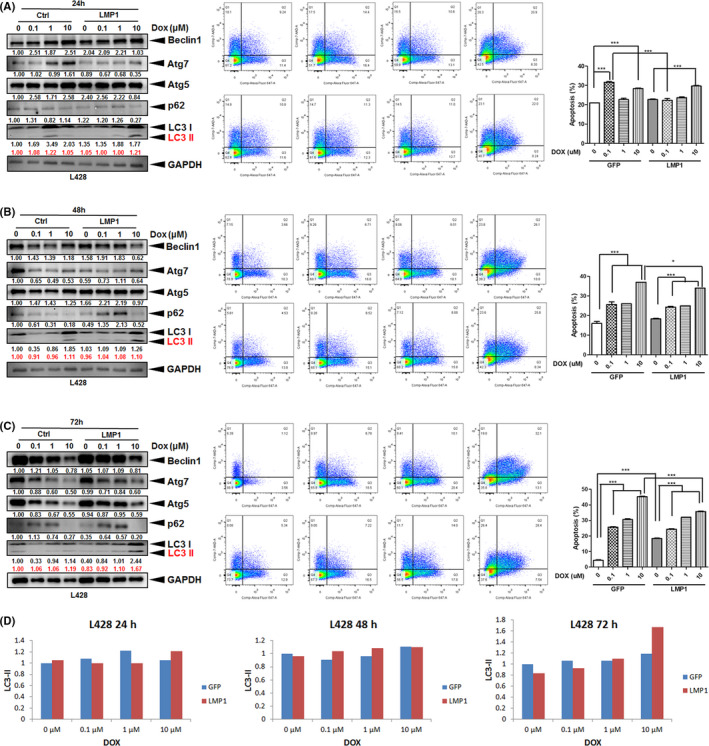
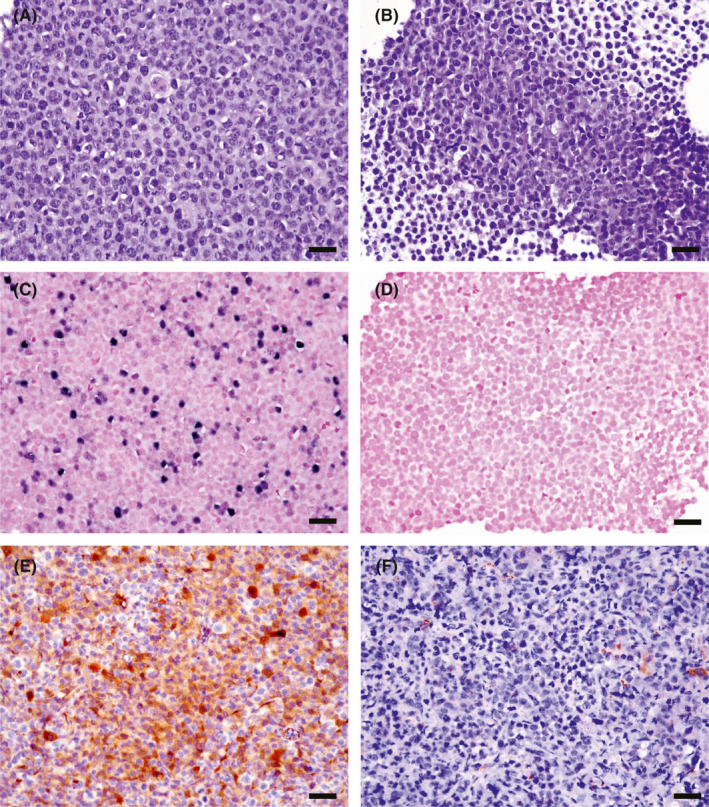
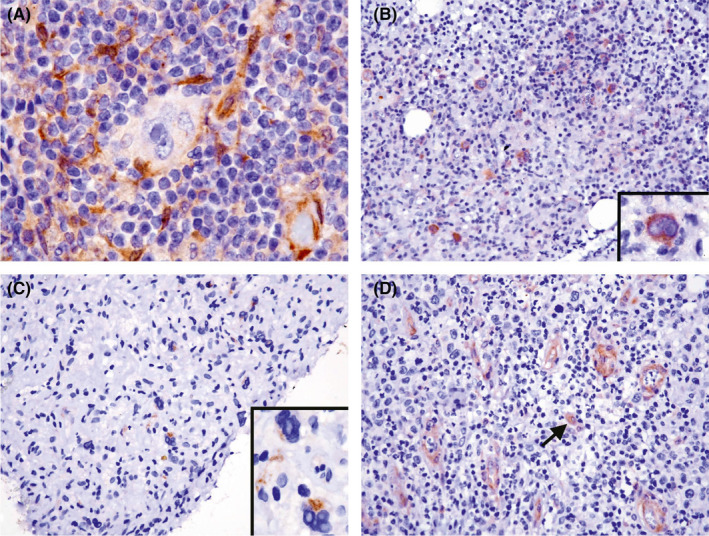
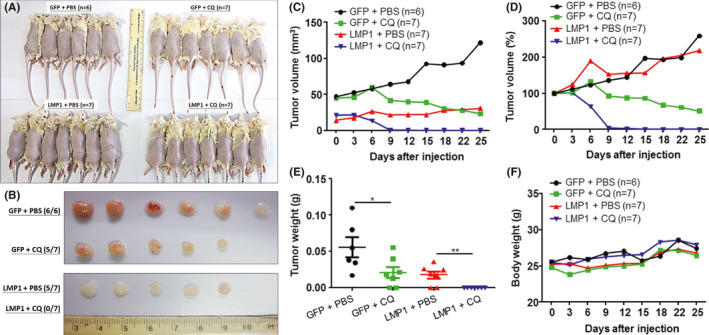
Hodgkin lymphoma (HL) is composed of neoplastic Hodgkin and Reed-Sternberg cells in an inflammatory background. The neoplastic cells are derived from germinal center B cells that, in most cases, are infected by Epstein-Barr virus (EBV), which may play a role in tumorigenesis. Given that EBV-latent membrane protein 1 (LMP1) regulates autophagy in B cells, we explored the role of autophagy mediated by EBV or LMP1 in HL. We found that EBV-LMP1 transfection in HL cells induced a modest increase in autophagy signals, attenuated starvation-induced autophagic stress, and alleviated autophagy inhibition- or doxorubicin-induced cell death. LMP1 knockdown leads to decreased autophagy LC3 signals. A xenograft mouse model further showed that EBV infection significantly increased expression of the autophagy marker LC3 in HL cells. Clinically, LC3 was expressed in 15% (19/127) of HL samples, but was absent in all cases of nodular lymphocyte-predominant and lymphocyte-rich classic HL cases. Although expression of LC3 was not correlated with EBV status or clinical outcome, autophagic blockade effectively eradicated LMP1-positive HL xenografts with better efficacy than LMP1-negative HL xenografts. Collectively, these results suggest that EBV-LMP1 enhances autophagy and promotes the viability of HL cells. Autophagic inhibition may be a potential therapeutic strategy for treating patients with HL, especially EBV-positive cases.

Keywords: Epstein-Barr virus; Hodgkin lymphoma; autophagy; chloroquine; latent membrane protein-1; xenograft.


Conflict of interest statement

The authors declare no conflicts of interest.

Figures

FIGURE 1
FIGURE 1
LMP1 increases autophagy in HL cells and helps HL cells adapt to starvation‐induced autophagic stress. A, Expression patterns of LMP1 in LCL, parental EBV‐negative L428 or KM‐H2 cell lines. The cell lines (LCL, L428, and KM‐H2) were blotted with antibodies against LMP1 and GAPDH. GAPDH served as the loading control. B, Expression of LMP1 and autophagic markers in PBMCs infected with EBV. The samples from parental PBMCs, EBV‐infected newly formed (#1) and long‐termed (#2) LCLs were blotted with αLMP1 (LMP1) and αLC3 (LC3‐I and ‐II) antibodies. The red numbers represent relative band intensities normalized by GAPDH. C, Expression of autophagic markers in L428‐LMP1 (left) and KM‐H2‐EBV (right) cells. C, left panel, The LMP1‐transfected L428 cells had undergone stable selection and show expression of LMP1 but not EBNA1 or EBNA2. Stably transfected L428 cells with a GFP‐expressing vector served as the nonexpressing control. LMP1 transfection increased LC3‐II expression but decreased expression of other autophagic proteins. C, right panel, KM‐H2‐EBV cells expressed EBNA1 but not LMP1 or EBNA2. Stably‐transfected KM‐H2 cells with a GFP‐expressing vector served as the nonexpressing control. EBV type I latency program augmented Atg7 expression but attenuated expression of LC3‐II, Atg5 and Beclin 1. The red numbers represent the relative band intensity of LC3‐II normalized by GAPDH. D, The changes in autophagic markers induced by starvation in L428 HL cells. The L428‐GFP and L428‐LMP1 cells (each 2 × 105 cells) were cultured in 100 μL of 2.5% FBS medium for 72 h. The samples were harvested at respective time points and assayed by blotting with antibodies against Beclin1, Atg7, Atg5, p62, LC3, and GAPDH. The numbers represent the relative band intensities normalized by GAPDH (red for LC3‐II). The changes of LC3‐II ratio (starvation divided by nonstarvation) are plotted. Other autophagic proteins show a similar trend with LC3‐II. E, Stable cell lines (L428‐GFP and L428‐LMP1) were stained by αLC3 antibody on immunofluorescence, which shows more LC3‐II signals (red) in L428‐LMP than those in L428‐GFP cells (31/383 = 8.1% vs 9/449 = 2.0%, P < .001; blue, DAPI for nuclear staining)
FIGURE 2
FIGURE 2
LMP1 increases autophagic flux LC3‐II and rescues chloroquine (CQ)‐induced death in HL cells. L428‐LMP1 and the control L428‐GFP (1.5 × 106 cells for each) were treated with 0, 5, or 10 µM chloroquine (CQ) for 24 h (A), 48 h (B), and 72 h. C, left panel, The samples were harvested and blotted with αLMP1, αBeclin1, αAtg7, αAtg5, αp62, αLC3, and αGAPDH antibodies. Red numbers indicate relative band intensities of LC3‐II normalized by GAPDH. Other autophagic proteins show a similar pattern with LC3‐II or unremarkable changes in protein expression. C, middle panel, Representative flow‐cytometry plots to evaluate the apoptotic cell death occurring in the identical samples in the left panel, which were harvested and stained for Annexin V (FL2) and 7‐AAD (FL3). C, right panel, Quantification of the flow data in the middle panel. The percentage of cells in quadrants 2 + 3 was used for plotting (n = 3, mean ± SEM). Asterisks represent P < .05 by paired t‐test (*P < .05, **P < .01, ***P < .001). D, LC3‐II ratios are plotted based on relative band intensities of LC3‐II normalized by GAPDH (red numbers)
FIGURE 3
FIGURE 3
LMP1 increases autophagic flux LC3‐II and rescues doxorubicin (DOX)‐induced death in HL cells. L428‐LMP1 and the control L428‐GFP (1.5 × 106 cells for each) were treated with 0, 0.1, 1, or 10 µM doxorubicin (DOX) for 24 h (A), 48 h (B), and 72 h. C, left panel, The samples were harvested and blotted with αBeclin1, αAtg7, αAtg5, αp62, αLC3 and αGAPDH antibodies. Red numbers indicate relative band intensities of LC3‐II normalized by GAPDH. In contrast to LC3‐I/II, other autophagic proteins demonstrated decreased expression along with HL cell death, especially at 10 μM DOX and at 48 and 72 h. C, middle panel, Representative flow‐cytometry plots to evaluate the apoptotic cell death occurring in the identical samples in the left panel, which were harvested and stained for Annexin V (FL2) and 7‐AAD (FL3). C, right panel, Quantification of the flow data in the middle panel. The percentage of cells in quadrants 2 + 3 was used for plotting (n = 3, mean ± SEM). Asterisks represent P value <.05 by paired t‐test (*P < .05, **P < .01, ***P < .001). D, Plots of the LC3‐II ratio normalized by GAPDH in immunoblotting
FIGURE 4
FIGURE 4
Xenograft mouse model shows that KM‐H2‐EBV HL cells (A, C, E, X400) express autophagic protein LC3A/B more frequently than KM‐H2‐GFP HL cells (B, D, F, X400). NOD/SCID mice were injected with KM‐H2‐EBV HL cells vs. KM‐H2‐GFP HL cells and were harvested 16 weeks later. The formed xenograft tumors from both groups (n = 10 for each) were examined immunohistochemically for LC3 expression. Histologically, KM‐H2‐EBV (A) and KM‐H2‐GFP (B) tumor cells are similar on H&E staining sections. EBER in situ hybridization confirms the presence of EBV‐encoded RNA in KM‐H2‐EBV (C) but not in KM‐H2‐GFP (D) xenograft. The in vivo model shows a higher expression rate of LC3A/B in KM‐H2‐EBV (E) vs KM‐H2‐GFP (F) tumors (8/10 vs 2/10, P = .007, Chi2‐test). Scale bar = 50 µM
FIGURE 5
FIGURE 5
LC3 expression in clinical HL samples is infrequent and only positive in ~15% of cases. A, This nodal case shows LC3 expression in the cytoplasm of histiocytes, but not in HL tumor cells (1000×, hematoxylin counterstain). B, This case with bone marrow involvement shows cytoplasmic expression of LC3 in HL tumor cells (200× inset, 1000× hematoxylin counterstain). C, The tumor cells of lymphocyte‐depleted (LD) subtype are positive for LC3 expression (400× inset, 1000× hematoxylin counterstain). D, Vascular endothelial cells and histiocytes (arrow) are typically positive for LC3 expression (400× hematoxylin counterstain)
FIGURE 6
FIGURE 6
Xenograft mouse model shows that CQ treatment effectively eradicated L428‐LMP1 xenograft more efficiently than did L428‐GFP xenograft. NOD/SCID mice were divided into four groups: GFP + PBS (n = 6), GFP + CQ (n = 7), LMP1 + PBS (n = 7), and LMP1 + CQ (n = 7). GFP, L428‐GFP xenograft; LMP1, L428‐LMP1 xenograft; CQ, CQ treatment (60 mg/kg for 25 days); PBS, PBS mock treatment control. A, Appearances of the mice and their injection sites on the back 25 days after tumor cell injection and treatment. B, The gross morphology of the excised tumors in (A). C‐F, Plots of the xenograft tumor sizes (C, mm3; D, percentages of the original size), tumor weights (E, grams), and the corresponding mouse weights (F, grams). Black, GFP + PBS; green, GFP + CQ; red, LMP1 + PBS; blue, LMP1 + CQ. Asterisks represent P value <.05 by Student t‐test

Similar articles

Cited by

References

    1. Diehl V, Thomas RK, Re D. Part II: Hodgkin's lymphoma–diagnosis and treatment. Lancet Oncol. 2004;5(1):19‐26. - PubMed
    1. Kuppers R. The biology of Hodgkin's lymphoma. Nat Rev Cancer. 2009;9(1):15‐27. - PubMed
    1. Ushmorov A, Leithauser F, Sakk O, et al. Epigenetic processes play a major role in B‐cell‐specific gene silencing in classical Hodgkin lymphoma. Blood. 2006;107(6):2493‐2500. - PubMed
    1. Piris MA, Medeiros LJ, Chang KC. Hodgkin lymphoma: a review of pathological features and recent advances in pathogenesis. Pathology. 2020;52(1):154‐165. - PubMed
    1. Schroder M, Kaufman RJ. The mammalian unfolded protein response. Annu Rev Biochem. 2005;74:739‐789. - PubMed

MeSH terms

Substances