Association of Quantitative Flow Ratio with Lesion Severity and Its Ability to Discriminate Myocardial Ischemia
- PMID: 33525067
- PMCID: PMC7853889
- DOI: 10.4070/kcj.2020.0375
Association of Quantitative Flow Ratio with Lesion Severity and Its Ability to Discriminate Myocardial Ischemia
Abstract
Background and objectives: Quantitative flow ratio (QFR) is an angiography-based technique for functional assessment of coronary artery stenosis. This study investigated the response of QFR to different degree of stenosis severity and its ability to predict the positron emission tomography (PET)-defined myocardial ischemia.
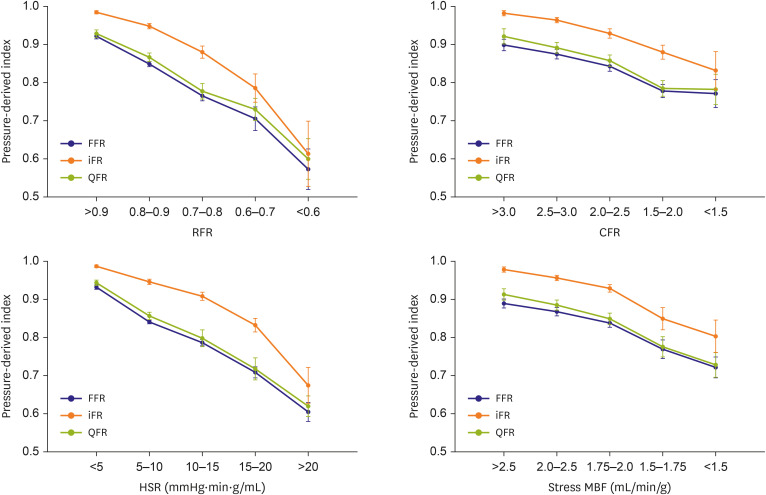
Methods: From 109 patients with 185 vessels who underwent both 13N-ammonia PET and invasive physiological measurement, we compared QFR, fractional flow reserve (FFR) and instantaneous wave-free ratio (iFR) for the responses to the different degree of anatomical (percent diameter stenosis [%DS]) and hemodynamic (relative flow reserve [RFR], coronary flow reserve, hyperemic stenosis resistance, and stress myocardial flow) stenosis severity and diagnostic performance against PET-derived parameters.
Results: QFR, FFR, and iFR showed similar responses to both anatomic and hemodynamic stenosis severity. Regarding RFR, the diagnostic accuracy of QFR was lower than FFR (76.2% vs. 83.2%, p=0.021) and iFR (76.2% vs. 84.3%, p=0.031). For coronary flow capacity (CFC), QFR showed a lower accuracy than iFR (74.1% vs. 82%, p=0.031) and lower discriminant function than FFR (area under curve: 0.74 vs. 0.79, p=0.044). Discordance between QFR and FFR or iFR was shown in 14.6% of cases and was driven by the difference in %DS and heterogeneous distribution of PET-derived RFR and stress myocardial blood flow.
Conclusions: QFR demonstrated a similar response to different anatomic and hemodynamic stenosis severity as FFR or iFR. However, its diagnostic performance was inferior to FFR and iFR when PET-derived RFR and CFC were used as a reference.
Keywords: Coronary artery disease; Myocardial ischemia; Positron emission tomography.
Copyright © 2021. The Korean Society of Cardiology.
Conflict of interest statement
Dr. Joo Myung Lee received a Research Grant from St. Jude Medical (Abbott Vascular) and Philips Volcano. Dr. Bon-Kwon Koo received an Institutional Research Grant from St. Jude Medical (Abbott Vascular) and Philips Volcano. All other authors declare that there is no conflict of interest relevant to the submitted work.
Figures


Similar articles
-
Diagnostic Agreement of Quantitative Flow Ratio With Fractional Flow Reserve and Instantaneous Wave-Free Ratio.J Am Heart Assoc. 2019 Apr 16;8(8):e011605. doi: 10.1161/JAHA.118.011605. J Am Heart Assoc. 2019. PMID: 30977410 Free PMC article.
-
Diagnostic Performance of Resting and Hyperemic Invasive Physiological Indices to Define Myocardial Ischemia: Validation With 13N-Ammonia Positron Emission Tomography.JACC Cardiovasc Interv. 2017 Apr 24;10(8):751-760. doi: 10.1016/j.jcin.2016.12.015. Epub 2017 Mar 29. JACC Cardiovasc Interv. 2017. PMID: 28365268
-
Similarity and Difference of Resting Distal to Aortic Coronary Pressure and Instantaneous Wave-Free Ratio.J Am Coll Cardiol. 2017 Oct 24;70(17):2114-2123. doi: 10.1016/j.jacc.2017.09.007. J Am Coll Cardiol. 2017. PMID: 29050558
-
Instantaneous wave-free ratio as an alternative to fractional flow reserve in assessment of moderate coronary stenoses: A meta-analysis of diagnostic accuracy studies.Cardiovasc Revasc Med. 2018 Jul-Aug;19(5 Pt B):613-620. doi: 10.1016/j.carrev.2017.12.014. Epub 2017 Dec 27. Cardiovasc Revasc Med. 2018. PMID: 29371084 Review.
-
Diagnostic Performance of the Instantaneous Wave-Free Ratio: Comparison With Fractional Flow Reserve.Circ Cardiovasc Interv. 2018 Jan;11(1):e004613. doi: 10.1161/CIRCINTERVENTIONS.116.004613. Circ Cardiovasc Interv. 2018. PMID: 29326150
Cited by
-
Practical Application of Coronary Physiologic Assessment: Asia-Pacific Expert Consensus Document: Part 1.JACC Asia. 2023 Aug 29;3(5):689-706. doi: 10.1016/j.jacasi.2023.07.003. eCollection 2023 Oct. JACC Asia. 2023. PMID: 38095005 Free PMC article. Review.
-
Practical Approach for Angina and Non-Obstructive Coronary Arteries: A State-of-the-Art Review.Korean Circ J. 2023 Aug;53(8):519-534. doi: 10.4070/kcj.2023.0109. Epub 2023 Jun 19. Korean Circ J. 2023. PMID: 37525496 Free PMC article. Review.
-
Quantitative flow ratio derived pullback pressure gradient and CZT-SPECT measured longitudinal flow gradient for hemodynamically significant coronary artery disease.J Nucl Cardiol. 2023 Oct;30(5):1992-2002. doi: 10.1007/s12350-023-03245-z. Epub 2023 Mar 16. J Nucl Cardiol. 2023. PMID: 36929292
-
Would a Noninvasive Coronary Physiology Become a Standard and Popular Approach?Korean Circ J. 2021 Feb;51(2):140-142. doi: 10.4070/kcj.2020.0511. Korean Circ J. 2021. PMID: 33525068 Free PMC article. No abstract available.
-
Functional Assessment of Coronary Artery Disease by Myocardial Flow Reserve Versus Pressure-wire Based Assessment: A Systematic Review.Ann Nucl Cardiol. 2021;7(1):57-62. doi: 10.17996/anc.21-00144. Epub 2021 Aug 31. Ann Nucl Cardiol. 2021. PMID: 36994131 Free PMC article. Review.
References
-
- Neumann FJ, Sousa-Uva M, Ahlsson A, et al. 2018 ESC/EACTS Guidelines on myocardial revascularization. Eur Heart J. 2019;40:87–165. - PubMed
-
- Dehmer GJ, Weaver D, Roe MT, et al. A contemporary view of diagnostic cardiac catheterization and percutaneous coronary intervention in the United States: a report from the CathPCI Registry of the National Cardiovascular Data Registry, 2010 through June 2011. J Am Coll Cardiol. 2012;60:2017–2031. - PubMed
-
- Toth GG, Toth B, Johnson NP, et al. Revascularization decisions in patients with stable angina and intermediate lesions: results of the international survey on interventional strategy. Circ Cardiovasc Interv. 2014;7:751–759. - PubMed
-
- Tu S, Barbato E, Köszegi Z, et al. Fractional flow reserve calculation from 3-dimensional quantitative coronary angiography and TIMI frame count: a fast computer model to quantify the functional significance of moderately obstructed coronary arteries. JACC Cardiovasc Interv. 2014;7:768–777. - PubMed
-
- Tu S, Westra J, Yang J, et al. Diagnostic accuracy of fast computational approaches to derive fractional flow reserve from diagnostic coronary angiography: the international multicenter FAVOR pilot study. JACC Cardiovasc Interv. 2016;9:2024–2035. - PubMed
Grants and funding
LinkOut - more resources
Full Text Sources
Other Literature Sources