. 2021 Jan 28;26(3):672.
doi: 10.3390/molecules26030672.

PROTACs and Building Blocks: The 2D Chemical Space in Very Early Drug Discovery

Affiliations

PROTACs and Building Blocks: The 2D Chemical Space in Very Early Drug Discovery

Giuseppe Ermondi et al. Molecules. .

Abstract

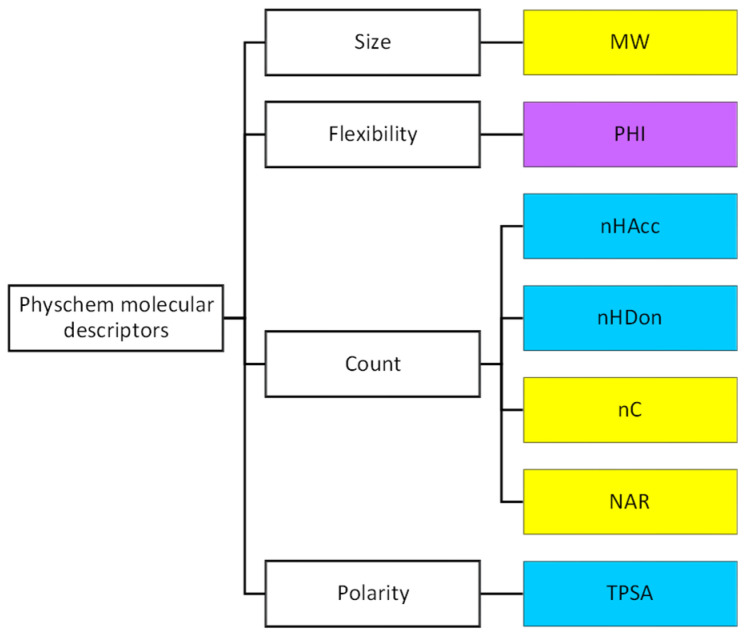
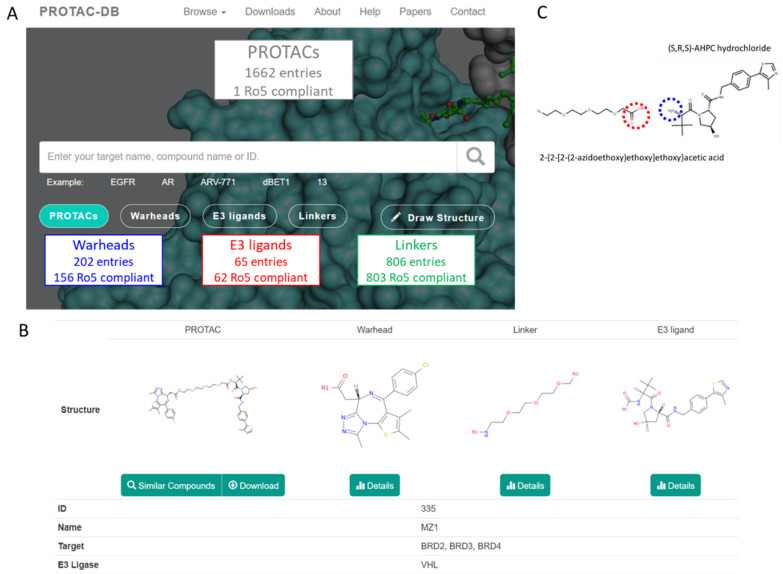
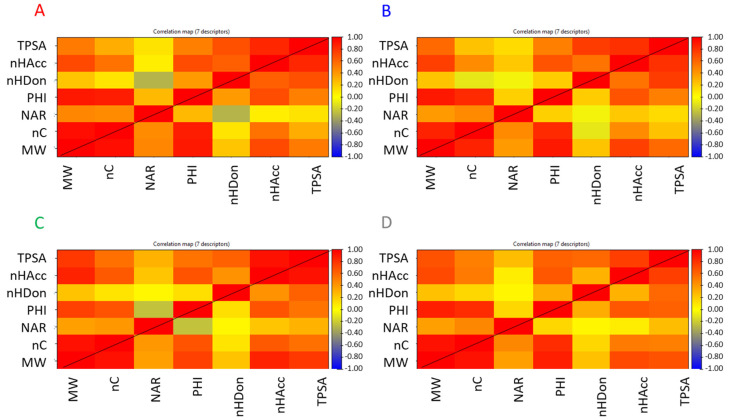
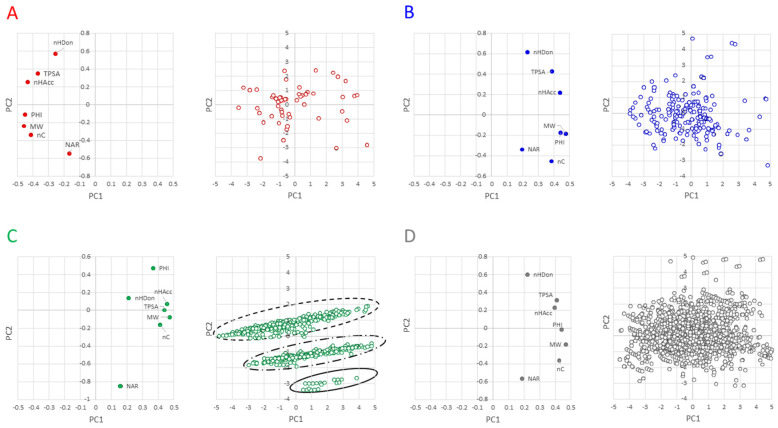
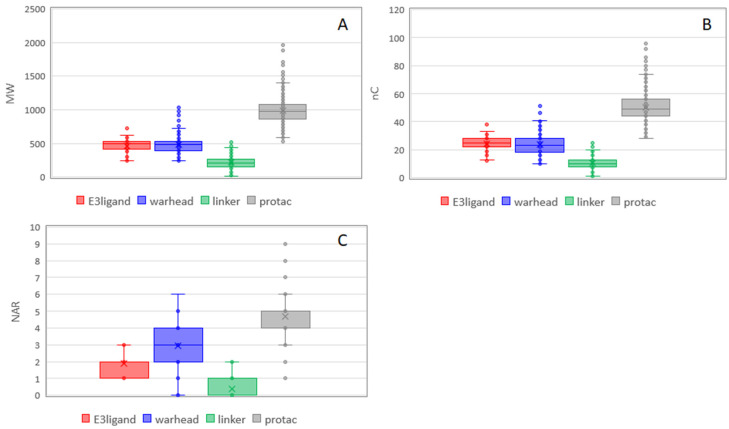
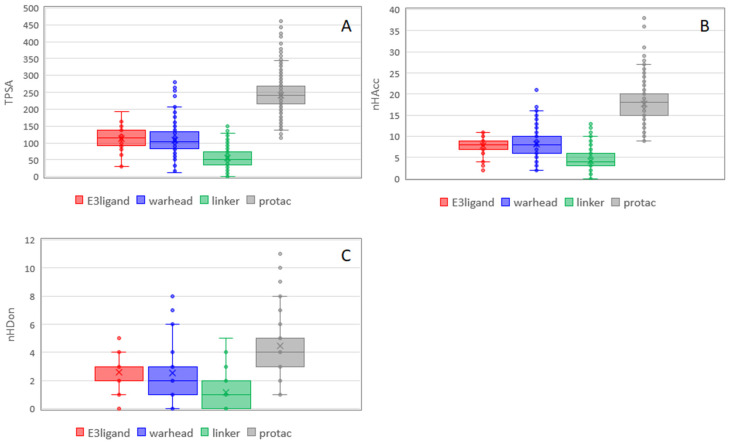
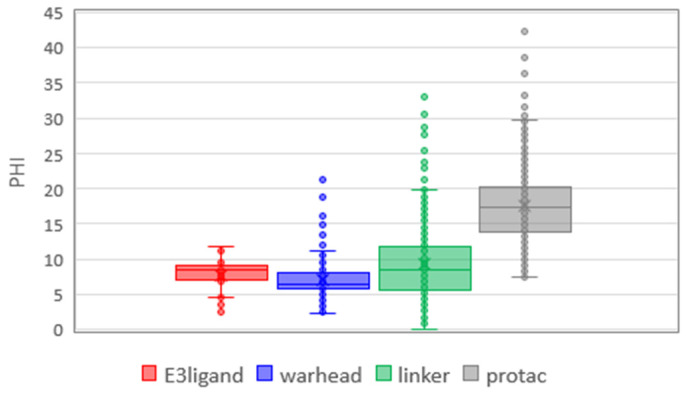
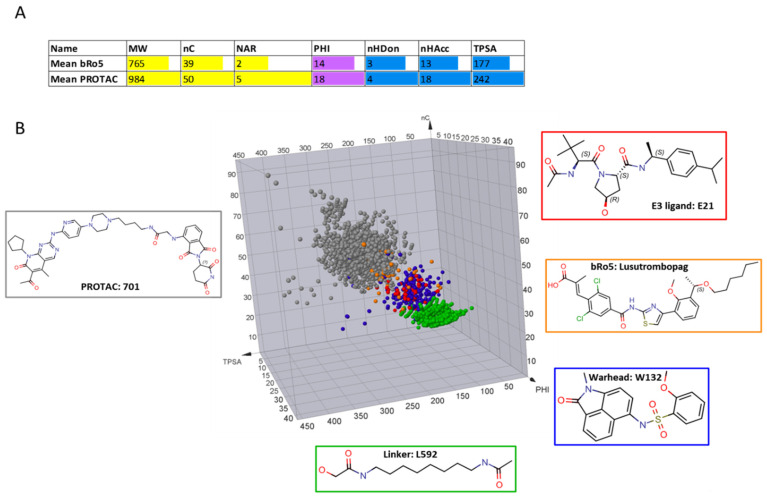
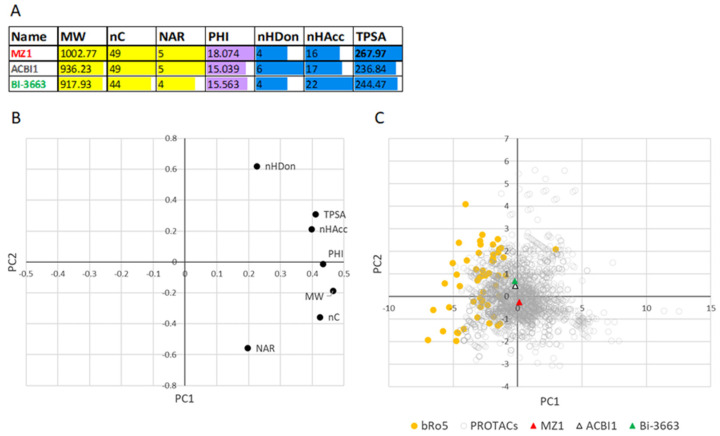
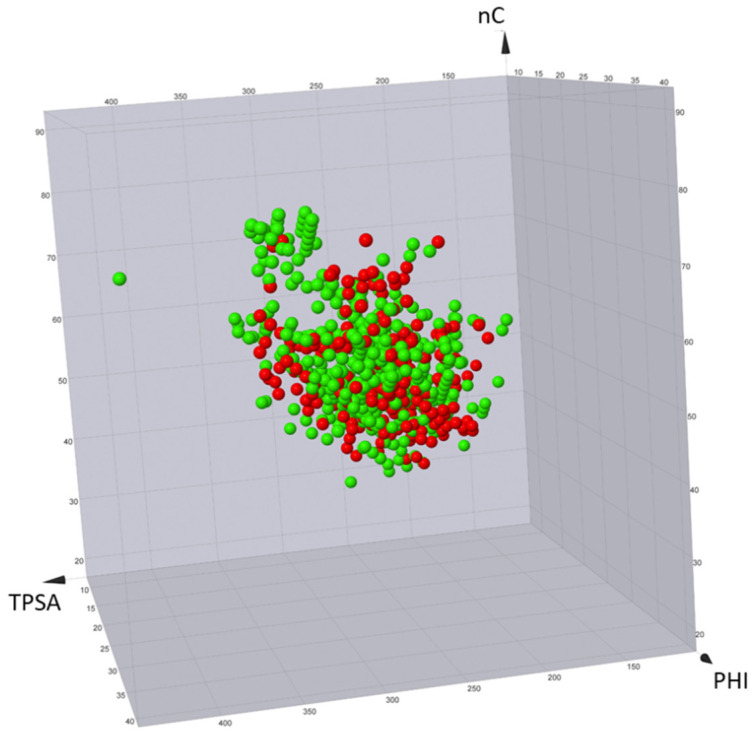
Targeted protein degradation by PROTACs has emerged as a new modality for the knockdown of a range of proteins, and, more recently, it has become increasingly clear that the PROTAC chemical space requires characterization through a pool of ad hoc physicochemical descriptors. In this study, a new database named PROTAC-DB that provides extensive information about PROTACs and building blocks was used to obtain the 2D chemical structures of about 1600 PROTACs, 60 E3 ligands, 800 linkers, and 202 warheads. For every structure, we calculated a pool of seven 2D descriptors carefully identified as informative for large and flexible structures. For comparison purposes, the same procedure was applied to a dataset of about 50 bRo5 approved drugs reported in the literature. Correlation matrices, PCAs, box plots, and other graphical tools were used to define and understand the chemical space covered by PROTACs and building blocks in relation to other compounds. Results show that linkers have different properties than E3 ligands and warheads. Polar descriptors additivity is not respected when passing from building blocks to degraders. Moreover, a very preliminary analysis based on three PROTACs with high, intermediate, and low permeability showed how the most permeable compounds seem to occupy a region closer to bRo5 drugs and, thus, exhibit different properties than impermeable compounds. Finally, a second database, PROTACpedia, was used to discuss the relevance of physicochemical descriptors on degradation activity.

Keywords: 2D physicochemical descriptors; PROTAC; chemical space; degrader; permeability.


Conflict of interest statement

The authors declare no conflict of interest. The funders had no role in the design of the study; in the collection, analyses, or interpretation of data; in the writing of the manuscript, or in the decision to publish the results.

Figures

Figure 1
Figure 1
Physicochemical descriptor classification.
Figure 2
Figure 2
Molecular descriptors used in this study (yellow: descriptors related to hydrophobicity, light blue: descriptors related to polarity, violet: flexibility descriptors).
Figure 3
Figure 3
PROTAC-DB. (A) An overview of the included compounds, (B) the result of a Search procedure using MZ1 as an input, and (C) two building blocks effectively used to synthetically access the linker-E3 ligase substructure of MZ1 (see text for more details).
Figure 4
Figure 4
Correlation matrices. (A) E3 ligands, (B) warhead, (C) linkers, and (D) PROTACs. Pearson’s correlation coefficients and corresponding p-values are reported in Tables S10–S13.
Figure 5
Figure 5
PCA. (A) E3 ligands (PC1 = 59.1%, PC2 = 25.0%), (B) warhead (PC1 = 56.9%, PC2 = 24.2%), (C) linkers (PC1 = 59.9%, PC2 = 17.4%) and (D) PROTACs (PC1 = 59.7%, PC2 = 17.4).
Figure 6
Figure 6
Box plots of the nonpolar descriptors for PROTACs and their building blocks. (A) MW, (B) nC, and (C) NAR. Statistical analysis was performed using ANOVA and p-values are reported in Figure S3.
Figure 7
Figure 7
Box plot of the polar descriptors for PROTACs and their building blocks. (A) TPSA, (B) nHAcc, and (C) nHDon. Statistical analysis of data was performed with ANOVA. p-values are reported in Figure S4.
Figure 8
Figure 8
Box plot of the Kier’s flexibility index (PHI). Statistical analysis of data was performed with ANOVA. p-values are reported in Figure S5.
Figure 9
Figure 9
PROTACs vs bRo5, data taken from [13]. (A) Mean value of the calculated descriptors; (B) 3D plot: nC, TPSA, and PHI were selected as descriptors of the nonpolar, polar, and flexible components, respectively, of the molecular structures. The chosen colors were the following: PROTACs = grey, bRo5 = orange, linkers = green, E3 ligands = red, and warheads = blue. A representative structure for each class is shown for comparison.
Figure 10
Figure 10
(A) Mean descriptor values for three PROTAC with low (MZ1), average (ACBI1), and high (BI-3663) Caco-2 log Papp [20] (chemical structures in Figure S2); (B) loading plot, and (C) score plot. Color code: PROTACs = grey, bRo5 = orange, MZ1 = red, ACBI1 = white and BI-3663 in green.
Figure 11
Figure 11
3D plot of active (green) vs. inactive (red) PROTACs obtained from PROTACpedia. nC, TPSA, and PHI were selected as descriptors of the nonpolar, polar, and flexible components, respectively, of the molecular structures.

References

    1. Dang C.V., Reddy E.P., Shokat K.M., Soucek L. Drugging the “undruggable” cancer targets. Nat. Rev. Cancer. 2017;17:502–508. doi: 10.1038/nrc.2017.36. - DOI - PMC - PubMed
    1. Ding Y., Fei Y., Lu B. Emerging New Concepts of Degrader Technologies. Trends Pharmacol. Sci. 2020;41:464–474. doi: 10.1016/j.tips.2020.04.005. - DOI - PMC - PubMed
    1. Knott G.J., Doudna J.A. CRISPR-Cas guides the future of genetic engineering. Science. 2018;361:866–869. doi: 10.1126/science.aat5011. - DOI - PMC - PubMed
    1. Li X., Song Y. Proteolysis-targeting chimera (PROTAC) for targeted protein degradation and cancer therapy. J. Hematol. Oncol. 2020;13:50. doi: 10.1186/s13045-020-00885-3. - DOI - PMC - PubMed
    1. Pettersson M., Crews C.M. PROteolysis TArgeting Chimeras (PROTACs)—Past, present and future. Drug Discov. Today Technol. 2019;31:15–27. doi: 10.1016/j.ddtec.2019.01.002. - DOI - PMC - PubMed

MeSH terms

LinkOut - more resources