. 2021 Jan 28;10(2):253.
doi: 10.3390/cells10020253.

Extrinsic Regulators of mRNA Translation in Developing Brain: Story of WNTs

Affiliations

Extrinsic Regulators of mRNA Translation in Developing Brain: Story of WNTs

Yongkyu Park et al. Cells. .

Abstract

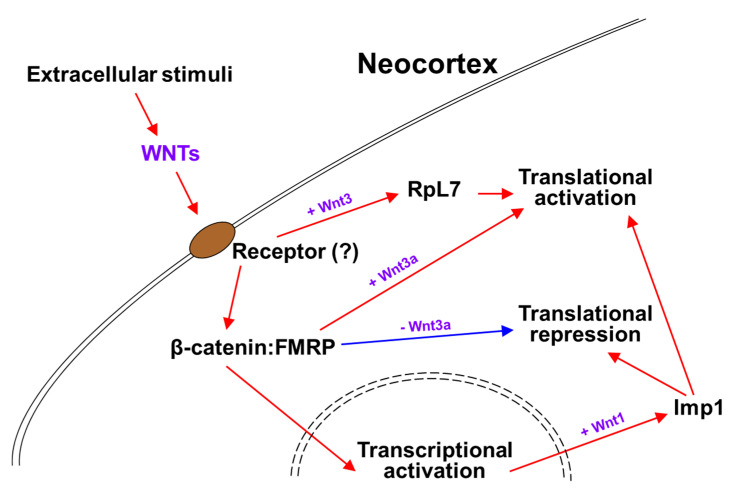
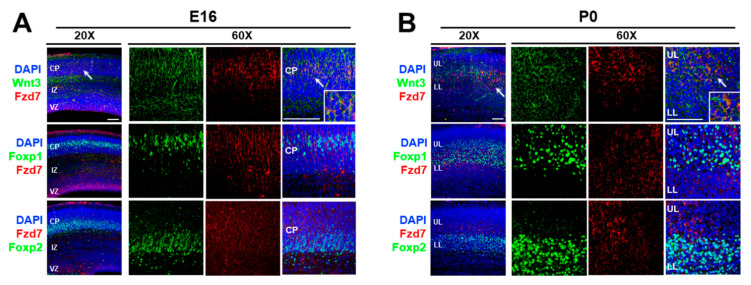
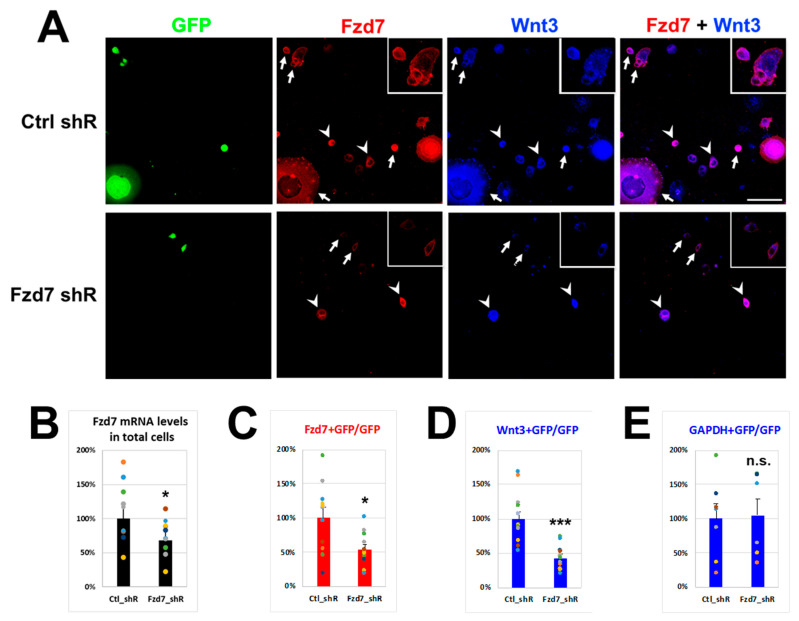
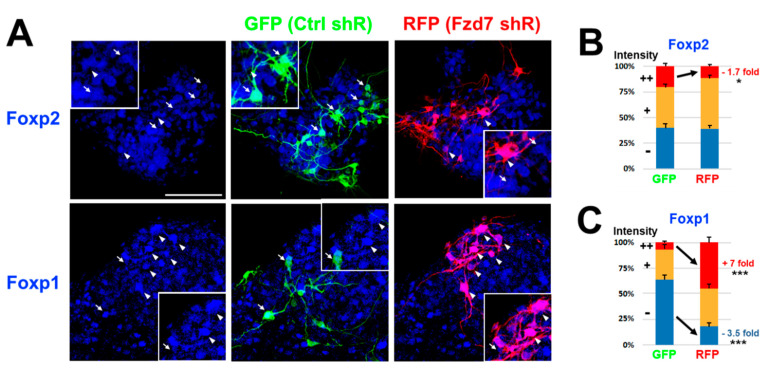
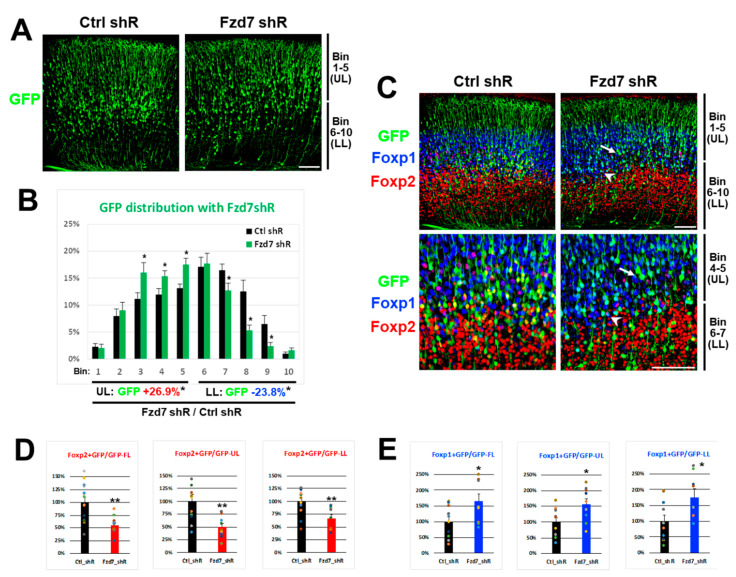
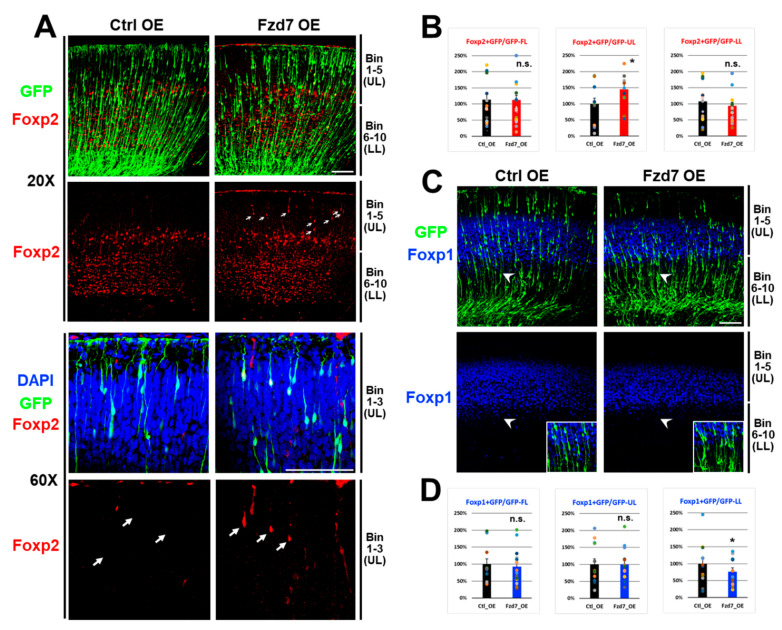
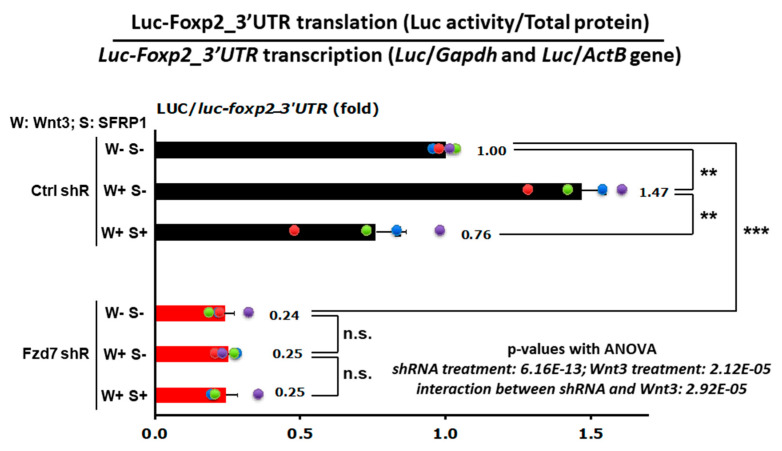
Extrinsic molecules such as morphogens can regulate timed mRNA translation events in developing neurons. In particular, Wingless-type MMTV integration site family, member 3 (Wnt3), was shown to regulate the translation of Foxp2 mRNA encoding a Forkhead transcription factor P2 in the neocortex. However, the Wnt receptor that possibly mediates these translation events remains unknown. Here, we report Frizzled member 7 (Fzd7) as the Wnt3 receptor that lays downstream in Wnt3-regulated mRNA translation. Fzd7 proteins co-localize with Wnt3 ligands in developing neocortices. In addition, the Fzd7 proteins overlap in layer-specific neuronal subpopulations expressing different transcription factors, Foxp1 and Foxp2. When Fzd7 was silenced, we found decreased Foxp2 protein expression and increased Foxp1 protein expression, respectively. The Fzd7 silencing also disrupted the migration of neocortical glutamatergic neurons. In contrast, Fzd7 overexpression reversed the pattern of migratory defects and Foxp protein expression that we found in the Fzd7 silencing. We further discovered that Fzd7 is required for Wnt3-induced Foxp2 mRNA translation. Surprisingly, we also determined that the Fzd7 suppression of Foxp1 protein expression is not Wnt3 dependent. In conclusion, it is exhibited that the interaction between Wnt3 and Fzd7 regulates neuronal identity and the Fzd7 receptor functions as a downstream factor in ligand Wnt3 signaling for mRNA translation. In particular, the Wnt3-Fzd7 signaling axis determines the deep layer Foxp2-expressing neurons of developing neocortices. Our findings also suggest that Fzd7 controls the balance of the expression for Foxp transcription factors in developing neocortical neurons. These discoveries are presented in our manuscript within a larger framework of this review on the role of extrinsic factors in regulating mRNA translation.

Keywords: Foxp transcription factor; Fzd7 receptor; ligand Wnt3 signaling; mRNA translation regulation; morphogen factor; neocortical development.


Conflict of interest statement

The authors declare no competing interest.

Figures

Figure 1
Figure 1
mRNA translations regulated by WNTs signaling. (1) Wnt3, secreted from thalamocortical axons, increases Rpl7 ribosomal protein within polysomes and promotes Foxp2 mRNA translation in the neocortex [48]. (2) Wnt3a stimulation induces the translational activation of mRNAs by sequestering β-catenin away (red arrow) from the β-catenin and FMRP complex that sustains the translational repression state (blue arrow) [97]. (3) Wnt1 signaling enhances RBP Imp1 expression during cortical development, which both translationally silences proneurogenic mRNAs and increases expression of pro-self-renewal mRNAs, to maintain NSCs in an undifferentiated state [98].
Figure 2
Figure 2
Colocalization of Wnt3 and Fzd7 with Foxp1 and Foxp2 expression at E16 and P0. (A,B). Immunohistochemistry (IHC) for Wnt3 (green), Fzd7 (red), Foxp1 (green), and Foxp2 (green) in WT E16 (A) and P0 (B) neocortices (n = 5 animals per age). Arrow denotes colocalized area between Wnt3 and Fzd7 in confocal microscope image using 20× objective lens, which was confirmed with 60× resolution (insert: higher magnification image of colocalization). DAPI shown in blue; CP: cortical plate; IZ: intermediate zone; VZ: ventricular zone; UL: upper layers; LL: lower layers; scale bar: 100 μm.
Figure 3
Figure 3
Interaction between Wnt3 and Fzd7 in neuroblastoma N2a cells. (A). IHC for GFP (green), Fzd7 (red), and Wnt3 (blue) in N2a cells after 3 days of each shRNA transfection containing GFP marker (Ctrl or Fzd7 shRNA) and following 4 h of Wnt3 (100 ng/mL) treatment (n = 3 separate transfections). Arrow: shRNA-transfected GFP cells (insert: higher magnification image); arrowhead: non-transfected cells; scale bar: 100 μm. (B). Fzd7 mRNA expression levels in total N2a cells determined by qRT-PCR (n = 10 repeats) when IHC was performed in A. Data of Fzd7 shRNA were normalized to Gapdh and then to Ctrl shRNA (100%). (CE). Quantification of Fzd7 (C), Wnt3 (D), Gapdh (E)-positive cells among total GFP cells (251–356 counted), normalized to the Ctrl shRNA (n = 6–12 repeats). Data represent the mean and SEM. Statistics: Student’s t-test; *: p < 0.05; ***: p < 0.005; n.s.: not significant.
Figure 4
Figure 4
Foxp2 downregulation and Foxp1 upregulation with Fzd7 shRNA in primary neuronal cells. (A). IHC for GFP (Ctrl shRNA cells: green) and RFP (Fzd7 shRNA cells: red) with Foxp2 or Foxp1 immunostaining (blue) after four days in vitro (DIV) culture of primary neuronal cells in utero electroporated (IUE) at E13 (n = 3 animals of each GFP and RFP). GFP (arrow) and RFP (arrowhead) cells showing strong (++) intensity of Foxp2 (lower panel: Foxp1) protein are respectively represented. Insert: higher magnification images of same area; scale bar: 100 μm. (B,C). Quantification of Foxp2 (B) or Foxp1 (C) signal with −, +, and ++ intensities which were compared/normalized to the intensity (+) observed in non-transfected cell as an intrinsic control of immunostaining quality (n = 28–48 pictures counted with total 403–700 cells). Data (%) represent the mean and SEM of each intensity (total sum = 100%). Statistics: Student’s t-test; *: p < 0.05; ***: p < 0.005.
Figure 5
Figure 5
Foxp2 downregulation in UL and Foxp1 upregulation in LL with Fzd7 shRNA at P0 (E13–P0). (A). IHC for GFP cells (green) in P0 neocortices electroporated in utero with Ctrl or Fzd7 shRNA at E13 (n = 3 animals). Bin 1–5: upper layers (UL); Bin 6–10: lower layers (LL); scale bar: 100 μm. (B). Percentage (%) of GFP+ cells in each bin from total 10 bins (n = 13–15 pictures counted with total 1965–2500 GFP cells). GFP+ cells in the upper layers (Bin 1–5) of Fzd7 shRNA neocortices increased up to 26.9% compared to Ctrl shRNA, while decrease of 23.8% was shown in the lower layers (Bin 6–10). *: p < 0.05. (C). IHC for GFP (green), Foxp1 (blue), and Foxp2 (red) in P0 neocortices. Arrow and arrowhead: the areas showing bigger change in Foxp2 and Foxp1 expression, respectively, which are shown with higher magnification images in the lower panel. (D,E). Quantification of Foxp2 (D) and Foxp1 (E)-positive cells (n = 8–14 pictures counted with total 1752–2358 GFP cells), normalized to the Ctrl shRNA (100%). Data represent the mean and SEM. FL; full layers (Bin 1–10); statistics: Student’s t-test; *: p < 0.05; **: p < 0.01.
Figure 6
Figure 6
Foxp2 upregulation in UL and Foxp1 downregulation in LL with Fzd7 OE at P0 (E16–P0). (A,C). IHC for GFP cells (green) with Foxp2 (red in A) or Foxp1 (blue in C) immunostaining in P0 neocortices electroporated in utero with Ctrl or Fzd7 OE plasmid at E16 (n = 3 animals). Arrow in A: Foxp2 protein expressed in upper layer bins 1–3 with the Fzd7 overexpression; arrowhead area in C: Foxp1 expression reduced in lower layer bins 6–7 with the Fzd7 overexpression, which are shown with higher magnification images in the insert. DAPI shown in blue (A); Bin 1–5: upper layers (UL); Bin 6–10: lower layers (LL); scale bar: 100 μm. (B,D). Quantification of Foxp2- (B) or Foxp1- (D) positive cells (n = 10–20 pictures counted with total 1711–3358 GFP cells), normalized to the Ctrl shRNA (100%). Data represent the mean and SEM. FL; full layers (Bin 1–10); statistics: Student’s t-test; *: p < 0.05; n.s.: not significant.
Figure 7
Figure 7
Translational reduction through Foxp2–3′UTR with Fzd7 shRNA. Quantification of translational effects (protein/mRNA ratio) was carried out using Luciferase-Foxp2_3′UTR construct in neuronal N2a cells, transfected with the Ctrl or Fzd7 shRNA plasmid and treated with mock (W–S–), Wnt3 (100 ng/mL) (W+S–), or Wnt3 + SFRP1 (100 ng/mL) (W+S+) for 48 h (n = 4 repeats). Translation was measured with Relative Luciferase light units (RLUs), and was then normalized to the Luciferase mRNA level (qRT-PCR). Data represent the mean and SEM. Statistics: Student’s t-test; **: p < 0.01; ***: p < 0.005; n.s.: not significant. Two-way ANOVA analysis with replication represents that the Fzd7 shRNA and Wnt3 treatments are significant and that the effects of them are dependent on each factor.

Similar articles

Cited by

References

    1. Rakic P. Evolution of the neocortex: A perspective from developmental biology. Nat. Rev. Neurosci. 2009;10:724–735. doi: 10.1038/nrn2719. - DOI - PMC - PubMed
    1. DeBoer E.M., Kraushar M.L., Hart R.P., Rasin M.R. Post-transcriptional regulatory elements and spatiotemporal specification of neocortical stem cells and projection neurons. Neuroscience. 2013;248:499–528. doi: 10.1016/j.neuroscience.2013.05.042. - DOI - PMC - PubMed
    1. Lui J.H., Hansen D.V., Kriegstein A.R. Development and evolution of the human neocortex. Cell. 2011;146:18–36. doi: 10.1016/j.cell.2011.06.030. - DOI - PMC - PubMed
    1. Popovitchenko T., Rasin M.R. Transcriptional and Post-Transcriptional Mechanisms of the Development of Neocortical Lamination. Front. Neuroanat. 2017;11:102. doi: 10.3389/fnana.2017.00102. - DOI - PMC - PubMed
    1. Kriegstein A., Alvarez-Buylla A. The glial nature of embryonic and adult neural stem cells. Annu. Rev. Neurosci. 2009;32:149–184. doi: 10.1146/annurev.neuro.051508.135600. - DOI - PMC - PubMed

Publication types

MeSH terms

LinkOut - more resources