. 2018 Apr 20;2(1):81-92.
doi: 10.1042/ETLS20170086.

Cryo-soft X-ray tomography: using soft X-rays to explore the ultrastructure of whole cells

Affiliations

Cryo-soft X-ray tomography: using soft X-rays to explore the ultrastructure of whole cells

Maria Harkiolaki et al. Emerg Top Life Sci. .

Abstract

Cryo-soft X-ray tomography is an imaging technique that addresses the need for mesoscale imaging of cellular ultrastructure of relatively thick samples without the need for staining or chemical modification. It allows the imaging of cellular ultrastructure to a resolution of 25-40 nm and can be used in correlation with other imaging modalities, such as electron tomography and fluorescence microscopy, to further enhance the information content derived from biological samples. An overview of the technique, discussion of sample suitability and information about sample preparation, data collection and data analysis is presented here. Recent developments and future outlook are also discussed.


Conflict of interest statement

The Authors declare that there are no competing interests with the manuscript.

Figures

Figure 1.
Figure 1.. Biological imaging in context.
Representative techniques developed for the investigation of structure in biological systems at different scales, in order of resolution attainable.
Figure 2.
Figure 2.. An example of typical cryo-SXT data.
(A) A cryo-STX projection image of a Toxoplasma gondii containing vacuole within a human fibroblast cell. The reconstructed volume (B) shows the parasitophorous vacuole in yellow containing four parasites (plasma membranes in cyan and rhoptries in green) with their respective nuclei in red. The bars are 2.5 µm. Data collected at B24. Image courtesy of Katja Ota and Hellen Saibil (Birkberk College London, U.K.).
Figure 3.
Figure 3.. A schematic of beamline B24 at the Diamond Light Source synchrotron.
X-rays are produced at a bending magnet, focused by a toroidal mirror and conditioned with a plane grating monochromator resulting in a secondary source at the exit slits. X-rays from his source are focused by capillary condenser lens and the resulting projections are directed via a zone plate objective to the detector.
Figure 4.
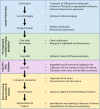
Figure 4.. Cryo-SXT workflow.
Figure 5.
Figure 5.. Typical cryo-STX imaging progression for adherent cells with fluorescence labels.
(A) Brightfield grid overview of cryo-preserved mouse primary neuronal cells on a TEM grid (bar = 500 µm), (B) close-up fluorescence and (C) brightfield images of the area on A marked by a blue square (bar = 50 µm), (D) X-ray mosaic of the area marked in C (bar = 10 µm), (E) single field or view X-ray projection and (F) slice through a cumulative tomogram, showing the nucleus (N) and surrounding vesicles in the cytoplasm (C) produced by stitching four tomograms collected in adjacent overlapping areas. Bars for E and F = 5 µm; black arrow with white outline points to lipid droplets, white arrows with black outline point to mitochondria; Data collected at B24. Image courtesy of Karen Marshall and Louise Serpell at Sussex University, U.K.
Figure 6.
Figure 6.. Typical cryo-STX imaging workflow for smaller samples (Trypanosome brucei) with no associated fluorescence.
(A) Brightfield overview of cryo-preserved cells on an area of holey carbon on a TEM grid (bar = 50 µm), (B) X-ray mosaic of the area on A marked by a green square (bar = 25 µm), (C) X-ray projection of the area on B marked by a blue square, (D) tomogram slice of the same area after reconstruction and (E) segmented volumes with delineated cellular ultrastructure (flagellum is green, cell body in blue and organelles in various other colours). Data collected at B24. Image reproduced from Luengo et al. [19].

References

    1. Diebolder C.A., Koster A.J. and Koning R.I. (2012) Pushing the resolution limits in cryo electron tomography of biological structures. J. Microsc. 248, 1–5 10.1111/j.1365-2818.2012.03627.x - DOI - PubMed
    1. Irobalieva R.N., Martins B. and Medalia O. (2016) Cellular structural biology as revealed by cryo-electron tomography. J. Cell Sci. 129, 469–476 10.1242/jcs.171967 - DOI - PubMed
    1. Pawley, J.B. (2006) Handbook of Biological Confocal Microscopy. Springer; 985 p
    1. Wessels J.T., Yamauchi K., Hoffman R.M. and Wouters F.S. (2010) Advances in cellular, subcellular, and nanoscale imaging in vitro and in vivo. Cytometry A 77, 667–676 10.1002/cyto.a.20931 - DOI - PubMed
    1. Ekman A.A., Chen J.-H., Guo J., McDermott G., Le Gros M.A. and Larabell C.A. (2017) Mesoscale imaging with cryo-light and X-rays: larger than molecular machines, smaller than a cell. Biol. Cell 109, 24–38 10.1111/boc.201600044 - DOI - PMC - PubMed

LinkOut - more resources