

tidyMicro: a pipeline for microbiome data analysis and visualization using the tidyverse in R
- PMID: 33526006
- PMCID: PMC7852128
- DOI: 10.1186/s12859-021-03967-2
tidyMicro: a pipeline for microbiome data analysis and visualization using the tidyverse in R
Abstract
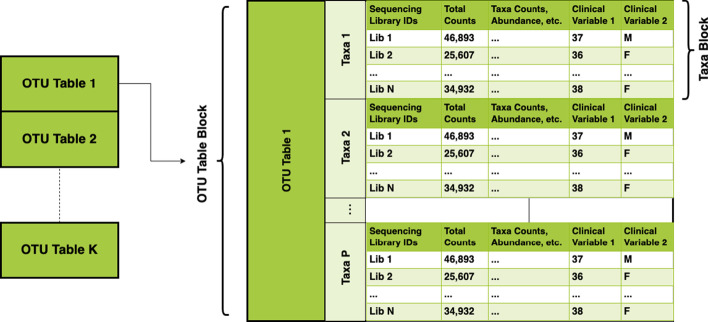
Background: The drive to understand how microbial communities interact with their environments has inspired innovations across many fields. The data generated from sequence-based analyses of microbial communities typically are of high dimensionality and can involve multiple data tables consisting of taxonomic or functional gene/pathway counts. Merging multiple high dimensional tables with study-related metadata can be challenging. Existing microbiome pipelines available in R have created their own data structures to manage this problem. However, these data structures may be unfamiliar to analysts new to microbiome data or R and do not allow for deviations from internal workflows. Existing analysis tools also focus primarily on community-level analyses and exploratory visualizations, as opposed to analyses of individual taxa.
Results: We developed the R package "tidyMicro" to serve as a more complete microbiome analysis pipeline. This open source software provides all of the essential tools available in other popular packages (e.g., management of sequence count tables, standard exploratory visualizations, and diversity inference tools) supplemented with multiple options for regression modelling (e.g., negative binomial, beta binomial, and/or rank based testing) and novel visualizations to improve interpretability (e.g., Rocky Mountain plots, longitudinal ordination plots). This comprehensive pipeline for microbiome analysis also maintains data structures familiar to R users to improve analysts' control over workflow. A complete vignette is provided to aid new users in analysis workflow.
Conclusions: tidyMicro provides a reliable alternative to popular microbiome analysis packages in R. We provide standard tools as well as novel extensions on standard analyses to improve interpretability results while maintaining object malleability to encourage open source collaboration. The simple examples and full workflow from the package are reproducible and applicable to external data sets.
Keywords: Microbiome; Open source; Pipeline; R; Tidyverse; Visualization.
Conflict of interest statement
The authors declare that they have no competing interests.
Figures


Similar articles
-
iMAP: an integrated bioinformatics and visualization pipeline for microbiome data analysis.BMC Bioinformatics. 2019 Jul 3;20(1):374. doi: 10.1186/s12859-019-2965-4. BMC Bioinformatics. 2019. PMID: 31269897 Free PMC article.
-
REPRODUCIBLE RESEARCH WORKFLOW IN R FOR THE ANALYSIS OF PERSONALIZED HUMAN MICROBIOME DATA.Pac Symp Biocomput. 2016;21:183-94. Pac Symp Biocomput. 2016. PMID: 26776185 Free PMC article.
-
Dynamic interaction network inference from longitudinal microbiome data.Microbiome. 2019 Apr 2;7(1):54. doi: 10.1186/s40168-019-0660-3. Microbiome. 2019. PMID: 30940197 Free PMC article.
-
Personalized microbiome dynamics - Cytometric fingerprints for routine diagnostics.Mol Aspects Med. 2018 Feb;59:123-134. doi: 10.1016/j.mam.2017.06.005. Epub 2017 Jul 8. Mol Aspects Med. 2018. PMID: 28669592 Review.
-
Successful strategies for human microbiome data generation, storage and analyses.J Biosci. 2019 Oct;44(5):111. J Biosci. 2019. PMID: 31719220 Review.
Cited by
-
Identification and characterization of MADS-box gene family in flax, Linum usitatissimum L. and its role under abiotic stress.iScience. 2024 Oct 1;27(12):111092. doi: 10.1016/j.isci.2024.111092. eCollection 2024 Dec 20. iScience. 2024. PMID: 39618497 Free PMC article.
-
Coix Seed Oil Alleviates DSS-Induced Ulcerative Colitis via Intestinal Barrier Repair and Ferroptosis Regulation.J Inflamm Res. 2025 Feb 20;18:2557-2581. doi: 10.2147/JIR.S501745. eCollection 2025. J Inflamm Res. 2025. PMID: 39995826 Free PMC article.
-
Identification and Characterization of WOX Gene Family in Flax (Linum usitatissimum L.) and Its Role Under Abiotic Stress.Int J Mol Sci. 2025 Apr 10;26(8):3571. doi: 10.3390/ijms26083571. Int J Mol Sci. 2025. PMID: 40332111 Free PMC article.
-
An exercise intervention alters stool microbiota and metabolites among older, sedentary adults.Ther Adv Infect Dis. 2021 Jun 25;8:20499361211027067. doi: 10.1177/20499361211027067. eCollection 2021 Jan-Dec. Ther Adv Infect Dis. 2021. PMID: 34262758 Free PMC article.
-
Exploring the Microbiome Analysis and Visualization Landscape.Front Bioinform. 2021 Dec 2;1:774631. doi: 10.3389/fbinf.2021.774631. eCollection 2021. Front Bioinform. 2021. PMID: 36303773 Free PMC article. Review.
References
-
- Harris JK, Wagner BD, Zemanick ET, Robertson CE, Stevens MJ, Heltshe SL, et al. Changes in airway microbiome and inflammation with ivacaftor treatment in patients with cystic fibrosis and the G551D mutation. Ann Am ThoracSoc. 2019;17(2):212–220. doi: 10.1513/AnnalsATS.201907-493OC. - DOI - PMC - PubMed
MeSH terms
Grants and funding
LinkOut - more resources
Full Text Sources
Other Literature Sources
