. 2021 Feb 1;19(1):18.
doi: 10.1186/s12915-021-00953-1.

Exacerbated age-related hearing loss in mice lacking the p43 mitochondrial T3 receptor

Affiliations

Exacerbated age-related hearing loss in mice lacking the p43 mitochondrial T3 receptor

Corentin Affortit et al. BMC Biol. .

Abstract

Background: Age-related hearing loss (ARHL), also known as presbycusis, is the most common sensory impairment seen in elderly people. However, the cochlear aging process does not affect people uniformly, suggesting that both genetic and environmental (e.g., noise, ototoxic drugs) factors and their interaction may influence the onset and severity of ARHL. Considering the potential links between thyroid hormone, mitochondrial activity, and hearing, here, we probed the role of p43, a N-terminally truncated and ligand-binding form of the nuclear receptor TRα1, in hearing function and in the maintenance of hearing during aging in p43-/- mice through complementary approaches, including in vivo electrophysiological recording, ultrastructural assessments, biochemistry, and molecular biology.

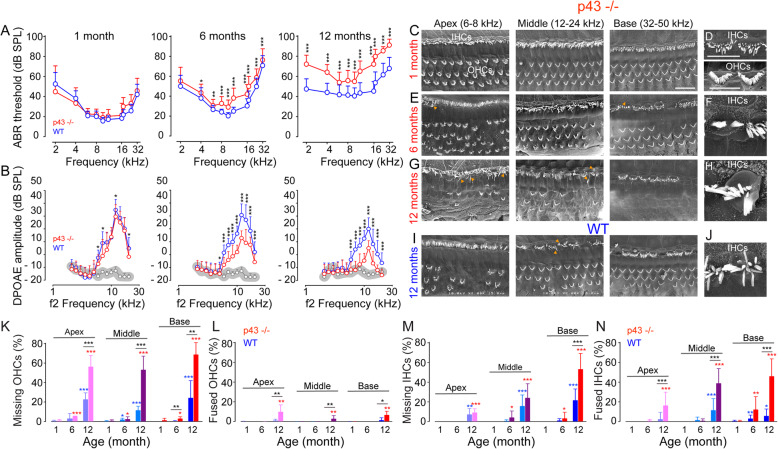
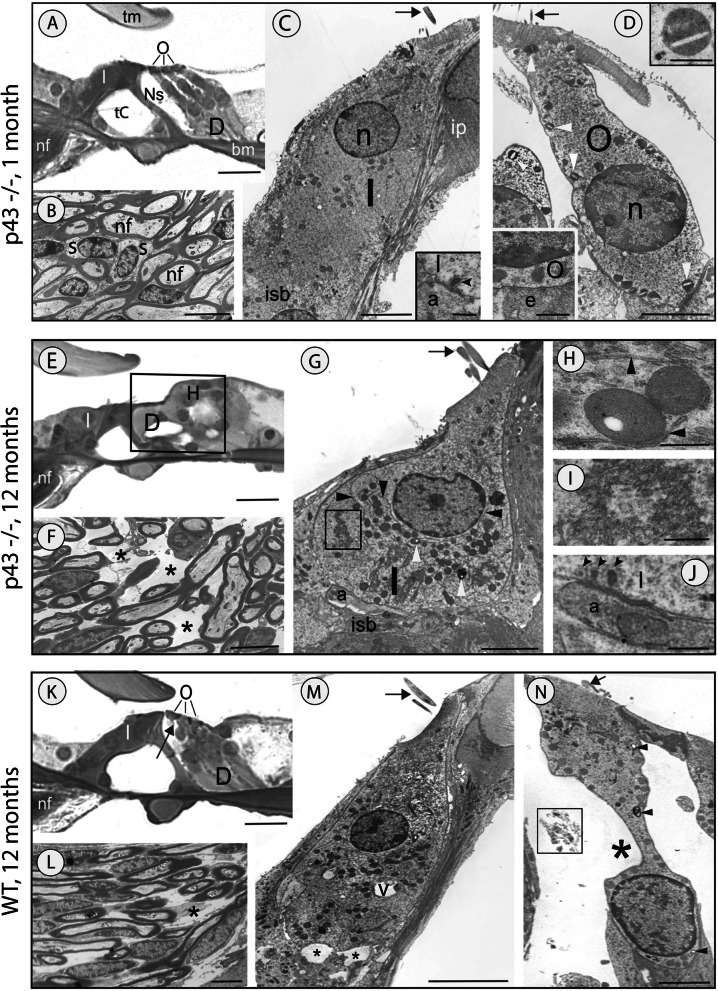
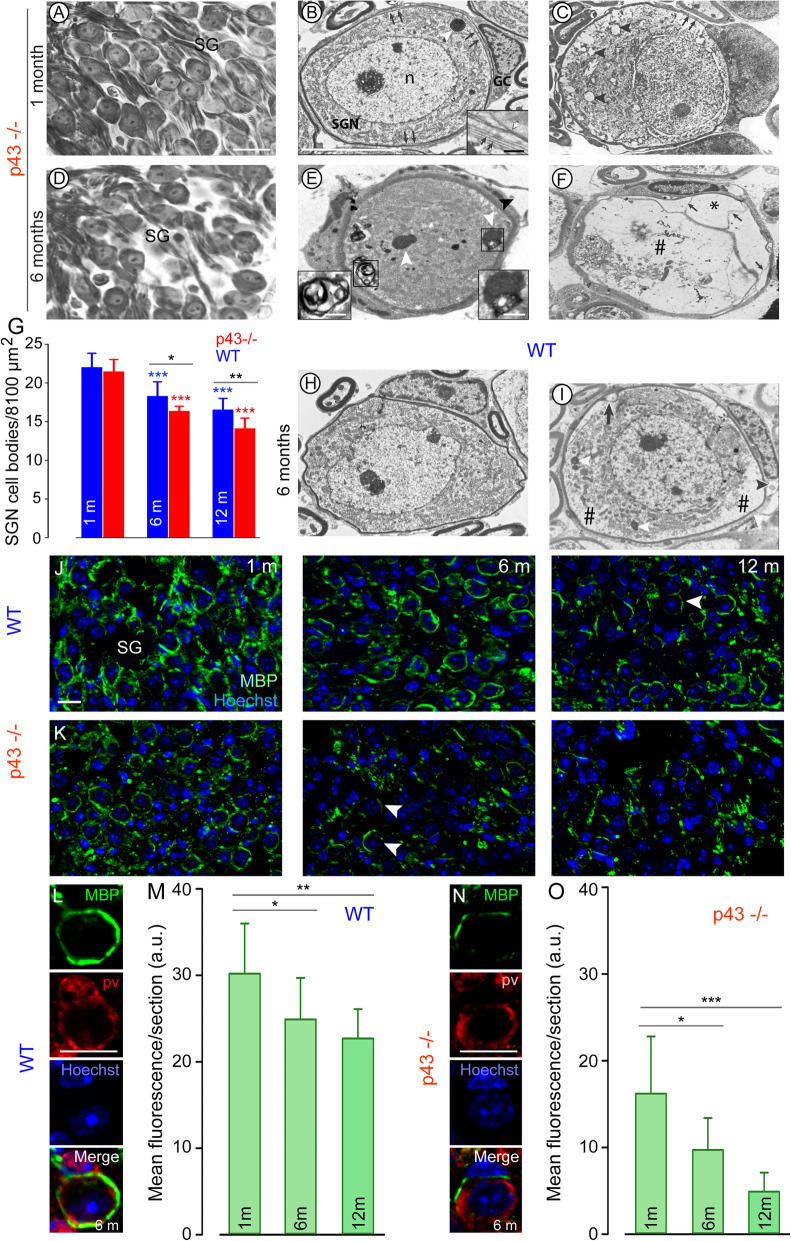
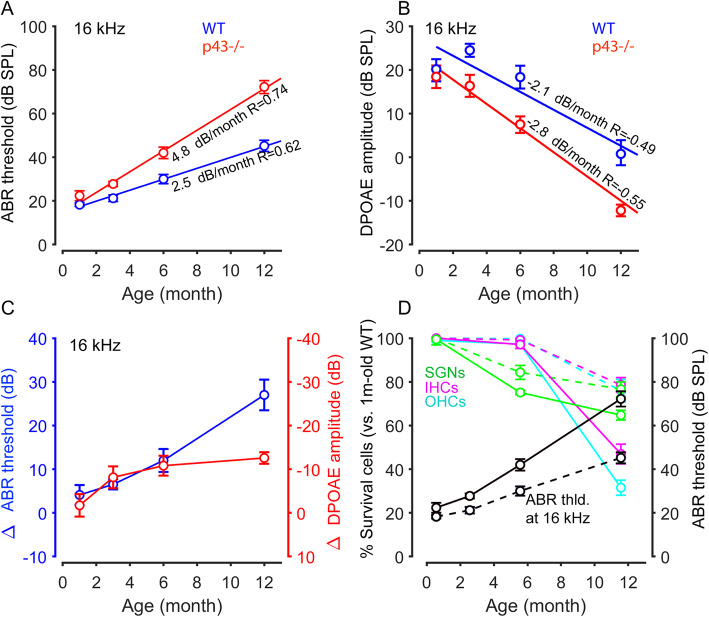
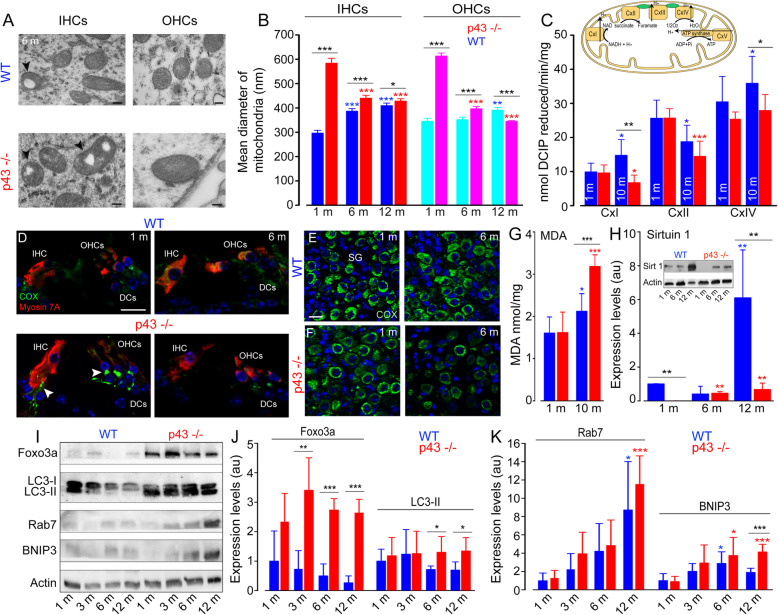
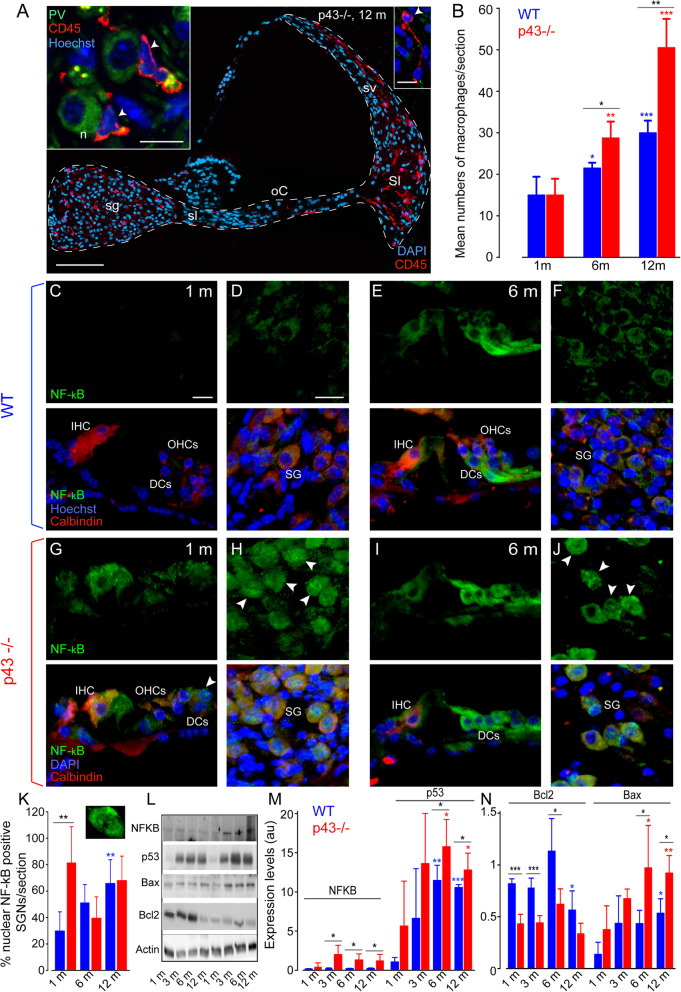
Results: We found that the p43-/- mice exhibit no obvious hearing loss in juvenile stages, but that these mice developed a premature, and more severe, ARHL resulting from the loss of cochlear sensory outer and inner hair cells and degeneration of spiral ganglion neurons. Exacerbated ARHL in p43-/- mice was associated with the early occurrence of a drastic fall of SIRT1 expression, together with an imbalance between pro-apoptotic Bax, p53 expression, and anti-apoptotic Bcl2 expression, as well as an increase in mitochondrial dysfunction, oxidative stress, and inflammatory process. Finally, p43-/- mice were also more vulnerable to noise-induced hearing loss.

Conclusions: These results demonstrate for the first time a requirement for p43 in the maintenance of hearing during aging and highlight the need to probe the potential link between human THRA gene polymorphisms and/or mutations and accelerated age-related deafness or some adult-onset syndromic deafness.

Keywords: Age-related hearing loss; Mitochondrial dysfunction; Thyroid hormones; p43 mitochondrial T3 receptor.


Conflict of interest statement

The authors declare having no competing interests.

Figures

Fig. 1
Fig. 1
Exacerbated age-related hearing and hair cell loss in p43−/− mice. a Age-related auditory brainstem response (ABR) thresholds. Note the high- to low-frequency gradient of the deterioration of ABR thresholds in both strains, but more prominent in p43−/− (red plot) than in WT (blue plot) mice. b Age-related distortion product otoacoustic emission (DPOAE) amplitudes. Note that the DPOAE amplitudes decrease with age in both strains, but more severe in p43−/− (red plot) than in WT (blue plot) mice. The gray dots and shaded area represent the background noise levels. Data are expressed as mean ± SD (1 month: n = 31; 6 months: n = 23; 12 months: n = 15 mice per strain). One-way ANOVA test followed by Dunn’s test (*P ≤ 0.05, **P ≤ 0.01, ***P ≤ 0.001, p43−/− vs. WT mice). c e, g, i Representative scanning electron microscopy (SEM) micrographs showing the apical, mid, and basal cochlear regions from p43−/− (e, e, and g) and WT (i) at 1 (c), 6 (e), and 12 (g and i) months of age. d, f, h, j Higher magnification of SEM images of representative OHC and IHC stereocilia from p43−/− (d, f, and h) and WT (j) at 1 (d), 6 (f), and 12 (h and j) months of age. Note the fused stereocilia of IHCs in f, h, and j. Scale bars: c, e, g, and i = 25 μm; d, f, h, and j = 10 μm. OHCs, outer hair cells; IHCs, inner hair cells; white star indicating OHC loss; yellow arrows pinpointing stereocilial fusion. kn Cytocochleograms representing the percentage of missing OHCs (k) and IHCs (m), and fused OHCs (l) and IHCs (n) in apical, mid, and basal regions from the cochleae of p43−/− (red bars) and WT (blue bars) aged 1, 6, and 12 months. Data are expressed as mean ± SD (n = 6 to 12 mice per age and strain). One-way ANOVA test was followed by Dunn’s test. *P ≤ 0.05, **P ≤ 0.01, ***P ≤ 0.001, p43−/− vs. WT mice of the same age. *P ≤ 0.05, **P ≤ 0.01, ***P ≤ 0.001, older p43−/− vs. 1-month-old p43−/−. *P ≤ 0.05, **P ≤ 0.01, ***P ≤ 0.001, older WT vs. 1-month-old WT
Fig. 2
Fig. 2
Ultrastructural changes in the organ of Corti. Representative light (A, B, E, F, K, L) and transmission electron (C, D, GJ, M, N) micrographs show the organ of Corti from p43−/− (AJ) and WT mice (KN). AD 1-month-old p43−/− mice. The organ of Corti shows adult-like structural characteristics with well-opened tunnel of Corti (tC) and spaces of Nuel (Ns) and normally shaped tectorial (tm) and basilar (bm) membranes (A). The 3 OHCs (O) above the Deiters cells (D), and the IHC (I) are present (A). Densely packed myelinated nerve fibers (nf) and schwann cells (s) are visible in the spiral lamina (B). The nucleus (n) of IHC is well positioned in the upper half of the cell body (C). The stereocilia (arrow) are erect. Beneath the basal pole of the IHC, the inner spiral bundle (isb) contains numerous nerve fibers. The inset in C shows a typical synaptic contact between the IHC and the extremity of a radial afferent fiber (a). Note the synaptic ribbon (arrowhead) within the IHC. ip, inner pillar cell. Note the apparently normal OHC with erect stereocilia (arrow) and basally located nucleus (D). Most of its mitochondria are damaged (white arrowheads and upper inset in D). Lower inset in D: a typical efferent synapse at the basal pole of a neighboring OHC (e: efferent ending). EJ 12 months of age p43−/− mice. Shown is an organ of Corti containing IHC, but lacking OHC (E). In the area of the missing OHCs (delineated by the black square), an epithelial scar is formed by Deiters (D) and Hensen (H) cells (E). In the osseous spiral lamina, empty spaces (asterisks) are visible in the bundle of nerve fibers (F). The IHC is deformed and contains damaged mitochondria (white arrowheads), an exuberant network of endoplasmic reticulum (black arrowheads) contacting the mitochondria, and large aggregates of membranous material resembling reticulum debris (within the black square, G). The inner spiral sulcus contains only few afferent (a) nerve fibers (G). HJ Enlargement of organelles seen in the IHC shown in G. H Two closely linked mitochondria with the absence of their cristae, and a portion of the lower mitochondrion is free of matrix. Note well-defined endoplasmic reticulum (arrowhead) in contact with the two mitochondria. I Accumulation of membranous material such as endoplasmic reticulum debris. J Immature-like afferent synapse at the basal pole of the IHC. Note the multiple synaptic ribbons (arrowheads) in the IHC and the elongated postsynaptic density in the afferent fiber. K–N: 12 months of age WT mice. K The organ of Corti contains the IHC and the OHCs, but the OHC from the first row is damaged (arrow). L Among the nerve fibers, some empty spaces (asterisk) are visible in the spiral lamina. M The IHC has a typical shape and erect stereocilia (arrow). Note the large autophagic vacuoles (v) within the cytoplasm of the cell and the swollen afferent dendrite extremities (asterisks) at its basal pole. N OHC from the first row, showing a distorted cell body (asterisk), bent and fused stereocilia (arrow) and some damaged mitochondria (arrowheads). Note the cell debris (in the black square) floating within the spaces of Nuel. A, E, K = 50 μm. C, G, M = 10 μm. B, D, F, L, N = 5 μm. H, J = 1 μm. I = 0,5 μmm. Inset C and lower inset D = 1 μm. Upper inset D = 0.5 μm. N = 4 cochleae per age and strain
Fig. 3
Fig. 3
Degeneration of the spiral ganglion neurons and their glial cells. Representative light (a, d), transmission electron (b, c, e, f, h, i) and confocal (j, k, l, n) micrographs showing the spiral ganglion neurons and their glial cells from p43−/− (af, k, n) and WT mice (h, i, j, l), quantitative analysis of SGN density (g) and semi-quantitative analysis of and MBP expression (m, o). ac 1 month of age p43−/− mice. a Micrograph showing a normal ganglion cell density. b The spiral ganglion neuron (SGN) have a healthy appearance. In the glial cells (GC), the myelin sheath is disorganized (arrows). Inset in b Disorganized myelin sheath (white arrow) with several layers of non-compacted myelin (black arrows). n, nucleus of the SGN. c The cytoplasm of the SGN shows numerous autophagic vesicles (arrowheads) and a ring of perinuclear edema. Arrows indicate disrupted myelin. df 6 months of age p43−/− mice. d A decrease in ganglion cell density is shown. e The SGN has condensed cytoplasm, a number of dark inclusions (white arrowheads) resembling lipofuscin aggregates and also a typical autophagy double-membrane vesicle (delineated by the black square). Note the detached myelin sheath from its cell body. Black arrowhead indicates a glial cell with large vacuoles in the cytoplasm. Right Inset shows a dark inclusion with a lipid droplet (delineated by the black square in e). Left Inset: shows an autophagy double-membrane vesicle. f The SGN cytoplasm shows large areas of autolysis (#). The glial cell still surrounds the remnants of the SGN but the myelin envelope is cleaved leading to large empty spaces between the myelin sheets (asterisk). Note the strands of isolated myelin sheets (arrows) and the autophagic vacuole in the glial cell. h, i 6 months of age WT mice. h A healthy appearing SGN surrounded by a normal looking glial cell with well compacted myelin sheath. I The cytoplasm of the SGN presents areas of autolysis (#) and dark inclusions (white arrowheads). The glial cell shows an autophagic vacuole (arrowhead). The myelin sheath is cleaved (arrow) in several segments. Scale bars: a, d = 20 μm, b, c, e, f, h, i = 10 μm. Insets in b, e = 0.5 μm. g Histogram representing the average SGN density in Rosenthal’s canal of the basal region from p43−/− (red bars) and WT (blue bars) aged 1, 6, and 12 months. Data are expressed as mean ± SD (n = five sections per cochlea, 7 to 9 cochleae per age and strain). One-way ANOVA test was followed by Dunn’s test (*P = 0.03, **P ≤ 0.01, p43−/− vs. WT of the same age; ***P ≤ 0.001, older p43−/− vs. 1-month-old p43−/−; ***P ≤ 0.001, older WT vs. 1-month-old WT). j, k, l, n Confocal images showing the basal region of spiral ganglion (SG) immunolabeled for parvalbumin (PV) to identify SGNs (red, not shown in j and k), and MBP (green) to highlight myelin sheaths, and counterstained with Hoechst (blue) to identify nuclei from WT (j, l), and p43−/− (k, n) aged 1, 6, and 12 months (left, middle and right columns respectively). Higher magnification images in l and n show representative intact (l) and partial loss of (n) MBP positive myelin sheaths enveloping the neurons from WT (l) and p43−/− (n) mice aged 6 months. Scale bars = 20 μm. m, o: Semi-quantitative analysis of the MBP immunofluorescence. Mean immunofluorescence of myelin per section as a function of age, for WT (m) and p43−/− (o). Data are expressed as mean ± SD (n = 3 sections per cochlea, 4 cochleae per age and strain). Wilcoxon test (*P ≤ 0.05, **P ≤ 0.01, ***P ≤ 0.001)
Fig. 4
Fig. 4
Age-related hearing impairments and morphological correlation. a, b Age-related elevation of mean ABR thresholds (a) and reduction of DPOAE amplitudes (b). Red and blue circles represent the values of mean ABR threshold at 16 kHz (in a) and the mean DPOAE amplitude at 16 kHz (in b) for each mouse and each time point. These values were then used to perform a linear regression, allowing the measurement of threshold elevation or amplitude reduction per month and the calculation of Pearson correlation coefficients. c Time course of ABR threshold increase and DPOAE amplitude decrease in the p43−/− mice. The left ordinate represents the mean difference (Δ) in ABR thresholds between p43−/− and WT mice. The right ordinate represents the mean difference (Δ) in DPOAE amplitudes between p43−/− and WT mice. The abscissa represents the time in months. The data were derived from a and b. d Elevation of ABR thresholds (black circles) at 16 kHz relating to the percentage of OHC (cyan circles), IHC (magenta circles), and SGN survival (green circles) in the cochlear basal region from p43−/− (solid line) and WT (dotted line) mice aged 1, 6, and 12 months. The left Y-axis represents the mean percentage of remaining OHCs, IHCs and SGNs related to 1-month-old WT mice. The right Y-axis represents the values of mean ABR threshold
Fig. 5
Fig. 5
Increase of mitochondrial size and dysfunction, oxidative stress and impaired SIRT1 expression and autophagic activities. a Representative transmission electron (TEM) micrographs showing the mitochondria located in the IHCs and OHCs from WT and p43−/− mice aged 6 months. Note the increase in the number of mitochondria with the lack of their cristae (arrowheads) and enlarged mitochondria in the hair cells of p43−/− mice. Scale bars = 0.5 μm. b The histogram represents the mean diameter of the mitochondria in the IHCs and OHCs from p43−/− (red bars) and WT (blue bars) mice obtained by TEM imaging measurements. Data are expressed as mean ± SD (n = ~ 45 to 50 mitochondria, taken randomly from the IHCs or OHCs, 4 cochleae per age and strain). One-way ANOVA was followed by Dunn’s test (*P = 0.014, ***P ≤ 0.001, p43−/− vs. WT of the same age; ***P ≤ 0.001, older p43−/− vs. 1-month-old p43−/−; **P ≤ 0.01, ***P ≤ 0.001, older WT vs. 1-month-old WT). Inset in c Schematic representation of the mitochondrial respiratory chain. Complex I (CxI, NADH dehydrogenase) is the entry point of electron transfer in the respiratory chain. The proton (H+) gradient generated at the level of complex I, III (CxIII, cytochrome-c reductase) and IV (CxIV, cytochrome-c oxidase) is used by ATP synthase for ATP synthesis. Complex II (CxII, succinate dehydrogenase) is a central driver of the reprogramming of metabolic and respiratory adaptation in response to various stimuli and abnormalities. c CxI, CxII and CxIV activities in whole cochlear extracts from WT (blue bars) and p43−/− (red bars) mice aged 1 and 10 months. DCIP: 2,6-dichloroindophenolate. Data are expressed as mean ± SD (n = 8 mice per age and strain). One-way ANOVA was followed by Dunn’s test (*P = 0.037, **P = 0.004, p43−/− vs. WT of the same age; *P = 0.037, ***P ≤ 0.001, older p43−/− vs. 1-month-old p43−/−; *P ≤ 0.05, older WT vs. 1-month-old WT). df Confocal images of transverse cryostat sections of the organ of Corti (d) and SGNs (e, f) from WT and p43−/− mice at 1 and 6 months. The sections were immunolabeled for cytochrome c oxidase (green), Myosin 7A (red), and Hoechst (blue). Reduction of cytochrome c oxidase was only observed in the SGNs, hair cells, and cochlear nerve fibers of 6-month-old p43−/− mice. The arrowheads in d indicate the cochlear nerve fibers. DCs: Deiters cells. Scale bars: a = 0.5 μm, df = 20 μm. g Quantitative analysis of malondialdehyde (MDA) in whole cochlear extracts from WT (blue bars) and p43−/− (red bars) mice aged 1 and 10 months of age. Data are expressed as mean ± SD (n = 8 mice per age and strain). One-way ANOVA test was followed by Dunn’s test (***P = 0.001, p43−/− vs. WT of the same age; ***P ≤ 0.001, older p43−/− vs. 1-month-old p43−/−; *P = 0.04, older WT vs. 1-month-old WT). h Representative western blot (Inset) and histograms of SIRT1 in whole cochlear extracts from WT (blue bars) and p43−/− (red bars) mice aged 1, 6, and 12 months. i: Representative western blot analysis using antibodies against Foxo3a, LC3B, Rab7, BNIP3, and β-actin in whole cochlear extracts from WT and p43−/− mice aged 1, 3, 6, and 12 months. j, k: Histograms representing the levels of Foxo3a, LC3-II, Rab7, and BNIP3 in WT (blue bars) and p43−/− (red bars). β-actin served as a loading control. Data are expressed as mean ± SD (n = 24 cochleae per age and strain. Each experiment was performed with a pool of 8 cochleae per sample, and in biological and technical triplicate). One-way ANOVA test was followed by Dunn’s test (*P ≤ 0.05, ** P ≤ 0.01, *** P ≤ 0.001, p43−/− vs. WT of the same age; * P ≤ 0.05, ***P ≤ 0.001, older p43−/− vs. 1-month-old p43−/−; *P ≤ 0.05, older WT vs. 1-month-old WT)
Fig. 6
Fig. 6
Macrophage invasion, pro-apoptotic protein expression. a: confocal images of transverse cryostat sections of the cochleae from p43−/− mice at 12 months. The sections were immunolabeled for CD45 (red), allowing macrophage detection and for parvalbumin (PV, green) to identify the SGNs, and counter-stained with Hoechst to label nuclear chromatin (blue). Note dramatic invasion of CD45 positive macrophages in the spiral ganglion (sg), the spiral lamina (sl), the organ of Corti (oC), the spiral ligament (Sl), and the stria vascularis (sv) of 12-month-old p43−/−. The left inset shows macrophages (red) surrounding the SGNs and the right inset, those in the spiral ligament. White arrowheads indicate macrophages. Scale bars: a = 100 μm, left inset = 20 μm, right inset = 10 μm. n, neuron. b Histogram representing the average number of macrophages per section from the transverse sections of the cochlear basal region of both WT (blue bars) and p43−/− (red bars) aged 1, 6, and 12 months. Data are expressed as mean ± SD (n = 4 or 5 sections per cochlea, 4 cochleae per age and strain). One-way ANOVA test was followed by Dunn’s test (*P ≤ 0.05, **P ≤ 0.01, p43−/− vs. WT of the same age; **P ≤ 0.01, ***P ≤ 0.001, older p43−/− vs. 1-month-old p43−/−; *P ≤ 0.05, ***P ≤ 0.001, older WT vs. 1-month-old WT). cj Confocal images of transverse cryostat sections of the organ of Corti (c, e, g, and i), and spiral ganglion (SG, d, f, h, and j) at 1 (c, d, g, and h) and 6 months (e, f, i, and j) from WT and p43−/− mice. The sections were labeled for NF-κB (green), and for calbindin (red) to identify the hair cells and SGNs, and counter-stained with Hoechst dye (blue). Note massive nuclear translocation of NF-κB in the SGNs of p43−/− mice aged 1 month (h). White arrowheads indicate nuclear NF-κB-positive SGNs. Scale bars: c, g, e, i = 10 μm, d, h, f, j = 20 μm. DCs, Deiters cells. k Histogram representing the percentage of nuclear NFκB-positive SGNs per section from the transverse sections of the cochlear basal regions of both WT (blue bars) and p43−/− (red bars) aged 1, 6, and 12 months. Data are expressed as mean ± SD (n = 4 or 5 sections per cochlea, 5 cochleae per age and strain). One-way ANOVA test was followed by Dunn’s test (**P ≤ 0.01, p43−/− vs. WT of the same age; **P ≤ 0.01, older WT vs. 1-month-old WT). l Representative western blot analysis using antibodies against NF-κB, p53, Bax, Bcl2 and β-actin in whole cochlear extracts from WT and p43−/− mice aged 1, 3, 6, and 12 months. m, n Histograms representing the levels of NF-κB, p53, Bcl2 and Bax in WT (blue bars) and p43−/− (red bars). β-actin served as a loading control. Data are expressed as mean ± SD (each experiment was performed with a pool of 8 cochleae per sample per age and per strain, and in biological and technical triplicate). One-way ANOVA test was followed by Dunn’s test (*P ≤ 0.05, ***P ≤ 0.001, p43−/− vs. WT of the same age; *P ≤ 0.05, **P ≤ 0.01, older p43−/− vs. 1-month-old p43−/−; *P ≤ 0.05, **P ≤ 0.01, ***P ≤ 0.001, older WT vs. 1-month-old WT)

Similar articles

Cited by

References

    1. Magarinos M, Milo M, Varela-Nieto I. Editorial: aging, neurogenesis and neuroinflammation in hearing loss and protection. Front Aging Neurosci. 2015;7:138. - PMC - PubMed
    1. Ng L, Kelley MW, Forrest D. Making sense with thyroid hormone--the role of T (3) in auditory development. Nat Rev Endocrinol. 2013;9(5):296–307. - PubMed
    1. Wrutniak-Cabello C, Casas F, Cabello G. Thyroid hormone action in mitochondria. J Mol Endocrinol. 2001;26(1):67–77. - PubMed
    1. Mullur R, Liu YY, Brent GA. Thyroid hormone regulation of metabolism. Physiol Rev. 2014;94(2):355–382. - PMC - PubMed
    1. Lautermann J, ten Cate WJ. Postnatal expression of the alpha-thyroid hormone receptor in the rat cochlea. Hear Res. 1997;107(1–2):23–28. - PubMed

Publication types

Substances