. 2021 Feb 1;18(1):38.
doi: 10.1186/s12974-021-02091-5.

Fluoxetine regulates eEF2 activity (phosphorylation) via HDAC1 inhibitory mechanism in an LPS-induced mouse model of depression

Affiliations

Fluoxetine regulates eEF2 activity (phosphorylation) via HDAC1 inhibitory mechanism in an LPS-induced mouse model of depression

Weifen Li et al. J Neuroinflammation. .

Erratum in

Abstract

Background: Selective serotonin reuptaker inhibitors, including fluoxetine, are widely studied and prescribed antidepressants, while their exact molecular and cellular mechanism are yet to be defined. We investigated the involvement of HDAC1 and eEF2 in the antidepressant mechanisms of fluoxetine using a lipopolysaccharide (LPS)-induced depression-like behavior model.

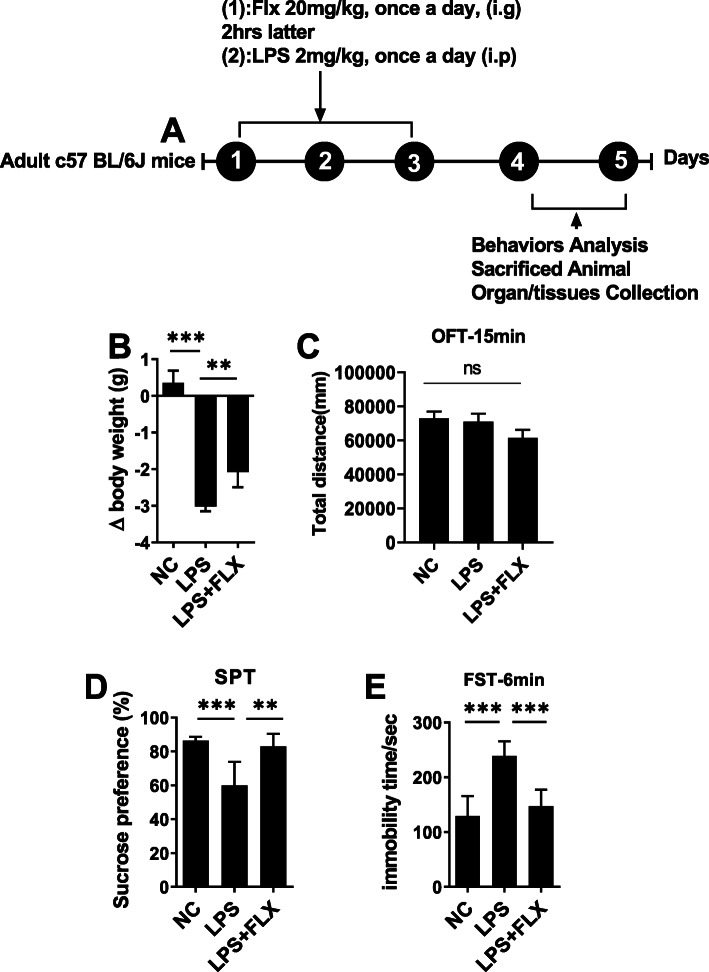
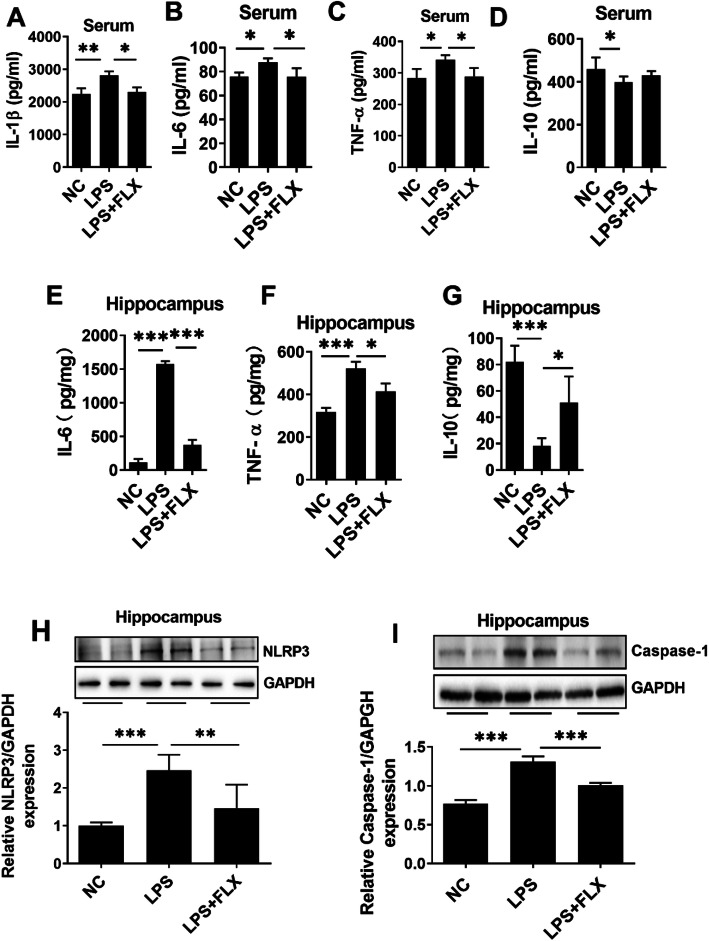
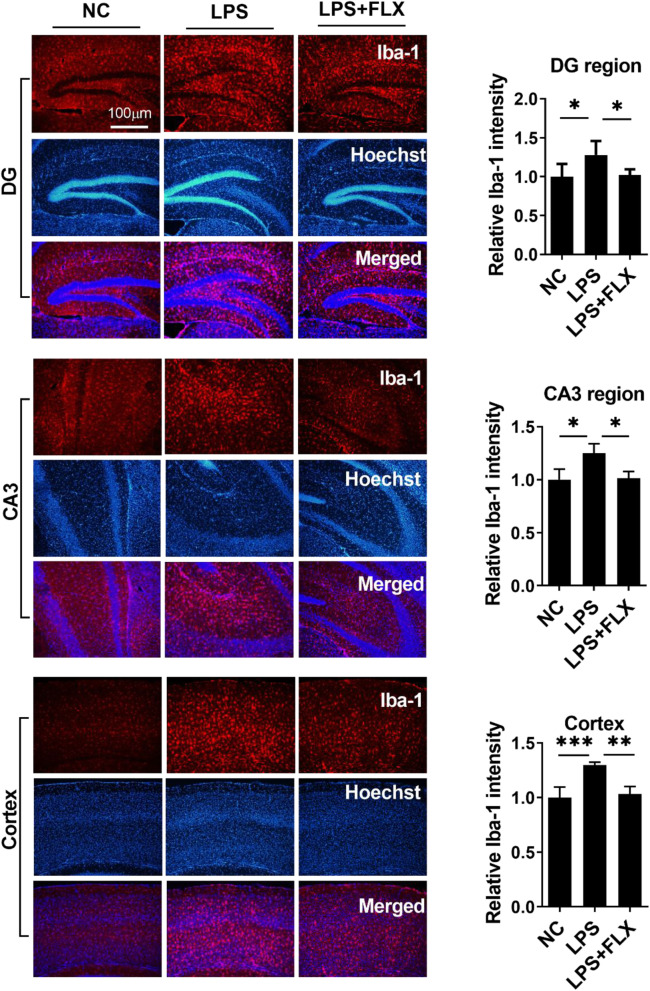
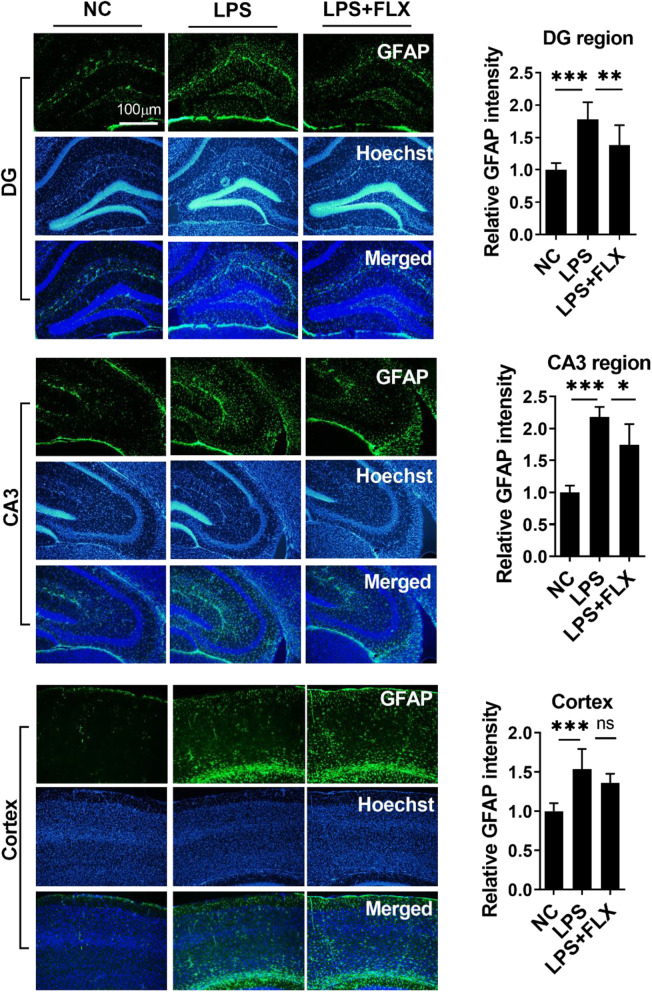
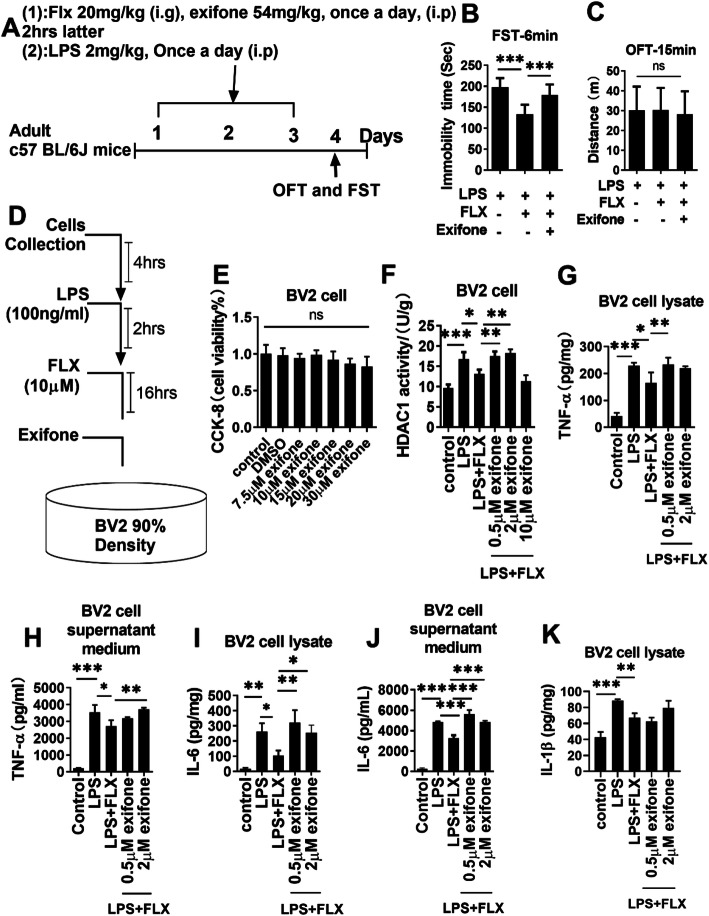
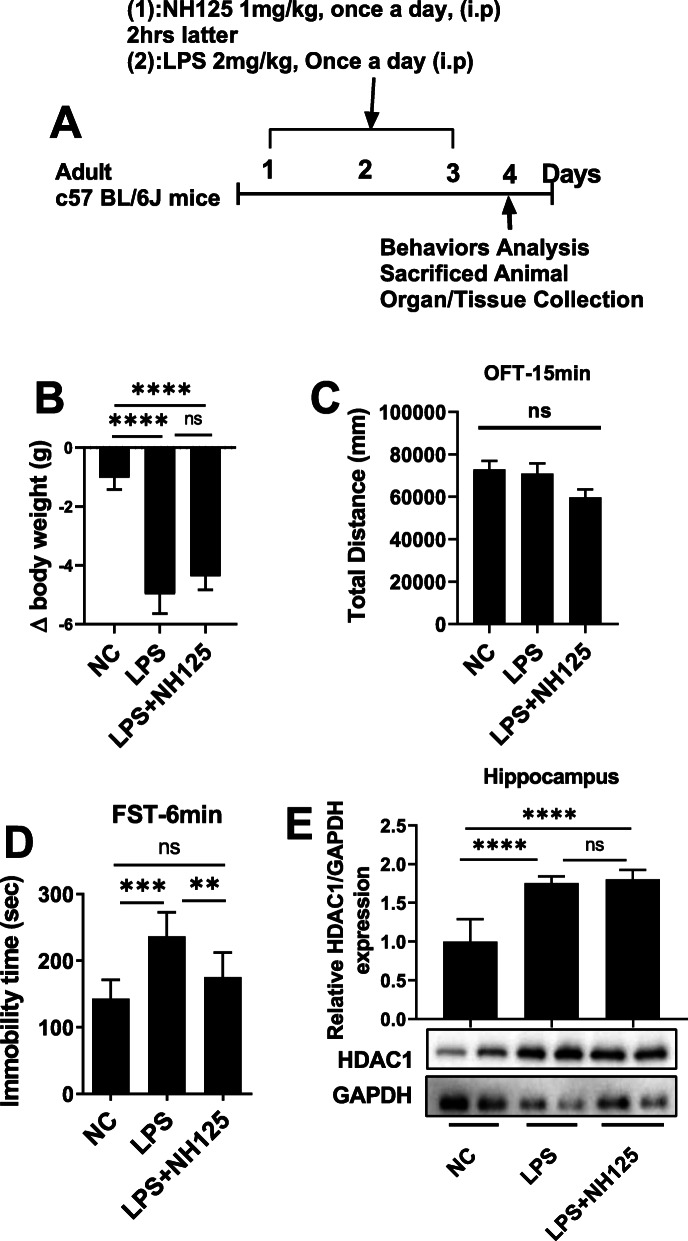
Methods: For in vivo analysis, mice were treated with LPS (2 mg/kg BW), fluoxetine (20 mg/kg BW), HDAC1 activator (Exifone: 54 mg/kg BW) and NH125 (1 mg/kg BW). Depressive-like behaviors were confirmed via behavior tests including OFT, FST, SPT, and TST. Cytokines were measured by ELISA while Iba-1 and GFAP expression were determined by immunofluorescence. Further, the desired gene expression was measured by immunoblotting. For in vitro analysis, BV2 cell lines were cultured; treated with LPS, exifone, and fluoxetine; collected; and analyzed.

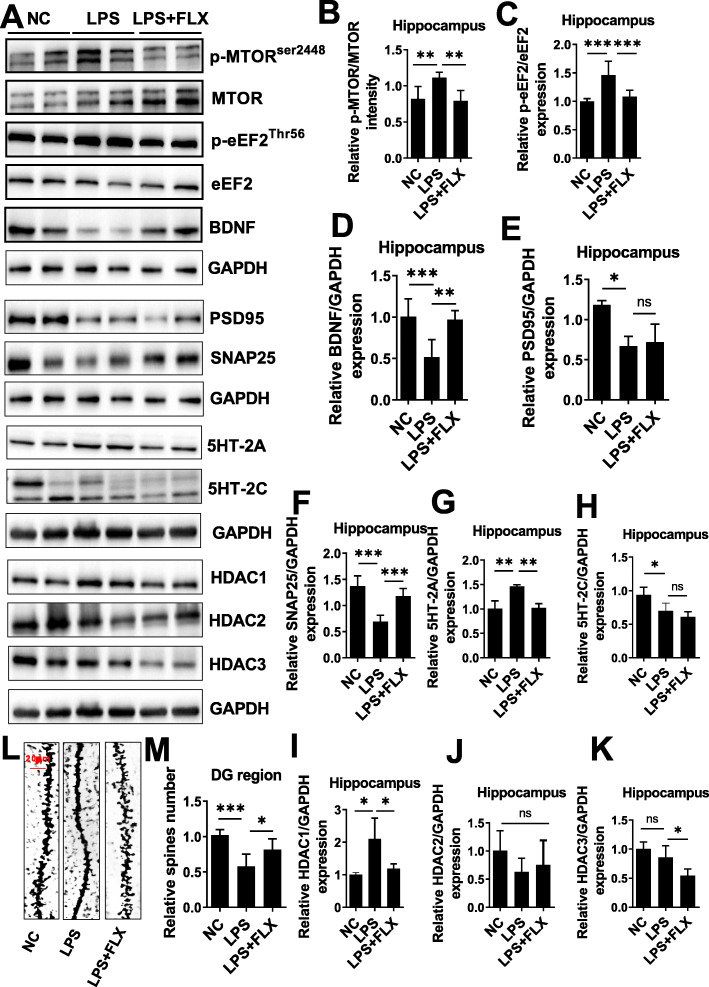
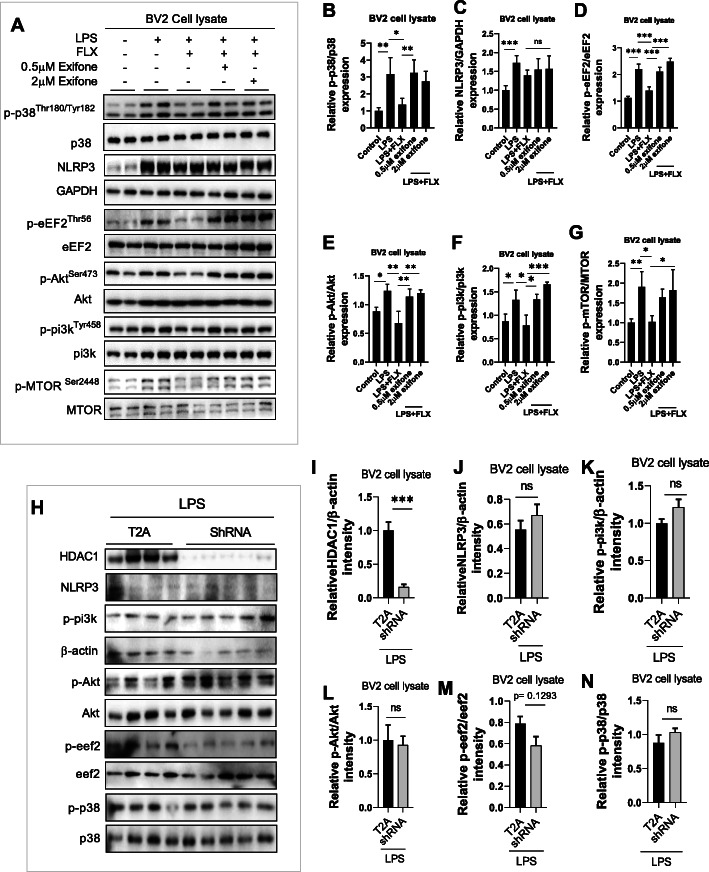
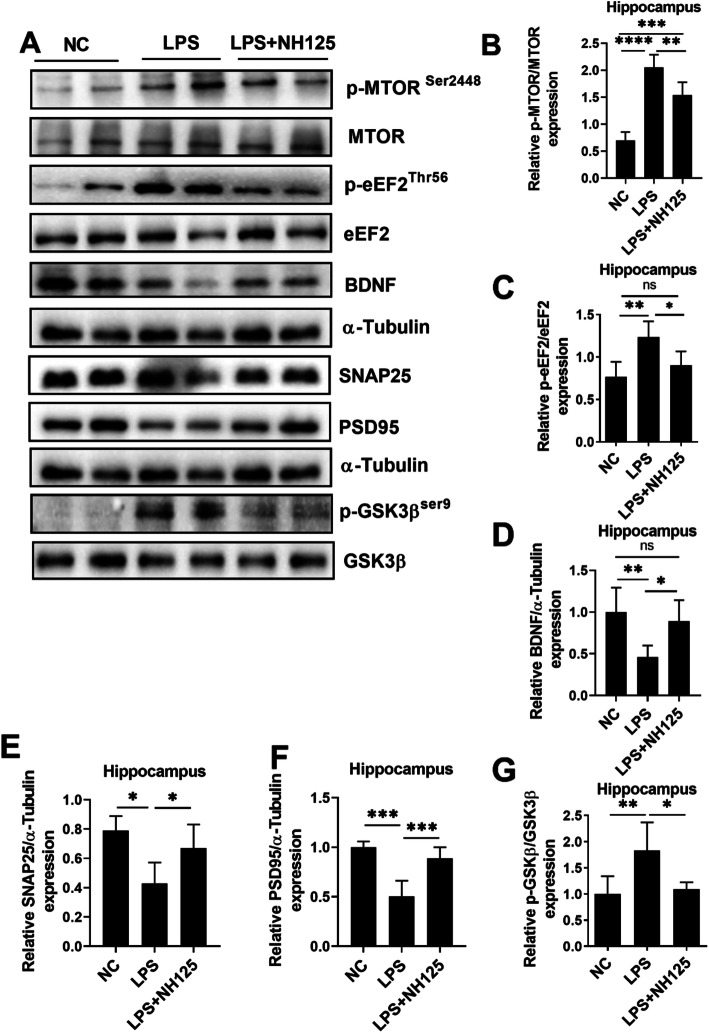
Results: Mice treated with LPS displayed depression-like behaviors, pronounced neuroinflammation, increased HDAC1 expression, and reduced eEF2 activity, as accompanied by altered synaptogenic factors including BDNF, SNAP25, and PSD95. Fluoxetine treatment exhibited antidepressant effects and ameliorated the molecular changes induced by LPS. Exifone, a selective HDAC1 activator, reversed the antidepressant and anti-inflammatory effects of fluoxetine both in vivo and in vitro, supporting a causing role of HDAC1 in neuroinflammation allied depression. Further molecular mechanisms underlying HDAC1 were explored with NH125, an eEF2K inhibitor, whose treatment reduced immobility time, altered pro-inflammatory cytokines, and NLRP3 expression. Moreover, NH125 treatment enhanced eEF2 and GSK3β activities, BDNF, SNAP25, and PSD95 expression, but had no effects on HDAC1.

Conclusions: Our results showed that the antidepressant effects of fluoxetine may involve HDAC1-eEF2 related neuroinflammation and synaptogenesis.

Keywords: Depression; Fluoxetine; HDAC1-eEF2; Neuroinflammation; Synaptogenesis.


Conflict of interest statement

The authors declare no competing financial interests.

Figures

Fig. 1
Fig. 1
Fluoxetine reduced LPS-induced depressive-like behaviors. a Drug treatment schedule, b relative body weights, c open field test OFT, d forced swimming test, and e sucrose preference test. All the values are expressed as mean ± SEM: ANOVA followed by post hoc analysis. *p < 0.05, **p < 0.01, ***p < 0.001, ****p < 0.0001
Fig. 2
Fig. 2
Fluoxetine reduced LPS-induced neuroinflammation. a Serum IL-1β, b serum IL-6, c serum TNF-α, d serum IL-10 level, e hippocampal IL-6, f hippocampal TNF-α, g hippocampal IL-10, h NLRP3 level column graph, and representative western blots for mice treated with LPS and fluoxetine. i Total level of caspase-1 and representative western blots. All the values were normalized with GAPDH. Image Lab Software was used for blots quantitative analysis and was analyzed via GraphPad prism. Data were expressed as ± SEM, one-way ANOVA followed by post hoc analysis. p = < 0.05 were considered significant. *p < 0.05, **p < 0.01, ***p < 0.001, ****p < 0.0001
Fig. 3
Fig. 3
Fluoxetine reduced LPS effect on Iba-1 expression. Microscopy results of Iba-1 expression in the different experimental groups of brain tissues, with respective bar graphs (n = 6), x10 magnification. The image data were collected from three independent experiments and were analyzed by ImageJ software. The differences have been shown in the graphs. Data were expressed as ± SEM, one-way ANOVA followed by post hoc analysis. p = < 0.05 were considered significant. *p < 0.05, **p < 0.01), ***p < 0.001, ****p < 0.0001
Fig. 4
Fig. 4
Fluoxetine reduced LPS effect on GFAP. Microscopy results of GFAP expression in the different experimental groups of brain tissues, with respective bar graphs (n = 7), x10 magnification. The image data were collected from three independent experiments and were analyzed by ImageJ software. The differences have been shown in the graphs. Data were expressed as ± SEM, one-way ANOVA followed by post hoc analysis. p = < 0.05 were considered significant. *p < 0.05, **p < 0.01, ***p < 0.001, ****p < 0.0001
Fig. 5
Fig. 5
Fluoxetine attenuated LPS effect on mTOR/eEF2/BDNF/SNAP25/PSD95 and HDACs. a Representative immune blot images and average protein levels of b p-mTOR, c p-eEF2, d BDNF, e PSD95, f SNAP25, g 5HT2A, and h 5HT-2C. i–k Average level of HDAC1, HDAC2, and HDAC3 levels, respectively. l, m Golgi staining showing spine density and column graph showing spin numbers. Image Lab Software was used for blot quantitative analysis and was analyzed via GraphPad prism. Data were expressed as ± SEM, one-way ANOVA followed by post hoc analysis. p = < 0.05 were considered significant. *p < 0.05, **p < 0.01), ***p < 0.001, ****p < 0.0001
Fig. 6
Fig. 6
Exifone treatment reversed the neuroprotective effect of fluoxetine. a Drug treatment schedule, b FST, c OFT, d BV-2 cell drug treatment schedule, e BV-2 cell viability assay, f HDAC1 activity in exifone, LPS, and fluoxetine-treated BV-2 cells, g TNF-α level in cell lysate, h TNF-α in cell supernatant, i IL-6 level in cell lysate, j IL-6 in cell supernatant, k IL-1β level in exifone, LPS, and fluoxetine-treated BV-2 cell lysates. Data were expressed as ± SEM, one-way ANOVA followed by post hoc analysis. p = < 0.05 were considered significant. *p < 0.05, **p < 0.01), ***p < 0.001, ****p < 0.0001
Fig. 7
Fig. 7
Exifone attenuated fluoxetine effects during in vitro analysis. a Representative immune blot images and average protein levels of b p-p38, c NLRP3, d p-eEF2, e p-Akt, f p-pi3k, and g p-mTOR.h Representative immune blot images and average protein levels of i HDAC1, j NLRP3, k p-pi3k, l p-Akt, m p-eeF2, and n p-p38. Image Lab Software was used for blot quantitative analysis and was analyzed via GraphPad prism. Data were expressed as ± SEM, one-way ANOVA followed by post hoc analysis. p = < 0.05 were considered significant. *p < 0.05, **p < 0.01), ***p < 0.001, ****p < 0.0001
Fig. 8
Fig. 8
NH125 reduced LPS-induced changes. a Drug treatment schedule, b relative body weights, c OFT, d FST, e average protein level of HDAC1, and western blot image, normalized by GAPDH. Image Lab Software was used for blot quantitative analysis and was analyzed via GraphPad prism. Data were expressed as ± SEM, one-way ANOVA followed by post hoc analysis. p = < 0.05 were considered significant. *p < 0.05, **p < 0.01), ***p < 0.001, ****p < 0.0001
Fig. 9
Fig. 9
NH125 treatment attenuated LPS-induced changes in the brain of mice. a Representative immune blot images and average protein levels of b p-mTOR, c p-eEF2, d BDNF, e SNAP25, f PSD95, and g p-GSK3β. Image Lab Software was used for blot quantitative analysis and was analyzed via GraphPad prism. Data were expressed as ± SEM, one-way ANOVA followed by post hoc analysis. p = < 0.05 were considered significant. *p < 0.05, **p < 0.01), (***) p < 0.001, ****p < 0.0001

Similar articles

Cited by

References

    1. Liu Q, He H, Yang J, Feng X, Zhao F, Lyu J. Changes in the global burden of depression from 1990 to 2017: findings from the Global Burden of Disease study. Journal of Psychiatric Research. 2020;126:134–140. - PubMed
    1. Wang J, Wu X, Lai W, Long E, Zhang X, Li W, Zhu Y, Chen C, Zhong X, Liu Z, et al. Prevalence of depression and depressive symptoms among outpatients: a systematic review and meta-analysis. BMJ Open. 2017;7:e017173. - PMC - PubMed
    1. Ruberto VL, Jha MK, Murrough JW. Pharmacological treatments for patients with treatment-resistant depression. Pharmaceuticals (Basel). 2020;13. - PMC - PubMed
    1. Driessen E, Dekker JJM, Peen J, Van HL, Maina G, Rosso G, Rigardetto S, Cuniberti F, Vitriol VG, Florenzano RU, et al. The efficacy of adding short-term psychodynamic psychotherapy to antidepressants in the treatment of depression: a systematic review and meta-analysis of individual participant data. Clin Psychol Rev. 2020;80:101886. - PubMed
    1. Ionescu DF, Rosenbaum JF, Alpert JE. Pharmacological approaches to the challenge of treatment-resistant depression. Dialogues Clin Neurosci. 2015;17:111–126. - PMC - PubMed

MeSH terms