. 2021 Feb 2;16(1):2.
doi: 10.1186/s13064-021-00152-2.

Cellular response to spinal cord injury in regenerative and non-regenerative stages in Xenopus laevis

Affiliations

Cellular response to spinal cord injury in regenerative and non-regenerative stages in Xenopus laevis

Gabriela Edwards-Faret et al. Neural Dev. .

Abstract

Background: The efficient regenerative abilities at larvae stages followed by a non-regenerative response after metamorphosis in froglets makes Xenopus an ideal model organism to understand the cellular responses leading to spinal cord regeneration.

Methods: We compared the cellular response to spinal cord injury between the regenerative and non-regenerative stages of Xenopus laevis. For this analysis, we used electron microscopy, immunofluorescence and histological staining of the extracellular matrix. We generated two transgenic lines: i) the reporter line with the zebrafish GFAP regulatory regions driving the expression of EGFP, and ii) a cell specific inducible ablation line with the same GFAP regulatory regions. In addition, we used FACS to isolate EGFP+ cells for RNAseq analysis.

Results: In regenerative stage animals, spinal cord regeneration triggers a rapid sealing of the injured stumps, followed by proliferation of cells lining the central canal, and formation of rosette-like structures in the ablation gap. In addition, the central canal is filled by cells with similar morphology to the cells lining the central canal, neurons, axons, and even synaptic structures. Regeneration is almost completed after 20 days post injury. In non-regenerative stage animals, mostly damaged tissue was observed, without clear closure of the stumps. The ablation gap was filled with fibroblast-like cells, and deposition of extracellular matrix components. No reconstruction of the spinal cord was observed even after 40 days post injury. Cellular markers analysis confirmed these histological differences, a transient increase of vimentin, fibronectin and collagen was detected in regenerative stages, contrary to a sustained accumulation of most of these markers, including chondroitin sulfate proteoglycans in the NR-stage. The zebrafish GFAP transgenic line was validated, and we have demonstrated that is a very reliable and new tool to study the role of neural stem progenitor cells (NSPCs). RNASeq of GFAP::EGFP cells has allowed us to clearly demonstrate that indeed these cells are NSPCs. On the contrary, the GFAP::EGFP transgene is mainly expressed in astrocytes in non-regenerative stages. During regenerative stages, spinal cord injury activates proliferation of NSPCs, and we found that are mainly differentiated into neurons and glial cells. Specific ablation of these cells abolished proper regeneration, confirming that NSPCs cells are necessary for functional regeneration of the spinal cord.

Conclusions: The cellular response to spinal cord injury in regenerative and non-regenerative stages is profoundly different between both stages. A key hallmark of the regenerative response is the activation of NSPCs, which massively proliferate, and are differentiated into neurons to reconstruct the spinal cord. Also very notably, no glial scar formation is observed in regenerative stages, but a transient, glial scar-like structure is formed in non-regenerative stage animals.

Keywords: Gfap; Glial scar; NSPCs; Neurogenesis; Regeneration; Spinal cord; Xenopus; sox2.


Conflict of interest statement

The authors declare that they have no competing interests.

Figures
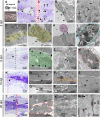
Fig. 1
Fig. 1
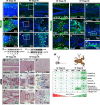
Cellular response to injury in Regenerative Stage. a Cartoon of spinal cord injury in NF stage 50. b, c Semithin sections of the b rostral and c caudal stumps at 2 days post transection (dpt) stained with methylene blue. Arrowheads in panel C showed macrophages. d-i; k-m; o-s; u, v Correspond to ultrathin sections observed by transmission electron microscopy. d-i Different regions of the spinal cord at 2 dpt; d cells lining the central canal (cc) closing the rostral stump (black arrowhead); e mitochondrial swelling (black arrow) observed in cells from panel D; black arrowheads depict the separation between two cells; f, g mitotic clusters of cells (yellow shadow); h cell undergoing extrusion (purple shadow); i macrophage from panel C from the injured site. j Semithin section at 6 dpt. k-m Different regions of the spinal cord at 6 dpt; k cells in the central canal of the caudal stump (green shadow), without contact with ependymal cells (black arrowheads); l synaptic density (black arrowheads) and synaptic vesicles (white arrowheads); m cells forming a rosette structure in the ablation gap (red shadow). n Semithin section at 10 dpt. o-s Different regions of the spinal cord at 10 dpt; o a bundle of unmyelinated axons surrounded by ependymal cells (black arrowheads); p unmyelinated axon (orange shadow), and synaptic vesicles (white arrowheads); q desmosome junction (black arrowhead) between ependymal cells next to unmyelinated axons; r a myelinated axon (white arrowhead) in the cc of the caudal stump; s neuronal nuclei in the cc of the caudal stump (black arrowhead). t Semithin section at 20 dpt. u-w Different regions of the spinal cord at 20 dpt; u cells in the cc (red line); v ependymal cells with regular shape in the regenerated spinal cord with apical mitochondria (m); w desmosome junctions between the regenerated ependymal cells (black arrowheads). The red dotted lines indicate the injured site (a, b, c, j, n, t)
Fig. 2
Fig. 2
Cellular response to injury in Non-Regenerative Stage. a Cartoon depicting the process of spinal cord injury in NF stage 66. b Semithin section at 2 dpt. c, d; f-g; i-l; n-p Correspond to ultrathin sections observed by transmission electron microscopy. c, d Different regions of the spinal cord at 2 dpt; c central canal (cc) next to the injured site (black arrowheads); d extracellular matrix and red blood cells (red shadow) in the injury site. e Semithin section at 6 dpt. f, g Different regions of the spinal cord at 6 dpt; f ependymal cells in the rostral stump (black arrowheads); g macrophage (blue line) engulfing red blood cells (red shadow) in the cc. h Semithin section of the caudal stump at 10 dpt. i-l Different regions of the spinal cord at 10 dpt; i ependymal cells near to the injured site; j mitochondria (white arrowhead) in the apical surface of ependymal cell (blue line) in contact with the cc; k glial cell processes next to the injured site (white arrowheads); l intermediate filaments (white arrowheads) in the glial process (green line). m Semithin section at 20 dpt. n-p Different regions of the spinal cord at 20 dpt; n ablation gap (red lines) filled with fibroblast-like cell (white arrowhead), and surrounded by extracellular matrix; o microglial-like cell (cyan line) with abundant rough endoplasmic reticulum (white arrowheads); p abundant Collagen (col) fibers (dots) in the injured site. The red dotted lines indicate the injured site (a, b, e, h, m)
Fig. 3
Fig. 3
Glial cell and extracellular matrix response to spinal cord injury in R-Stage and NR-Stage. a-c Immunostaining against vimentin in a uninjured, and at b 2 and c 6 dpt from animals at NF stage 50. d Western blot against Vimentin (Vim) and GAPDH of spinal cords samples obtained from uninjured (ui), and at 2, 6, 10 and 20 dpt in animals at NF stage 50. e-g Immunostaining against Vimentin in uninjured (e-e’), and at (f, f’) 10 and (g-g’) 20 dpt from animals at NF stage 66. h Western blot against Vim and GAPDH of spinal cords samples obtained from uninjured (ui), and at 2, 6, 10 and 20 dpt in animals at NF stage 66. i-o Immunofluorescence against fibronectin in i uninjured, j 6 dpt, and k 10 dpt in NF stage 50; and l uninjured, m 10 dpt, and n 30 dpt in animals at NF stage 66. o-p Immunofluorescence against CSPG in o uninjured, and p-p’ at 40 dpt in NF stage 66. q-v AFOG staining shown Collagen (blue), cells (orange) and Fibrin (red) in q uninjured, and at r 6 and s 10 dpt in animals at NF stage 50, and in t-t’ uninjured, and at u-u’ 10 and v-v’ 20 dpt from animals at NF stage 66. w Analysis of gene expression change upon spinal cord injury comparing injured animals (Ts) with control sham (sham) surgery at 1, 2 and 6 days after injury in NF stage 50 (1R, 2R and 6R), and NF stage 66 (1NR, 2 NR and 6 NR). Colored and crosses scale indicates the level of increase upon injury in green (+, ++, +++) and decrease in red (−, −−, −−−), data obtained from a previous RNAseq analysis [49]. The red dotted lines (b, f, g, j, m, n, p, r, u, v) and yellow arrows (c, k, s) indicate the injured site. Nuclei stained with Hoechst in blue (a-c; e-g; i-p)
Fig. 4
Fig. 4
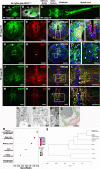
Zebrafish regulatory regions of GFAP drive expression of EGFP in neural stem and progenitor cells, and astrocytes in Xenopus laevis spinal cord. A-C Lateral view of EGFP expression in the central nervous system at A, B NF-Stage 43, and C NF-Stage 50. A EGFP expression in the eye, brain and spinal cord (arrowheads). B EGFP/brightfield merge. C Dorsal view of EGFP expression in the optic tectum, hindbrain and spinal cord at NF stage 50. D-F Double staining against D EGFP and E Sox2. Panels F showed merge image, and F’, F” magnifications of the dorsal and ventral cells surrounding the central canal. G-O’ Characterization of EGFP cells by double staining at NF stage 66. G-I” EGFP and Sox2; J-L’ EGFP and Brain lipid-binding protein (BLBP); and M-O’ EGFP and Glutamine synthase (GS). Nuclei are label in blue with Hoechst. P-Q Immunogold staining against EGFP at NF stage 50. P EGFP+ cell in contact with the central canal. P’ Magnification of square in P. Expression of EGFP is visualized by the black dots of the gold staining. P” Magnification of square in P’. Gold staining (black arrowhead) in close apposition with filaments (white arrowhead). Q Endfeet from an EGFP+ cell (colored green) in close contact with blood vessel (colored red). R Gene ontology analysis of the RNAseq from EGFP+ cells revealed the stem cell/neural precursor cell identity of these cells. S Dendrogram of EGFP+ cells and EGFP cells showing the hierarchical clustering of EGFP+ cells with astrocytes and EGFP cells with neurons and oligodendrocytes. Scale bar: C, F’-F″: 20 μm; A-B, D-F, I’-I″, L’, O’: 50 μm; G-I, J-L, M-O: 200 μm
Fig. 5
Fig. 5
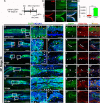
Response to injury of Neural Stem and Progenitor Cells. a Scheme of EdU treatment. b Click-iT staining for EdU (red), and immunofluorescence against EGFP (green), merge with nuclei (blue) in sham control animals at 2 days post sham operation (dps), and 2 dpt. c Graph of EdU-EGFP positive cells per mm3 at 2 dps (red bar) and 2 dpt (green bar). t-Test, ***: p < 0.001. d, e, f, g, h, i Immunofluorescence against EGFP (green) at NF stage 50 in d uninjured, e 2 days post resection (dpr), f 6 dpr, g 7 dpr, h 10 dpr, and i 20 dpr. Magnifications are shown in panels d’-d”, e’-e”, f’-f”, g’, h’ and i’-i”. j, k, l, m, n, o. Serial sections from the same preparation shown in panels d, e, f, g, h, i double stained for EGFP (green) with the neuronal marker Acetylated tubulin (red), and merge (orange). Nuclei are label in blue with Hoechst. White arrowhead highlights colocalization. Scale bar: d, e, f, g, h, i: 200 μm; d’-d”, e’-e”, f’-f”, g’, h’, i’-i”, j-j”, k-k”, l-l”, m-m”, n-n”, o-o”: 50 μm
Fig. 6
Fig. 6
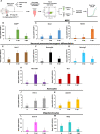
Analysis of the differentiation of Neural Stem Progenitor Cells in response to spinal cord injury. a Diagram of the experimental procedure. b-m Graphs of the ratio in the mRNA levels for the indicated genes between the EGFP+ cells and EGFP cells in uninjured (ui), 2 and 6 dpt. b EGFP, c, d NSPCs markers: c sox2, d nestin. e-i neuronal precursor/neurogenic differentiation markers: e achaete-scute homolog 1 (ascl1), f neurogenin2a (neurog2a), g neurogenin3 (neurog3), h neurod1, i doublecortin (dcx). j, k Astrocytes markers: j vimentin-a (vim-a), k aldh1l1. l, m Oligodendrocytes markers: l sox10, m myelin basic protein (mbp). n = 2–3 samples. Standard error bar is included in each graph
Fig. 7
Fig. 7
Ablation of NSPCs blocks spinal cord regeneration. a Diagram of the treatment of zGFAP::mCherry-NTR transgenic animals with metronidazol (MTZ) or vehicle, followed by spinal cord resection, swimming recording, and histological analysis. b-e Eye imaging (b, d) before treatment, and 7 days after incubation with c vehicle or e MTZ. f, g Spinal cord sections showing mCherry expression f before, and g 7 days after MTZ treatment. h Graph of swimming at 1, 10, 15, 25 dpr in sham (Sh) operated animals treated with MTZ (Sh-MTZ, blue boxes), and resected (Rs) animals incubated with vehicle (Rs-Vehicle, red boxes) or MTZ (Rs-MTZ, green boxes). i-l Immunofluorescence against Sox2 (green) and nuclei stained with Hoechst of spinal cord sections obtained from animals at 30 dpr from the i, j Rs-vehicle, and k, l Rs-MTZ treated groups. Statistics in graph H: ANOVA-one way with Bonferroni post-test, ** p < 0.01, n = 4 independent biological replicates

Similar articles

Cited by

References

    1. Diaz Quiroz JF, Echeverri K. Spinal cord regeneration: where fish, frogs and salamanders lead the way, can we follow? Biochem J. 2013;451(3):353–364. - PubMed
    1. Cardozo MJ, Mysiak K, Becker T, Becker CG. Reduce, reuse, recycle - developmental signals in spinal cord regeneration. Dev Biol. 2017;432(1):53–62. - PubMed
    1. Marichal N, Reali C, Rehermann MI, Trujillo-Cenóz O, Russo RE. Progenitors in the Ependyma of the spinal cord: a potential resource for self-repair after injury. Adv Exp Med Biol. 2017;1015:241–264. - PubMed
    1. Parker D. The Lesioned spinal cord is a “new” spinal cord: evidence from functional changes after spinal injury in lamprey. Front Neural Circuits. 2017;11:84. - PMC - PubMed
    1. Lee-Liu D, Méndez-Olivos EE, Muñoz R, Larraín J. The African clawed frog Xenopus laevis: a model organism to study regeneration of the central nervous system. Neurosci Lett. 2017;652:82–93. - PubMed

Publication types