. 2021 Mar 10;41(10):2119-2134.
doi: 10.1523/JNEUROSCI.2654-20.2021. Epub 2021 Feb 1.

Palmitoylation Controls NMDA Receptor Function and Steroid Sensitivity

Affiliations

Palmitoylation Controls NMDA Receptor Function and Steroid Sensitivity

Pavla Hubalkova et al. J Neurosci. .

Abstract

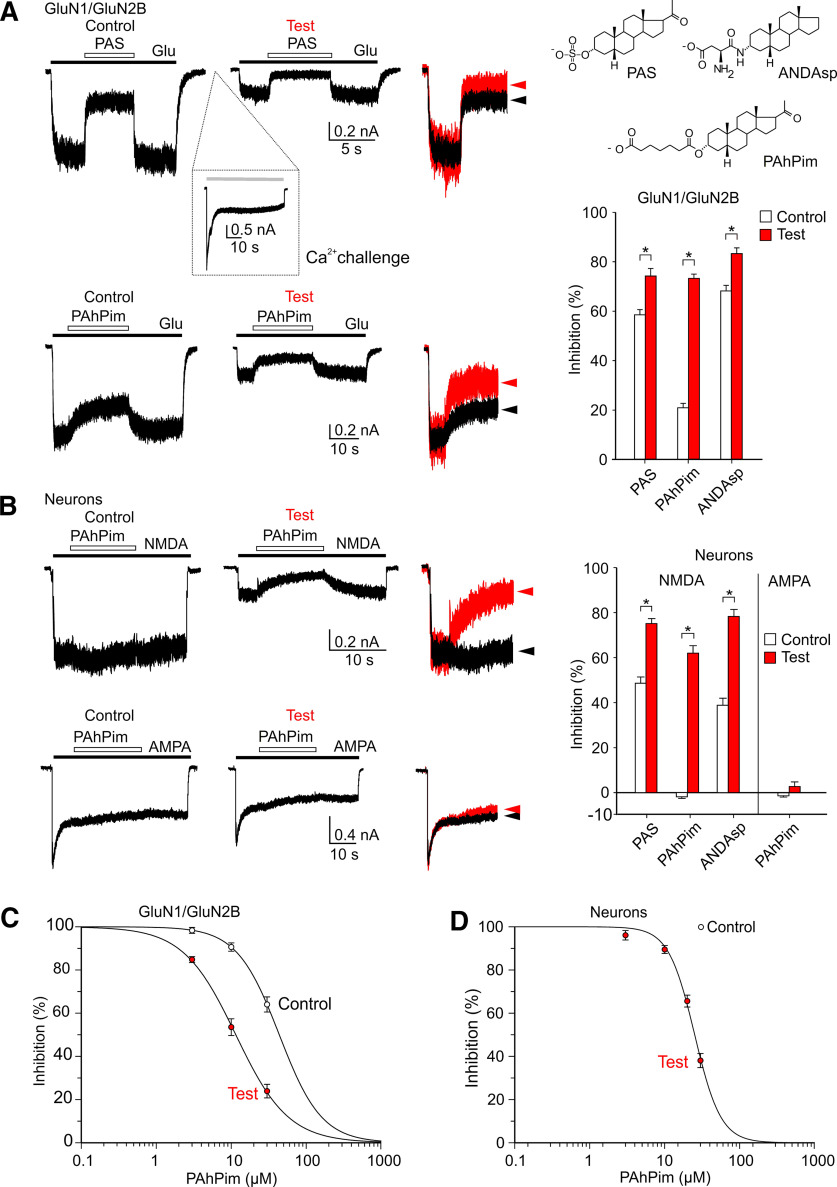
NMDARs are ligand-gated ion channels that cause an influx of Na+ and Ca2+ into postsynaptic neurons. The resulting intracellular Ca2+ transient triggers synaptic plasticity. When prolonged, it may induce excitotoxicity, but it may also activate negative feedback to control the activity of NMDARs. Here, we report that a transient rise in intracellular Ca2+ (Ca2+ challenge) increases the sensitivity of NMDARs but not AMPARs/kainate receptors to the endogenous inhibitory neurosteroid 20-oxo-5β-pregnan-3α-yl 3-sulfate and to its synthetic analogs, such as 20-oxo-5β-pregnan-3α-yl 3-hemipimelate (PAhPim). In cultured hippocampal neurons, 30 μm PAhPim had virtually no effect on NMDAR responses; however, following the Ca2+ challenge, it inhibited the responses by 62%; similarly, the Ca2+ challenge induced a 3.7-fold decrease in the steroid IC50 on recombinant GluN1/GluN2B receptors. The increase in the NMDAR sensitivity to PAhPim was dependent on three cysteines (C849, C854, and C871) located in the carboxy-terminal domain of the GluN2B subunit, previously identified to be palmitoylated (Hayashi et al., 2009). Our experiments suggested that the Ca2+ challenge induced receptor depalmitoylation, and single-channel analysis revealed that this was accompanied by a 55% reduction in the probability of channel opening. Results of in silico modeling indicate that receptor palmitoylation promotes anchoring of the GluN2B subunit carboxy-terminal domain to the plasma membrane and facilitates channel opening. Depalmitoylation-induced changes in the NMDAR pharmacology explain the neuroprotective effect of PAhPim on NMDA-induced excitotoxicity. We propose that palmitoylation-dependent changes in the NMDAR sensitivity to steroids serve as an acute endogenous mechanism that controls NMDAR activity.SIGNIFICANCE STATEMENT There is considerable interest in negative allosteric modulators of NMDARs that could compensate for receptor overactivation by glutamate or de novo gain-of-function mutations in neurodevelopmental disorders. By a combination of electrophysiological, pharmacological, and computational techniques we describe a novel feedback mechanism regulating NMDAR activity. We find that a transient rise in intracellular Ca2+ increases NMDAR sensitivity to inhibitory neurosteroids in a process dependent on GluN2B subunit depalmitoylation. These results improve our understanding of the molecular mechanisms of steroid action at the NMDAR and indeed of the basic properties of this important glutamate-gated ion channel and may aid in the development of therapeutics for treating neurologic and psychiatric diseases related to overactivation of NMDARs without affecting normal physiological functions.

Keywords: NMDAR; carboxy-terminal domain; molecular dynamics simulation; neurosteroid; palmitoylation; single-channel recording.


Figures

Figure 1.
Figure 1.
NMDAR apparent affinity for steroids is increased following the Ca2+ challenge. Examples of traces obtained from HEK cells expressing GluN1/GluN2B receptors (A) and from cultured rat hippocampal neurons expressing native NMDARs and AMPARs (B). PAS (100 μm) and PAhPim were applied in the presence of 1 μm glutamate (A) or 10 μm NMDA or 5 μm AMPA (B). Open and filled bars represent the duration of the steroid and the agonist application, respectively, in the continuous presence of 0.2 mm [Ca2+]o before (Control) and after (Test) the application of 1 mm glutamate (A) or 100 μm NMDA (B) in the presence of 2 mm [Ca2+]o (Ca2+ challenge is shown in A, inset). Right, Control (black) and test (red) responses are displayed overlaid and normalized with respect to the current amplitude before the steroid application to show the difference in the steroid inhibitory effect. The structure of the steroids used is shown in A (top right corner). Bar graphs represent the inhibitory effect ± SEM for PAS (100 μm), PAhPim (30 μm), and ANDAsp (20 μm) on control (open bars) and test (red bars) responses determined in HEK cells expressing GluN1/GluN2B receptors (A) and in cultured rat hippocampal neurons expressing native NMDA or AMPARs (B). Data were statistically analyzed using paired t tests. *Statistically significant difference between control and test responses (for details and p values, see Extended Data Table 1-1). Dose–response analysis of the PAhPim (3-30 μm) effect on the control and test responses recorded from recombinant GluN1/GluN2B receptors (C) and the test responses recorded from native NMDARs in cultured hippocampal neurons (D). Steroid-induced inhibition was fitted to Equation 3.
Figure 2.
Figure 2.
Increased GluN1/GluN2B receptor sensitivity to PAhPim is induced by increased [Ca2+]i, but its maintenance is Ca2+-independent. Simultaneous Ca2+ imaging and glutamate-evoked current recording was used to monitor changes in [Ca2+]i and the degree of PAhPim inhibition (for details, see Materials and Methods). The relative degree of PAhPim (30 μm) inhibition of control (open symbols) and test (filled symbols) responses of GluN1/GluN2B receptors is plotted as a function of time (symbols represent individual cells) (top). Blue rectangle represents the duration of the Ca2+ challenge. fura fluorescence ratio F340/F380 acquired at the frequency of 1 Hz was assessed before, during, and after the Ca2+ challenge. Graph represents mean (black line) ± SEM (gray area) F340/F380 values (n = 6) (bottom). Mean PAhPim inhibition (red line) ± SEM (gray area) at 1.3-2.3 min (steroid application immediately after the Ca2+ challenge when F340/F380 was maximal; 77.8 ± 4.7%) and at 5-7 min (when F340/F380 was again at baseline levels; 67.9 ± 4.2%; n = 6). The degree of inhibition was not significantly different between these time periods (paired t test; p = 0.059).
Figure 3.
Figure 3.
Increased NMDAR sensitivity to PAhPim is dependent on the CTD of the GluN2B subunit. A, Examples of traces obtained from HEK cells expressing GluN1/GluN2B(WT), GluN1(R839X)/GluN2B(R847X), GluN1(R839X)/GluN2B, and GluN1/GluN2B(R847X) receptors. PAhPim (30 μm) was applied in the presence of glutamate (1 μm). Open and filled bars represent the time of PAhPim and glutamate application, respectively. Right, Control (black) and test (red) responses are displayed overlaid and normalized with respect to the current amplitude before the steroid application to show the difference in the steroid inhibitory effect. Left, Diagrams represent the membrane topology and the truncation of the receptor. B, Bar graph represents the relative degree of PAhPim (30 μm) inhibition of the control and the test responses evoked by 1 μm glutamate in WT (black and red horizontal lines, respectively, ± SEM in gray) or in truncated GluN1/GluN2B receptors. Data are mean PAhPim-induced inhibition in % ± SEM. *Statistically significant difference between control versus test responses. §Statistically significant difference between the control response recorded from receptors lacking GluN1 and/or GluN2B CTD versus WT (for details and p values, see Extended Data Table 3-1).
Figure 4.
Figure 4.
A region in the GluN2B CTD adjacent to the M4 helix is critical for controlling NMDAR steroid sensitivity. A, Examples of traces obtained from HEK cells expressing GluN1/GluN2B(E878X) and GluN1/GluN2B(S870X) receptors. PAhPim (30 μm) was applied in the presence of glutamate (1 μm). Open and filled bars represent the duration of steroid and glutamate application, respectively. Right, Control (black) and test (red) responses are displayed overlaid and normalized with respect to the current amplitude before the steroid application to show the difference in the steroid inhibitory effect. B, Bar graph represents the relative degree of PAhPim (30 μm) inhibition of control and test responses to 1 μm glutamate induced in WT (black and red horizontal lines, respectively, ± SEM in gray), or truncated GluN1/GluN2B receptors. Data are mean PAhPim-induced inhibition in % ± SEM. *Statistically significant difference between control versus test responses. §Statistically significant difference between control responses recorded from truncated GluN1/GluN2B receptors versus WT (for details and p values, see Extended Data Table 4-1).
Figure 5.
Figure 5.
Receptors with the GluN2B subunit mutated at palmitoylation sites have increased steroid sensitivity. A, Amino acid sequence of a portion of the M4 helix and the membrane-proximal region of the GluN2B subunit CTD. Yellow represents the membrane region. Gray represents the sites at which the CTD was truncated (labeled below). Red represents palmitoylated cysteines. B, Example of a control and a test response from GluN1/GluN2B(AAA) receptors. PAhPim (30 μm) was applied in the presence of glutamate (1 μm). Open and filled bars represent the duration of steroid and glutamate application, respectively. Right, Control (black) and test (red) responses are displayed overlaid and normalized with respect to the current amplitude before the steroid application to show the difference in the steroid inhibitory effect. C, Bar graph represents the relative degree of PAhPim (30 μm) inhibition of control and test responses to 1 μm glutamate induced in WT (black and red horizontal lines, respectively, ± SEM in gray), or mutated GluN1/GluN2B receptors. Substitutions of cysteine with alanine are marked in parentheses and correspond to substitutions of C849A, C854A, and/or C871A, respectively. Cysteine substitutions were created also in the truncated GluN2B(E878X) subunit; data for GluN1/GluN2B(AAA, E878X) receptors are shown; additional mutations are listed in Extended Data Table 5-1. D, Bar graph represents the relative degree of PAhPim (30 μm) inhibition of control and test responses to 1 μm glutamate in tunicamycin-treated HEK cells. Data are mean steroid inhibition in % ± SEM. Horizontal lines indicate the mean PAhPim inhibition of control (black line ± SEM in gray) and test (red line ± SEM in gray) responses in tunicamycin-untreated cells (same data as shown in C). *Statistically significant difference between control versus test responses. §Statistically significant difference between control responses recorded from mutated GluN1/GluN2B receptors versus WT (for details and p values, see Extended Data Table 5-1).
Figure 6.
Figure 6.
Effects of NMDAR palmitoylation on gating. A, Representative steady-state recordings of continuous single-channel activity in HEK cell-attached patches expressing GluN1/GluN2B(WT) or GluN1/GluN2B(AAA) receptors. Unitary currents (downward deflections) were activated by 1 mm glutamate and 100 μm glycine at a pipette potential of 100 mV (estimated holding potential –130 mV). Data are shown on two different time scales. Open (B,C) and closed (D,E) duration distributions of single GluN1/GluN2B(WT) and GluN1/GluN2B(AAA) receptor channels. Overlaid are probability density functions (thick lines) and individual kinetic components (thin lines). Insets, Calculated time constants (τ (ms)) and areas (A (%)) for each component in a corresponding color code. Summary bar graph represents the relative changes in the duration of open (C) and closed (E) time constants (for the absolute values of the open and closed time constants, see Tables 2 and 3, respectively). *Statistically significant difference between GluN1/GluN2B(AAA) versus WT (p < 0.05; unpaired t test). F, Kinetic models optimized by fits to the entire sequence of closed and open intervals in each record; for each transition, rate constants (in s−1) are given as means: GluN1/GluN2B(WT), n = 10; GluN1/GluN2B(AAA), n = 9. Blue represents rate constants showing a significant increase relative to GluN1/GluN2B(WT). Red represents rate constants showing a significant decrease relative to GluN1/GluN2B(WT). p < 0.05 (paired t test). All states (C, O) represent fully glutamate- and glycine-liganded receptors. G, Macroscopic responses to 10 ms applications of 1 mm glutamate were simulated with the model in F (top, absolute scale; bottom, normalized to the peak amplitude). Rate constants for glutamate binding/unbinding (additional two states before C3) were kb = 6 μm−1·s−1 and ku = 15 s−1 (Amico-Ruvio and Popescu, 2010).
Figure 7.
Figure 7.
Analysis of the effect of low Po on the GluN1/GluN2B receptor sensitivity to PAhPim. A, Examples of currents from GluN1/GluN2B(WT) receptors. PAhPim (30 μm) was applied in the presence of glutamate (0.55 μm). Open and filled bars represent the duration of steroid and glutamate application, respectively. Right, Control (black) and test (red) responses are displayed overlaid and normalized with respect to the current amplitude before the steroid application to show the difference in the steroid inhibitory effect. B, Bar graph represents the inhibitory effect of PAhPim (30 μm) on control and test responses induced by 0.55 μm glutamate in GluN1/GluN2B(WT) receptors and in mutated receptors (GluN1/GluN2B(V821A); GluN1/GluN2B(I664G)) activated by 1 μm glutamate. Data are mean PAhPim-induced inhibition in % ± SEM. Horizontal lines indicate the degree of PAhPim-induced inhibition of control (black) and test (red) responses induced in GluN1/GluN2B(WT) receptors by 1 μm glutamate. Gray areas represent the SEM. *Statistically significant difference between control versus test responses (paired t test) (for details and p values, see Extended Data Table 7-1).
Figure 8.
Figure 8.
In silico analysis of the structural consequences of CTD palmitoylation. A, Typical orientation of palmitoylated cysteine residues (C849 in blue, C854 in green, C871 in red) before (top) and after (bottom) the MD simulation of the palmitoylated M4-E878X CTD segment (orange diagram) in the model membrane shown as lines (carbon in gray, oxygen in red, and nitrogen in blue). The positions of the terminal palmitoyl aliphatic (Pa) carbons (B) and Cα atoms of cysteine residues with (C) or without (D) palmitoylation are shown relative to the membrane thickness. The y coordinates 0.00 and 1.00 represent the relative average position of phosphates of the lower and the upper membrane leaflet, respectively. Value of 0.50 indicates the lipophilic center of the membrane, and values outside of the 0-1 interval indicate the solvent phase. E, F, The projection of the palmitoylated (E) or the nonpalmitoylated (F) M4-E878X CTD segment cysteine residue Cα positions to the membrane plane during the MD simulation. Color shades represent the percentage of simulation time spent in the given locations.
Figure 9.
Figure 9.
PAhPim is neuroprotective against NMDA-induced excitotoxicity. A, Representative images of PI-stained cultures treated with control media, 30 μm PAhPim, 30 μm NMDA, or 30 μm NMDA + 30 μm PAhPim. Scale bar, 50 μm. B, Bar graph represents the percentage of dead neurons counted as the number of PI-positive nuclei normalized to the total number of neuronal nuclei identified from the H staining (see Materials and Methods). *Statistically significant difference between the percentage of dead neurons assessed in NMDA-treated cultures versus cultures treated with NMDA + PAhPim. §Statistically significant difference between the percentage of dead neurons assessed in control media-treated cultures versus cultures treated with different concentrations of NMDA (for details and p values, see Extended Data Table 9-1).
Figure 10.
Figure 10.
Amino acid sequence alignment of the M4 domain and the proximal region of the CTD across rat glutamate receptor subunits. Shown are the NMDA subtype rat GluN subunits, AMPA subtype rat GluA subunits, and kainate subtype rat GluK subunits. The numbering is for the mature protein. The CTDs of all subunits are truncated. The portion of the M4 helix facing intracellularly (yellow) and cysteines (red) are shown.
Figure 11.
Figure 11.
Structural features of NMDAR channel opening. Models of the GluN1/GluN2B receptor TMD (GluN1 in gray, GluN2B in orange) with extracellular segments of the M3 helices represented by the Cα atoms of GluN2B A651, indicated by red spheres, and the intracellular portion of the M4 helices represented by the Cα atoms of GluN2B H840, indicated by green spheres (see A, inset). A, Structural snapshots of the GluN1/GluN2B TMD in gray/orange stick backbone representation (viewed from the extracellular side) with the NMDAR in the nonactivated state with the channel closed (Closed, left) and activated with the channel open (Open, right). The snapshots were selected from an aggregate of nearly 1 µs of unbiased all-atom implicit membrane and solvent MD simulations of the structural transition from the closed to the open state of the NMDAR (for details, see Cerny et al., 2019). Both structures were aligned with respect to the ATD and the LBD and are shown separately for display purposes. Right, Empty green circles represent the position of the GluN2B H840 residue ensemble in the corresponding closed state. Dashed line with arrowhead indicates the movement of the M4 helices during the opening transition. B, Structural snapshots of the TMD (viewed from the extracellular side) with the NMDAR in the nonactivated state with the channel closed (Closed, left) and activated with the channel open (Open, right). Both structures were aligned with respect to the GluN2B M4 helices and are shown separately for display purposes. Right, Empty red circles represent the position of the GluN2B A651 residue ensemble in the corresponding closed state. Dashed line with arrowhead indicates the movement of the M3 helices during the opening transition.

References

    1. Abraham MJ, Murtola T, Schulz R, Pall S, Smith JC, Hess B, Lindahl E (2015) GROMACS: high performance molecular simulations through multi-level parallelism from laptops to supercomputers. SoftwareX 1:19–25. 10.1016/j.softx.2015.06.001 - DOI
    1. Adla SK, Slavikova B, Smidkova M, Tloustova E, Svoboda M, Vyklicky V, Krausova B, Hubalkova P, Nekardova M, Holubova K, Vales K, Budesinsky M, Vyklicky L, Chodounska H, Kudova E (2017) Physicochemical and biological properties of novel amide-based steroidal inhibitors of NMDA receptors. Steroids 117:52–61. 10.1016/j.steroids.2016.08.010 - DOI - PubMed
    1. Amico-Ruvio SA, Popescu GK (2010) Stationary gating of GluN1/GluN2B receptors in intact membrane patches. Biophys J 98:1160–1169. 10.1016/j.bpj.2009.12.4276 - DOI - PMC - PubMed
    1. Banke TG, Traynelis SF (2003) Activation of NR1/NR2B NMDA receptors. Nat Neurosci 6:144–152. 10.1038/nn1000 - DOI - PubMed
    1. Borovska J, Vyklicky V, Stastna E, Kapras V, Slavikova B, Horak M, Chodounska H, Vyklicky L Jr (2012) Access of inhibitory neurosteroids to the NMDA receptor. Br J Pharmacol 166:1069–1083. 10.1111/j.1476-5381.2011.01816.x - DOI - PMC - PubMed

Publication types

Substances

LinkOut - more resources