. 2021 Apr 15;81(8):2071-2085.
doi: 10.1158/0008-5472.CAN-19-1668. Epub 2021 Feb 1.

Targeting Pan-ETS Factors Inhibits Melanoma Progression

Affiliations

Targeting Pan-ETS Factors Inhibits Melanoma Progression

Lee Huang et al. Cancer Res. .

Abstract

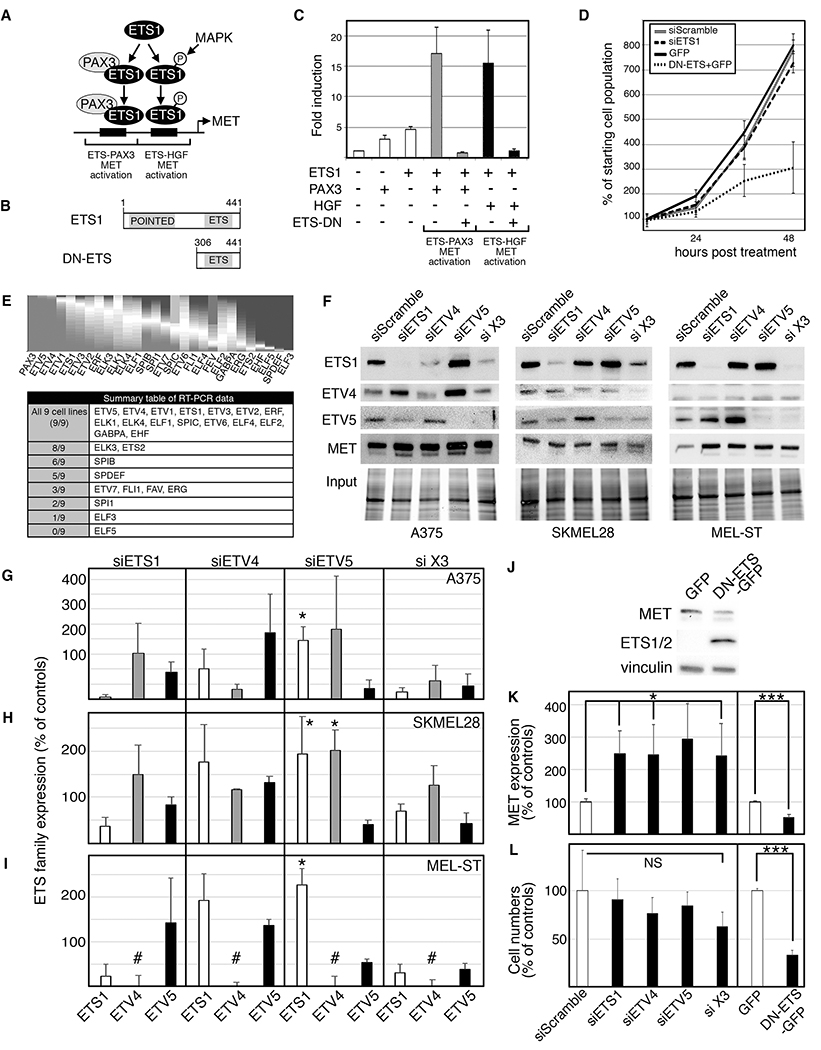
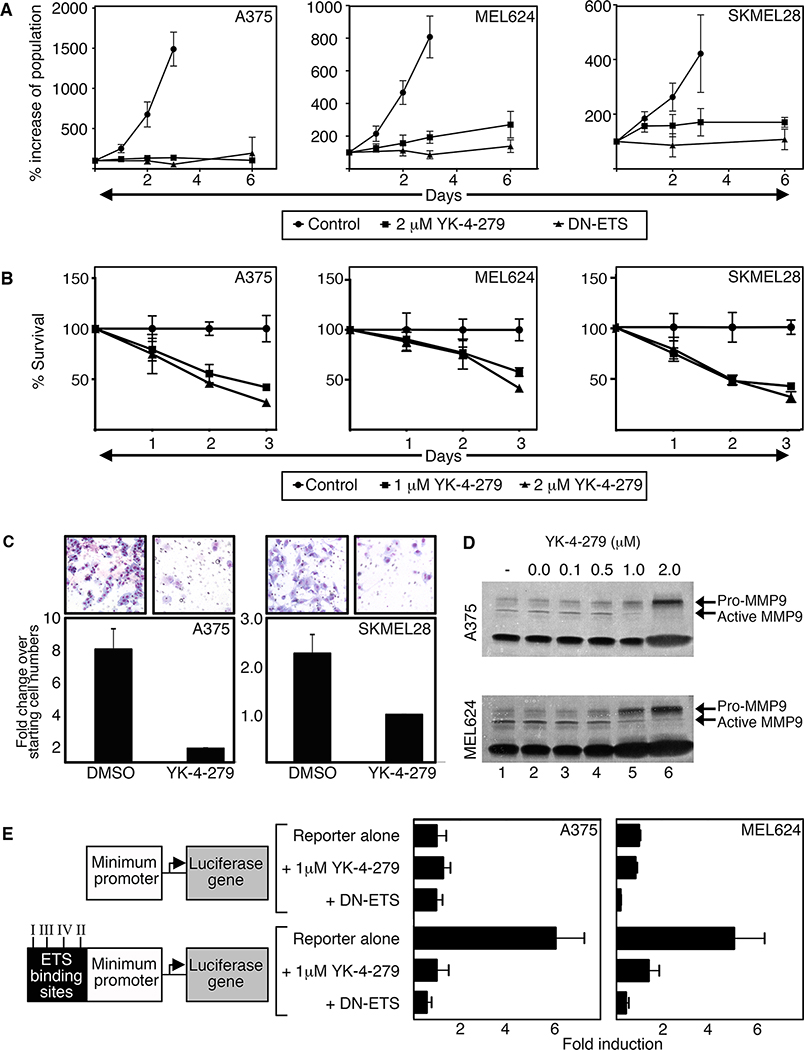
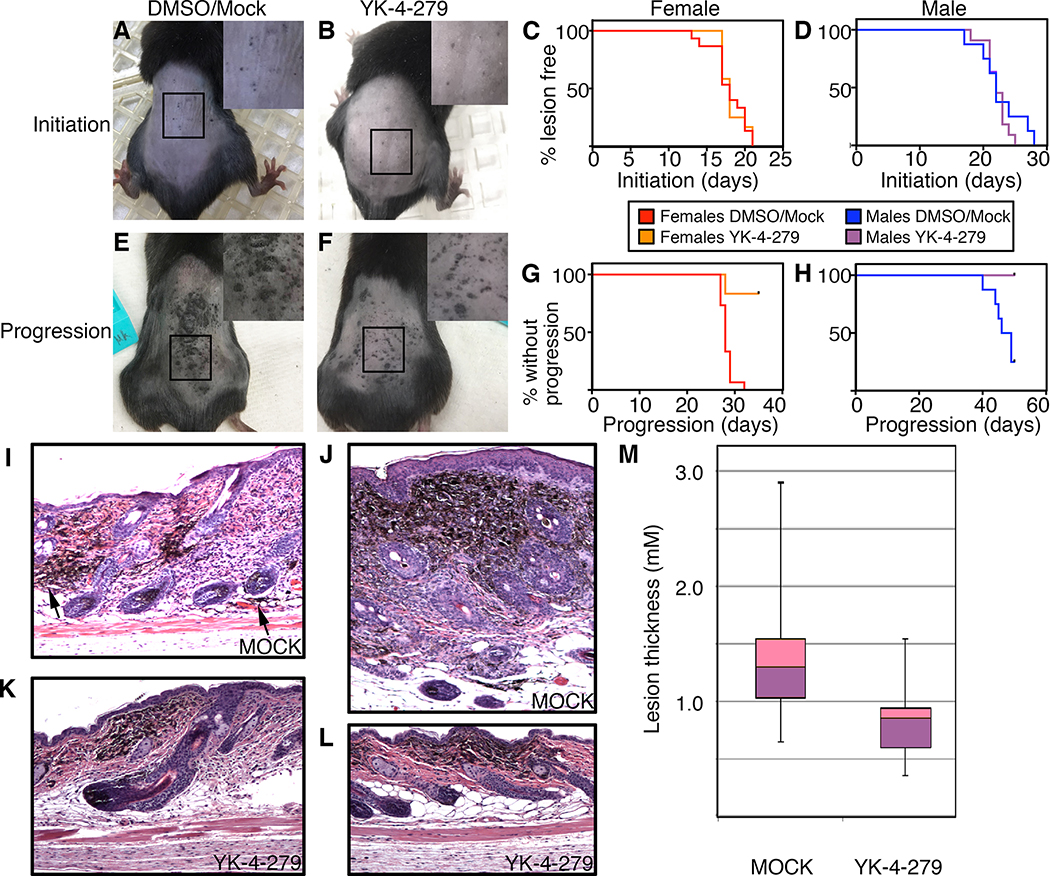
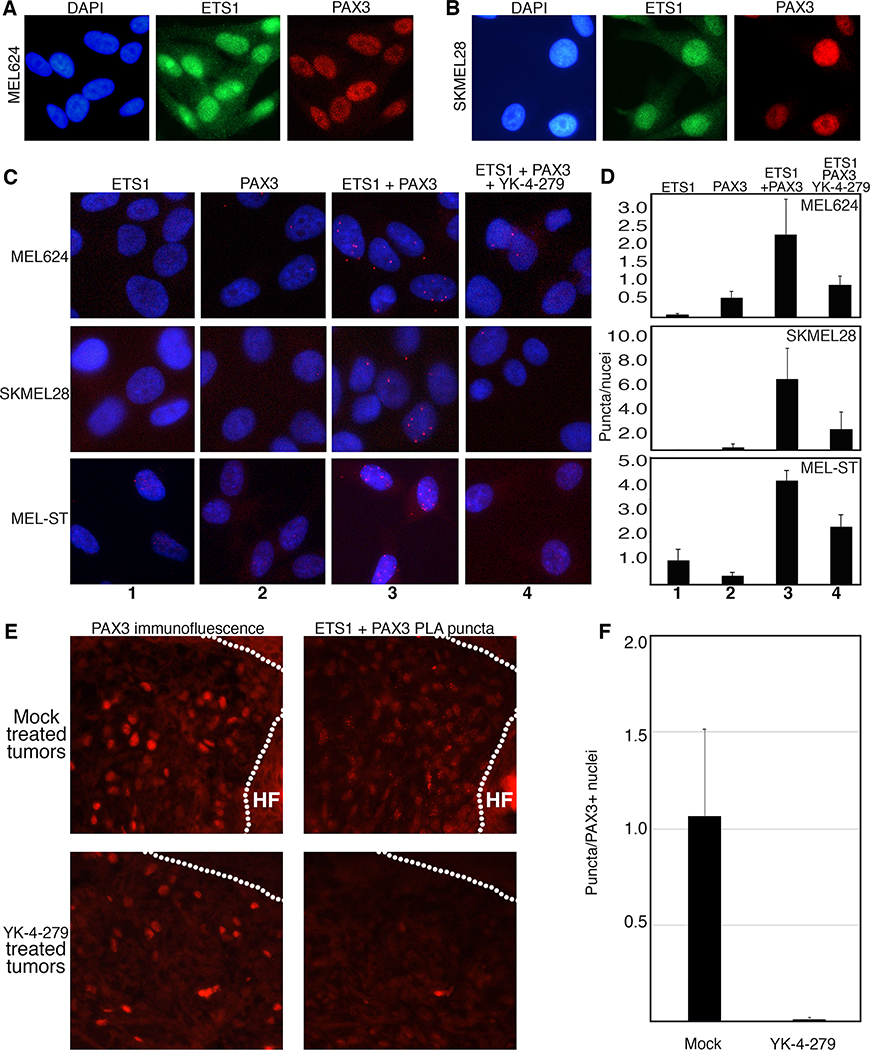
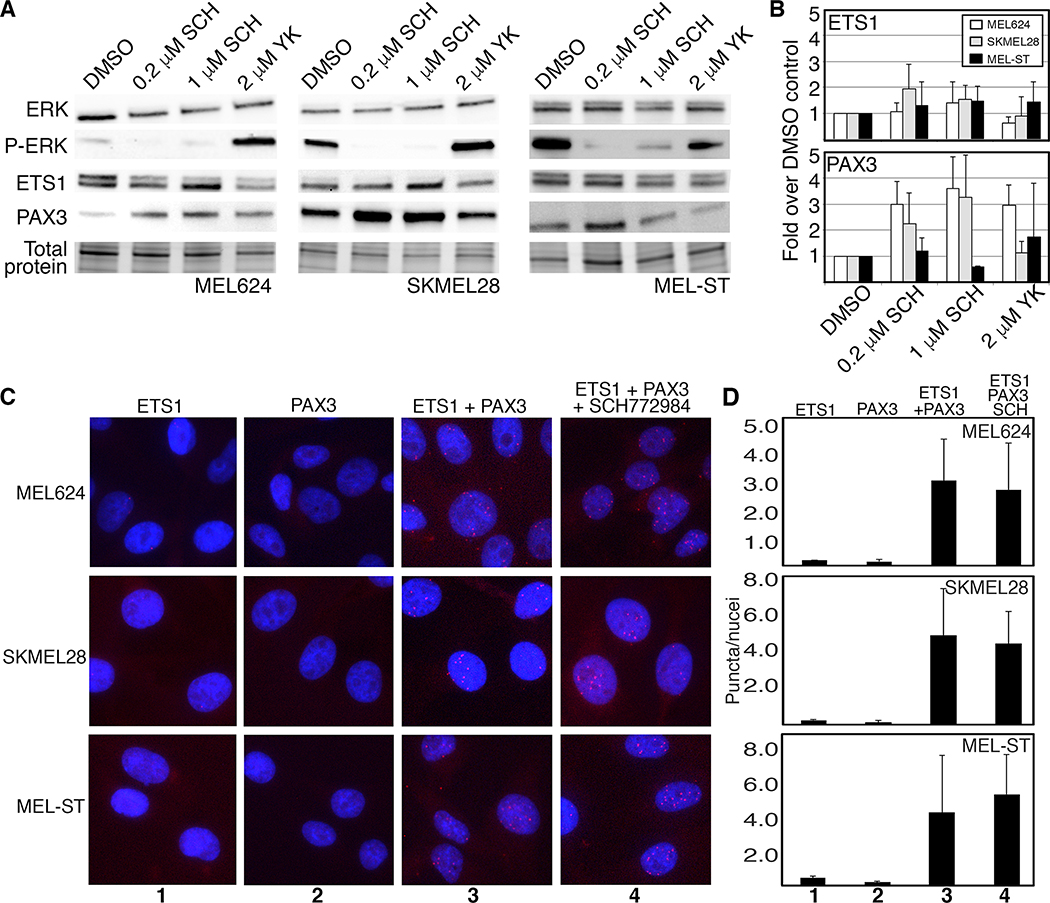
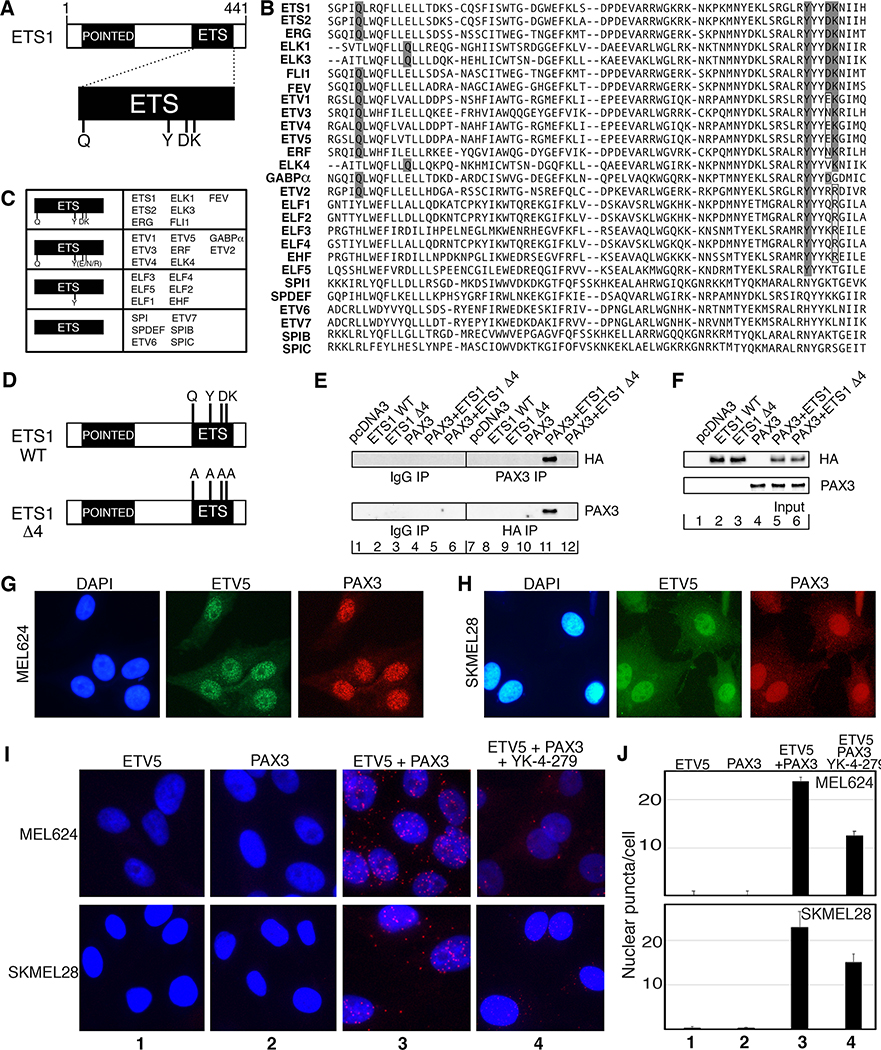
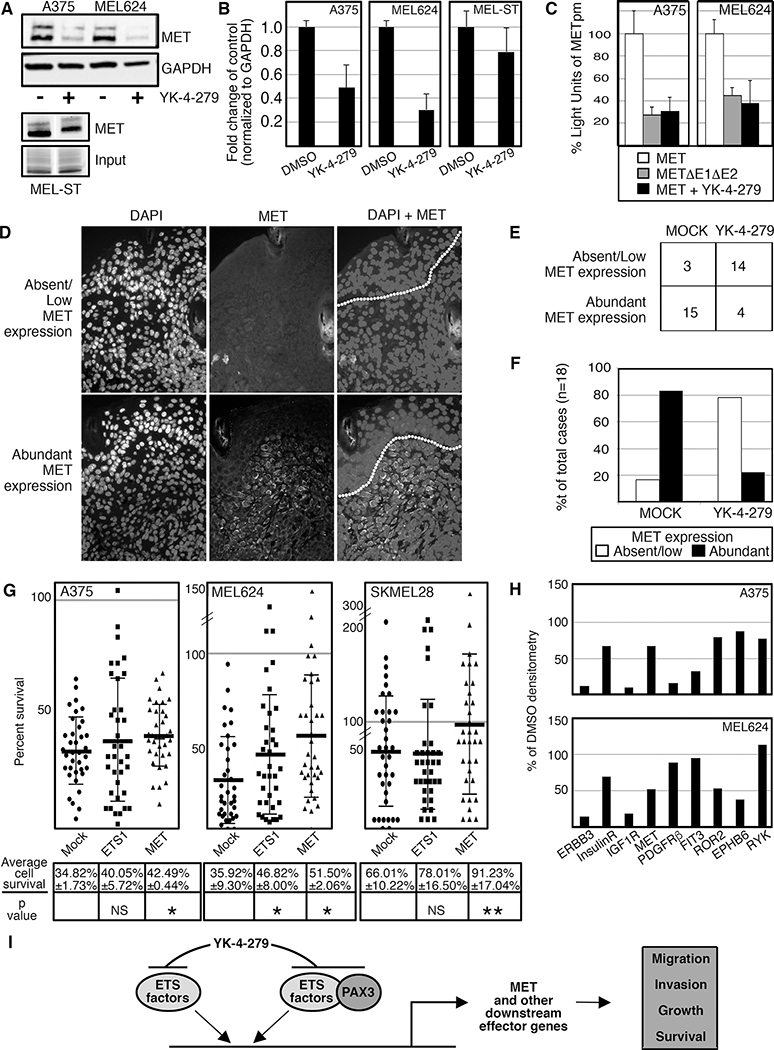
The failure of once promising target-specific therapeutic strategies often arises from redundancies in gene expression pathways. Even with new melanoma treatments, many patients are not responsive or develop resistance, leading to disease progression in terms of growth and metastasis. We previously discovered that the transcription factors ETS1 and PAX3 drive melanoma growth and metastasis by promoting the expression of the MET receptor. Here, we find that there are multiple ETS family members expressed in melanoma and that these factors have redundant functions. The small molecule YK-4-279, initially developed to target the ETS gene-containing translocation product EWS-FLI1, significantly inhibited cellular growth, invasion, and ETS factor function in melanoma cell lines and a clinically relevant transgenic mouse model, BrafCA;Tyr-CreERT2;Ptenf/f. One of the antitumor effects of YK-4-279 in melanoma is achieved via interference of multiple ETS family members with PAX3 and the expression of the PAX3-ETS downstream gene MET. Expression of exogenous MET provided partial rescue of the effects of YK-4-279, further supporting that MET loss is a significant contributor to the antitumor effects of the drug. This is the first study identifying multiple overlapping functions of the ETS family promoting melanoma. In addition, targeting all factors, rather than individual members, demonstrated impactful deleterious consequences in melanoma progression. Given that multiple ETS factors are known to have oncogenic functions in other malignancies, these findings have a high therapeutic impact. SIGNIFICANCE: These findings identify YK-4-279 as a promising therapeutic agent against melanoma by targeting multiple ETS family members and blocking their ability to act as transcription factors.


Conflict of interest statement

Conflict of interest statement: The authors have declared that no conflict of interest exists.

Figures

Figure 1
Figure 1
A dominant-negative ETS protein inhibits growth and expression of MET in melanoma cells. A. A schematic of dual ETS1 regulation of the MET promoter. ETS1 (with PAX3) drives MET gene expression through an ETS-PAX binding site, and a phosphorylated ETS1 protein promotes MET expression through a PAX-independent mechanism and a separate “ETS-HGF” binding site. B. A diagram of a full-length ETS1 protein with both Pointed and ETS domains, and a dominant-negative ETS1 (DN-ETS) containing only the ETS domain. C. DN-ETS inhibits ETS1 activation of the MET promoter through both PAX3- and HGF-dependent synergistic mechanisms. Luciferase assays of 293T cells transfected with a MET promoter luciferase reporter construct (METpm) in the absence (−) or presence (+) of ETS1 expression with or without PAX3, DN-ETS and/or HGF. Data are presented as fold induction over light units of METpm alone. D. Expression of DN-ETS, but not siETS1, significantly attenuates melanoma growth. A375 cells are transfected with ETS1 siRNA, siScramble control, or DN-ETS or GFP expression constructs, and counted over a time-course. E. Multiple ETS family members are commonly and variably expressed in human melanoma samples and melanoma cell lines. A gene expression profile heatmap of PAX3 and ETS family members using RNASeq data from 473 melanoma patients was created utilizing the UCSC Cancer Genomics Browser (top panel). The data are depicted as a proportions plot with higher expression (grey shading from bottom) and lower expression (dark grey shading from top) in melanoma compared to other cancer subtypes. In addition, multiple ETS family members are expressed in the panel of nine melanoma cell lines (summary table of RT-PCR screen shown in table). F-I. Inhibition of ETS factors influences the expression of other family members in A375 and SKMEL28 melanoma cells, and MEL-ST melanocyte cells. The data represent inhibition with siETS1, siETV4, siETV5, or all three (si X3) as indicated on column top, and bars (in G-I) represent western blot densitometry for ETS1 (white bars), ETV4 (grey), or ETV5 (black) as indicated on column bottom. The Y-axis is densitometry readings normalized to siScramble controls (set at 100%). Data shown are western analysis from three independent experiments. (∗=p≤0.05, #=no detectable expression of ETV4 in MEL-ST cells). J. Expression of a dominant negative ETS protein (DN-ETS-GFP) decreased MET expression in A375 cells, when compared to mock transfected cells (GFP). K. MET expression is increased when ETS family members are inhibited and decreased with expression of DN-ETS-GFP in A375 cells. Densitometry of three independent western analyses show a significant change in MET expression (representative western blots shown in F,J), ∗=p≤0.05, ∗∗∗=p≤0.0005. L. Inhibition of ETS family members with DN-ETS-GFP significantly attenuated cell numbers but ETS-specific siRNA did not. Cell counts of three independent experiments at 48 hours post treatment were normalized to control groups (siScramble or GFP), which were set at 100% (∗∗∗=p≤0.0005).
Figure 2.
Figure 2.
YK-4–279 inhibits melanoma cell growth, invasion, and ETS activity. A. YK-4–279 and DN-ETS comparably reduce cell growth. Melanoma cells were transfected with DN-ETS-GFP or treated with 2μM YK-4–279 and cell numbers quantified on days 0,1,2,3, and 6. B. YK-4–279 inhibits melanoma cell proliferation and survival. Cells were treated with 1μM or 2μM YK-4–279. MTT assays were used to assess cell survival compared to respective untreated controls. C. YK-4–279 inhibits melanoma cell invasion. Cells were seeded onto collagen-coated transwells and treated with either DMSO or YK-2–479. Cell invasion was examined 16h post drug treatment. DMSO cells migrated at rates 7.84±1.43 (A375) or 2.27±0.38 (SKMEL28) fold more than cells treated with YK-4–279. D. YK-4–279 inhibits MMP9 activation in a dose dependent manner. Media from cells treated with (0.1–2.0μM, lanes 3–6) or without (untreated or DMSO alone, lanes 1,2) YK-4–279 for 7 days were collected, concentrated, and run on a gelatin gel to examine MMP2/9 activity. E. YK-4–279 inhibits ETS transcriptional activity. Cells were transfected with a reporter construct containing a minimal promoter without (top three bars) or with (bottom three bars) the addition of a 60 base-pair sequence containing four different ETS binding sites. With minimum promoter without ETS sites serving as control (first top bar, 1 fold), the reporter with ETS sites produced 6.10±1.24 (A375, p<0.001) or 5.12±1.34 (MEL624, p<0.01) fold more light units than control levels. Luciferase activity was reduced to base levels with DN-ETS or drug.
Figure 3.
Figure 3.
YK-4–279 attenuates melanoma progression in a mouse model of melanoma. The melanoma model, BrafCA;Tyr-CreERT2;Ptenf/f, was transplanted with osmotic pumps containing DMSO alone or 1.12 mM YK-4–279 total/final concentration that released a constant level of 1.6 mg/Kg of drug. A,B. Photographs of control (A) and drug (B) group mice with initiation lesions, with magnification (2X) in insets. C,D. Kaplan-Meier survival graphs of initiation in female (C) and male (D) experimental and control matched groups. There were no significant differences between curves (p=0.45). E,F. Photographs of control (E) and drug (F) group mice with progressed tumors, with magnification (2X) in insets. G,H. YK-4–279 treatment attenuates tumor progression. There were significant differences between Kaplan-Meir curves (p<0.0001 females, p=0.004 males). I-L. Cutaneous pigmented lesions of mock treated mice (I,J) were full thickness tumors, while lesions in YK-4–279 treated mice (K,L) were superficial. In mock treated skin, even relatively flat lesions have cells invading into the subdermis (I, arrowheads). The more typical mock treated lesion is thick (>1mm, J). Sections shown are either parallel to the anterior-posterior axis (I,K,L) or transverse section (J). M. Mock treated mice have thicker pigmented lesions than YK-4–279 treated mice. In the measurement of the thickest lesion per slide, lesions were 1.37±0.55 mm and 0.82±0.32 mm for mock and drug treated mice, respectively (p=0.00098, n=16 mice/group). Each box represents the upper and lower quartile with a line at the median, whisker lines extend from maximum to minimum thicknesses, unpaired 2-tailed t test.
Figure 4.
Figure 4.
YK-4–279 inhibits ETS1 and PAX3 interaction in melanoma cells. A,B. ETS1 and PAX3 are expressed in MEL624 (A) and SKMEL28 (B) cells by immunofluorescence. C,D. ETS1 and PAX3 interact in situ in melanoma cells but this complex is inhibited by YK-4–279. ETS1 and PAX3 antibody alone did not result in significant number of puncta generated through proximity ligase assay (PLA) (columns (C) or bars (D) 1 and 2). Significant PLA puncta were produced with both antibodies (columns 3), 2.3±1.00 (MEL624), 6.26±2.82 (SKMEL28) and 4.33±0.41 (MEL-ST) puncta/nuclei. YK-4–279 significantly reduced the number to 0.9±0.25 (MEL624), 2.26±1.3 (SKMEL28) and 1.33±0.59 (MEL-ST) puncta/nuclei, (columns 4, all p<0.05). E,F. ETS1 and PAX3 interact in mouse melanoma tumors and this complex was inhibited after YK-4–279 treatment. For each sample on sequential sections, tumor cells were identified by PAX3 immunofluorescence, and PAX3-ETS1 interaction was detected by PLA puncta (E). ETS1-PAX3 PLA puncta were reduced in melanoma tissue from 1.06±0.45 puncta/PAX3 expressing nuclei in tumors of mock treated mice to 0.010±0.008 in YK-4–279 mice (error expressed as SEM) with the number of puncta normalized to PAX3 positive expressing nuclei in the sample (p=0.0008 2-tailed t-test, graphed data in F).
Figure 5.
Figure 5.
ERK inhibition, via SCH772984 treatment, had little to no effect on PAX3 and ETS1 interaction in melanoma cells. A,B. ERK inhibition had minimal effect on ETS1 protein levels, but increased PAX3 in melanoma cells. PAX3 levels rose 3.61±1.19 fold over control levels (MEL624), and 3.27±1.61 fold (SKMEL28), both p=0.01 for 1μM SCH772984. C,D. Treatment with 2μM SCH772984 did not reduce PAX3-ETS1 interactions in melanoma cells. Number of PLA puncta per nuclei between DMSO and SCH772984 treated cells were not significantly different between groups for all cell lines tested.
Figure 6.
Figure 6.
PAX3 binds to ETS1 through four epitopes that are similar in some but not all ETS factors including ETV5. A. ETS1 contains four previously identified epitopes within the ETS DNA binding domain (31) that interact with PAX proteins, Q336, Y395, D398 and K399. B. Amino acid sequences of ETS family ETS DNA domains, with PAX-interacting epitopes highlighted. C. Summary chart of sequences from (B), with ETS family members with all four epitopes the same (first group) or similar (second group), with only Y395 (third group), or without any shared epitopes (fourth group). D. Schematic of wild type (ETS1 WT) and mutant ETS1 with four PAX3 interacting epitopes changed to alanines (ETS1 Δ4). E. 293T cells were transfected with PAX3 and/or ETS1-WT or ETS1-Δ4 expression constructs or empty vector, and cell lysates were immunoprecipitated with anti-HA or anti-PAX3 antibodies (lanes 7–12) or control antibodies (lanes 1–6). Immunoprecipitants were probed by western analysis for ETS1 (anti-HA, top) or PAX3 (anti-PAX3, bottom). F. Input control samples for experiments shown in (E). Input proteins were probed for ETS1 (anti-HA, top) or PAX3 (anti-PAX3, bottom). G,H. ETV5 and PAX3 are expressed in MEL624 (G) and SKMEL28 (H) cells by immunofluorescence. I,J. ETV5 and PAX3 interact in melanoma cells but this complex was inhibited with YK-4–279. ETV5 and PAX3 antibody alone do not result in significant number of puncta generation (columns (I) or bars (J) 1 and 2). Significant PLA puncta were produced with both antibodies (columns 3), 23.69±4.71 (MEL624) and 22.93±3.62 (SKMEL28) puncta/nuclei. YK-4–279 significantly reduced the number of puncta (columns 4), 12.5±2.78 (MEL624, p=0.0031) and 15.01±1.93 (SKMEL28, p=0.050) puncta/nuclei.
Figure 7.
Figure 7.
YK-4–279 reduces MET expression in cellulo and in vivo. A,B. YK-4–279 reduces MET expression in melanoma cells by western analysis (A) with densitometry readings of three independent western blots (B). There was significant MET reduction with YK-4–279 treatment, 0.49±0.17 fold (A375, p=0.044) and 0.30±0.13 fold (MEL624, p=0.011). C. Both enhancer mutation and YK-4–279 reduce MET promoter activity in melanoma cells. A MET reporter vector containing two ETS binding sites (shown schematically in Figure 1A) expression was reduced if the ETS sites are mutated (27.62 ±8.82%, A375, 44.76±6.13% MEL624) or in the presence of YK-4–279 (30.40±13.20, A375, 37.80±22.5%, MEL624). All reductions of luciferase activity were significant, p<0.005. D. MET expression in BrafCA;Tyr-CreERT2;Ptenf/f mouse tumor lesions. Immunofluorescence of nuclei (DAPI, first column), MET (middle column), and combined DAPI/MET (last column, dotted line indicating epithelial/dermal junction). Top row is an example of a lesion with low or absent MET expression, bottom row a lesion with abundant (>10% cells positive) MET. E. Summary of anonymized scoring of MET expression in BrafCA;Tyr-CreERT2;Ptenf/f mouse tumors. Tumors from DMSO (MOCK, first column) or drug (YK-4–279, second column) treated mice are scored for absent/low expression of MET (top row) or abundant (>10%, bottom row), n=18 for each group. F. Graph of data from (E). Mock treated lesions expressed abundant MET (15/18 samples, 83.3%) while YK-4–279 lesions were predominantly MET low or absent with only 4/18 with abundant MET expression (22.2%). The correlation of MET expression between drug versus mock treated groups was significant (p=0.00018, >85% power). G. Transfection of ETS1 and MET partially rescues YK-4–279 cell loss (ETS1 in MEL624, MET in all three lines) in melanoma cell lines. Percent survival after 48h of YK-4–279 treatment for each group (mock, ETS1, MET, x-axis) is shown from representative experiments from cell lines A375, MEL624, and SKMEL28, with the average of three independent experiments shown below each column with significant differences between mock and transfected groups determined by ANOVA (p values as shown, NS=not significant, *=p<0.05, **=p<0.005). Differences in cell numbers between YK-4–279 and DMSO cells are compared within transfected groups (mock, ETS1, MET) to determine percent survival (y-axis). The grey line indicates 100% of DMSO treated cell numbers, or levels for a complete rescue from YK-4–279 treatment. For each experiment, at least 400 cells were counted/group. H. Densitometry from Phospho-RTK (receptor tyrosine kinase) array from mock and 2μM YK-4–279 treated A375 and MEL624 melanoma cells. Representative arrays are shown in Supplementary Figure S3A–C. RTKs with differential densitometry between groups for at least one cell line is graphed where the genes are listed on the X-axis and percent of DMSO controls is indicated on the Y-axis, with DMSO levels set at 100%. I. Simplified schematic of the molecular pathways affected by YK-4–279 treatment on melanoma cells. The drug inhibits ETS1 and other ETS factors and blocks ETS domain function and binding to protein partners such as PAX3. This leads to an attenuation of ETS-dependent activation of downstream effector genes such as MET, and a decrease in pro-tumor function including migration and invasion.

References

    1. Czyz M HGF/c-MET Signaling in Melanocytes and Melanoma. Int J Mol Sci. 2018;19(12). - PMC - PubMed
    1. Kubic JD, Little EC, Lui JW, Iizuka T, and Lang D. PAX3 and ETS1 synergistically activate MET expression in melanoma cells. Oncogene. 2015;34(38):4964–74. - PMC - PubMed
    1. Keehn CA, Smoller BR, and Morgan MB. Expression of the ets-1 proto-oncogene in melanocytic lesions. Mod Pathol. 2003;16(8):772–7. - PubMed
    1. Rothhammer T, Hahne JC, Florin A, Poser I, Soncin F, Wernert N, et al. The Ets-1 transcription factor is involved in the development and invasion of malignant melanoma. Cell Mol Life Sci. 2004;61(1):118–28. - PMC - PubMed
    1. Potu H, Peterson LF, Kandarpa M, Pal A, Sun H, Durham A, et al. Usp9x regulates Ets-1 ubiquitination and stability to control NRAS expression and tumorigenicity in melanoma. Nature communications. 2017;8:14449. - PMC - PubMed

Publication types

MeSH terms