. 2021 Jun 15;81(12):3255-3269.
doi: 10.1158/0008-5472.CAN-20-3892. Epub 2021 Feb 1.

Induction of ADAM10 by Radiation Therapy Drives Fibrosis, Resistance, and Epithelial-to-Mesenchyal Transition in Pancreatic Cancer

Affiliations

Induction of ADAM10 by Radiation Therapy Drives Fibrosis, Resistance, and Epithelial-to-Mesenchyal Transition in Pancreatic Cancer

Adam C Mueller et al. Cancer Res. .

Abstract

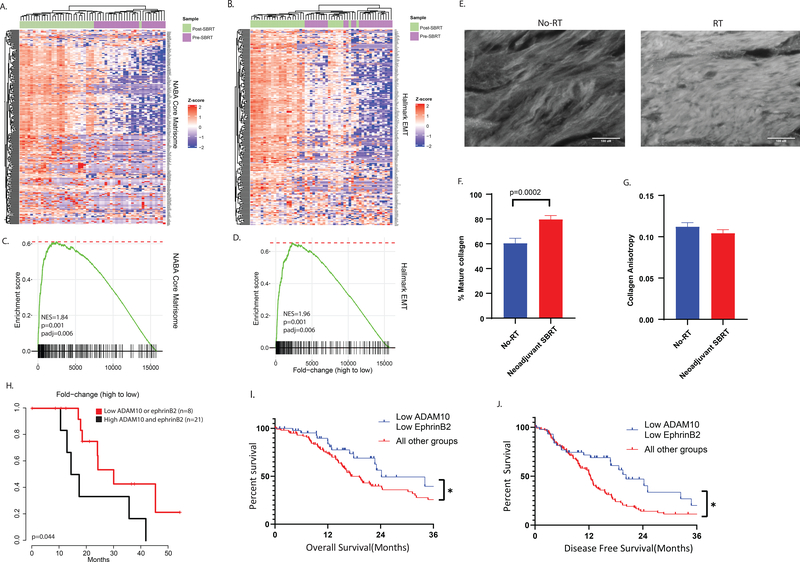
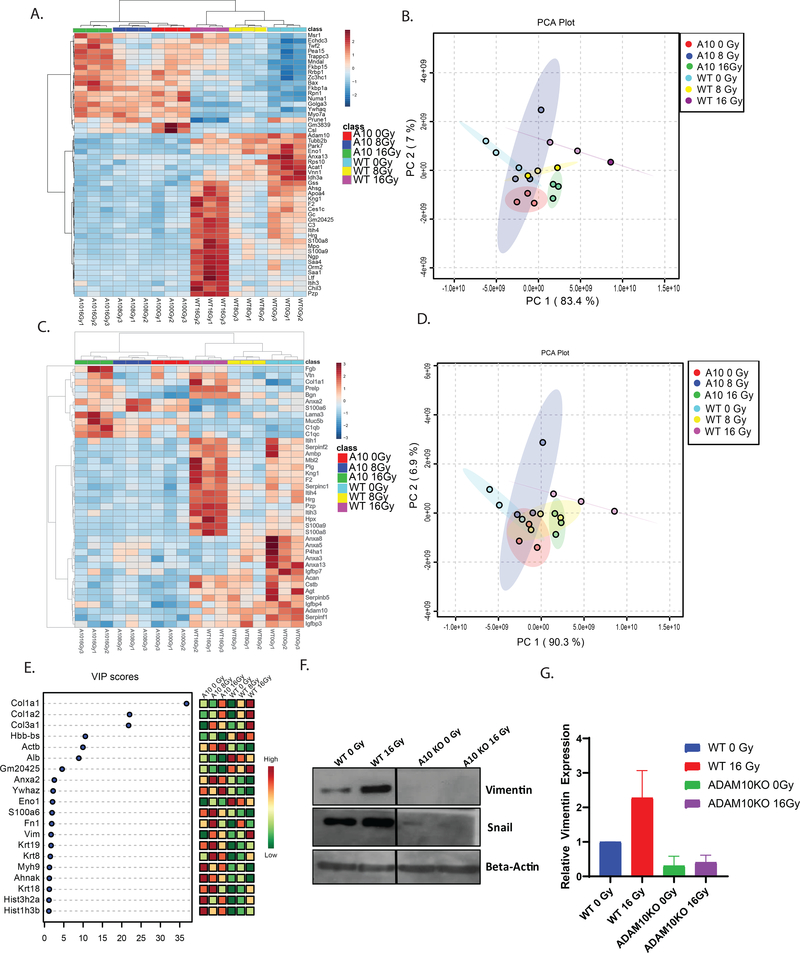
Stromal fibrosis activates prosurvival and proepithelial-to-mesenchymal transition (EMT) pathways in pancreatic ductal adenocarcinoma (PDAC). In patient tumors treated with neoadjuvant stereotactic body radiation therapy (SBRT), we found upregulation of fibrosis, extracellular matrix (ECM), and EMT gene signatures, which can drive therapeutic resistance and tumor invasion. Molecular, functional, and translational analysis identified two cell-surface proteins, a disintegrin and metalloprotease 10 (ADAM10) and ephrinB2, as drivers of fibrosis and tumor progression after radiation therapy (RT). RT resulted in increased ADAM10 expression in tumor cells, leading to cleavage of ephrinB2, which was also detected in plasma. Pharmacologic or genetic targeting of ADAM10 decreased RT-induced fibrosis and tissue tension, tumor cell migration, and invasion, sensitizing orthotopic tumors to radiation killing and prolonging mouse survival. Inhibition of ADAM10 and genetic ablation of ephrinB2 in fibroblasts reduced the metastatic potential of tumor cells after RT. Stimulation of tumor cells with ephrinB2 FC protein reversed the reduction in tumor cell invasion with ADAM10 ablation. These findings represent a model of PDAC adaptation that explains resistance and metastasis after RT and identifies a targetable pathway to enhance RT efficacy. SIGNIFICANCE: Targeting a previously unidentified adaptive resistance mechanism to radiation therapy in PDAC tumors in combination with radiation therapy could increase survival of the 40% of PDAC patients with locally advanced disease.See related commentary by Garcia Garcia et al., p. 3158 GRAPHICAL ABSTRACT: http://cancerres.aacrjournals.org/content/canres/81/12/3255/F1.large.jpg.


Conflict of interest statement

Conflict of Interest Statements

Dr. Karam receives clinical trial research funding unrelated to this work from AstraZeneca.

Figures

Figure 1:
Figure 1:. Neoadjuvant SBRT induces gene expression changes consistent with activated matrisome, EMT in BRPC, and ADAM10 and ephrinB2 together are predictive of survival.
RNA sequencing gene expression in human biopsy and tumor samples treated with neoadjuvant SBRT before surgical resection. Heatmaps were generated with A. Z-score transformed gene expression and B. GSEA was performed using the Hallmark EMT gene set. C. Z-score transformed gene expression and D. GSEA was performed using the Core Matrisome gene set. Purple represents pre-SBRT samples, and green represents post-SBRT samples. The genes are ordered by the fold-change of post-SBRT samples compared to pre-SBRT. E. Representative immunofluorescence images of picrosirius stained tumor slides from patients with PDAC, either treated with surgical resection without RT(left), or with neoadjuvant SBRT followed by surgical resection(right). F. Quantification of area per slide positive for collagen staining in no-RT(blue) and neoadjuvant SBRT(red) samples. 5 patients per group, >10 fields of view collected per patient. P-value calculated with Students T-Test. G. Quantification of collagen anisotropy in no-RT(blue) and neoadjuvant SBRT(red) samples. 5 patients per group, >10 fields of view collected per patient, 4 regions of interest per FOV. H. Kaplan-Meyer analysis of overall patient survival stratified by expression of ADAM10 and EFNB2, black curve represents patients with post-neoadjuvant tumors with high expression of both ADAM10 and EFNB2, red curve represents patients with low expression of either. NES, normalized enrichment score. I. Kaplan-Meyer analysis of OS of 147 TCGA patients with PDAC stratified by above or below median expression of ADAM10 and EFNB2 shows that patients with below median expression of ADAM10 and EFNB2 have a positive prognosis compared to above median expression of either gene product. J. Kaplan-Meyer analysis of DFS of 147 TCGA patients with PDAC stratified by above or below median expression of ADAM10 and EFNB2 shows that patients with below median expression of ADAM10 and EFNB2 have a positive prognosis compared to above median expression of either gene product. P-values calculated by Mantel-Cox test.
Figure 2:
Figure 2:. ADAM10 upregulation leads to ephrinB2 cleavage, fibrosis, tumor survival after RT in PDAC tumors.
A. VECTRA multiplexed immunohistochemistry analysis of human PDAC tissue samples. Top panel shows false color reconstruction of individual immunostains. ADAM10 is shown in green, ephrinB2 in cyan, EPHB4 in yellow, a-SMA in white, CD-31 in orange, Vimentin in magenta, bottom panel shows true color immunofluorescence image before unmixing. B. Western blotting for ADAM10 in KPC cells 7 days following treatment with increasing doses of ionizing radiation as shown. B-actin shown as loading control. C. quantitation of b. D. Schema for orthotopic pancreatic implantation and in vivo irradiation of KPC derived tumors in immunologically intact syngeneic mice, Created with BioRender.com. E. western blotting of ADAM10 and ephrinB2 from WT and ADAM10 knockout orthotopic tumors 2 weeks following treatment with increasing doses of RT. F. quantitation of ADAM10 from e. G. Representative immunofluorescence images of picrosirius stained tumor slides from WT and ADAM10 KO orthotopic tumors treated with 0 or 16Gy RT. H. Quantification of area per slide positive for collagen staining in WT 0Gy (blue), WT16Gy(red), ADAM10KO 0Gy(green) and ADAM10 KO 16Gy(purple) samples. 5 patients per group, >10 fields of view collected per patient. P-value calculated with Students T-Test. I. Quantification of collagen anisotropy in no-RT(blue) and neoadjuvant SBRT(red) samples. 5 patients per group, >10 fields of view collected per patient, 4 regions of interest per FOV. J. Volume and K. Mass of orthotopic tumors collected at sacrifice 2 weeks following treatment with RT as per schema in d. WT 0Gy(blue), WT 16gy, ADAM10 KO 0Gy (green), ADAM10 KO 16gy(purple). L. Volume and M. mass of PK5L1940 tumors implanted and treated as per schema in d. treated with either vehicle or ADAM10 inhibitor GI254023x every 72 hours prior to sacrifice, starting at time of RT. p values calculated by student’s T-test. ≥5 mice per group. N. Schema for survival analysis of mice implanted with WT or ADAM10 KO tumors followed by in vivo irradiation, Created with BioRender.com. O. Kaplan-Meyer survival analysis of mice with orthotopic pancreatic implantation of WT or ADAM10 KO PK5L1940 cells followed by in vivo irradiation with 0 or 16Gy RT. Groups are WT 0Gy(black), WT 16Gy (red), ADAM10 KO 0Gy (blue), ADAM10 KO 16Gy(red). ≥10 mice per group. P-values calculated by Mantel-Cox test. *indicates P<0.05, **<0.02.
Figure 3:
Figure 3:. RT induces activated matrisome and stromal fibrosis proteins in ADAM10 dependent manner.
A. Clustering analysis of matrisome proteins detected by mass spectrometry in mouse flank KPC tumors treated with 0, 8, 16Gy RT (cyan:WT 0Gy, yellow:WT 8Gy, magenta:16Gy, red:ADAM10KO 0Gy, blue:ADAM10KO 8Gy, red:ADAM10KO 16Gy). B. Principle component analysis(PCA) of most highly differentially regulated genes from analysis in panel a. C. Clustering analysis of 50 most highly regulated proteins detected by compartment resolved mass spectrometry in mouse flank KPC tumors treated with 0, 8, 16Gy RT (cyan:WT 0Gy, yellow:WT 8Gy, magenta:16Gy, red:ADAM10KO 0Gy, blue:ADAM10KO 8Gy, red:ADAM10KO 16Gy) D. PCA of matrisome proteins from analysis in panel c. E. Variable importance in projection (VIP) scores from partial least square (PLS) analysis of mass spectrometry of mouse flank tumors treated as in panel a. F. Western blotting for EMT markers in WT or ADAM10 KO tumors 2 weeks following treatment with 0 or 16Gy RT. G. Quantitation of vimentin in f n=3.
Figure 4.
Figure 4.. ADAM10 KO reduces PDAC tissue stiffness after RT, as well as migratory and invasive capacity of KPC cells.
A. Representative images of stiffness maps from atomic force microscopy of WT and ADAM10 knockout tumors treated with 0 or 16Gy RT B. Comparison of frequency of Young’s Modulus measurements between 0Gy and 16Gy treated WT KPC tumors. C. Comparison of frequency of Young’s Modulus measurements between WT and ADAM10 KO tumors treated with 16Gy RT. D. Comparison of mean Young’s Modulus between groups. E. MTT assay of WT and ADAM10 PK5L1940 cells. F. Wound healing in WT and ADAM10 KO PK5L1940 KPC cells. Y axis represents tumor cell migration 12 hours following wound formation. N>5 for all samples G. Wound healing in WT PK5L1940 cells, +/− coculture with 3T3 cells for 1 week. H. Wound healing in ADAM10 KO cells +/− coculture with 3T3 cells. I. Wound healing in WT cells treated with EPHB4 inhibitor TNYL-RAW (B4i), +/− coculture with 3T3 cells. J. Wound healing in WT cells 1 week after treatment with 0 or 10 Gy RT. (k.) Wound healing in ADAM10KO knockout cells 1 week after treatment with 0 or 10Gy RT. L. Wound healing in WT cells 1 week after treatment with 10Gy RT, with or without coculture with fibroblasts. M. Wound healing in cocultured WT cells 1 week after treatment with 0 or 10Gy RT. N. Wound healing in cocultured ADAM10 KO cells 1 week after treatment with 0 or 10Gy RT. O. Xcelligence assay for transwell invasion through Matrigel 1 in WT PK5L1940 cells 1 week following treatment with 0 or 10Gy RT. P. Xcelligence assay for transwell invasion through Matrigel 1 in ADAM10 KO cells 1 week following treatment with 0 or 10Gy RT or 10Gy RT with addition of EPHB4 activator ephrinB2 FC protein. Q. MTT assay of WT PK5L1940 cells 1 week following treatment with 0 or 10Gy. R. MTT assay of ADAM10 KO cells 1 week following treatment with 0 or 10Gy RT, or 10Gy RT and EPHB4 activator ephrinB2 FC Protein. N ≥3. P-values calculated using students T-test, all error bars show SEM of measurements. * indicates p<0.05, ** p<0.02 **** indicates p<0.0001
Figure 5.
Figure 5.. ADAM10 KO and RT reduce growth of metastatic and orthotopically implanted KPC tumors.
A. Exponential growth rate (k) of human organoid line Panc193, in co-culture with human CAFs, measured by Incucyte live cell analyzer after treatment with 0 or 10Gy RT, in the presence or absence of ADAM10 inhibitor GI254023x. B. Cell viability of human Panc193 organoids, in coculture with human CAFs, 1 week following treatment with 0 or 10Gy RT, in presence or absence of ADAM10 inhibitor GI254023x. C. Cell viability of human Panc193 organoids, in coculture with human CAFs, 1 week following treatment with 0 or 10Gy RT, in presence or absence of EPHB4 inhibitor TNYL-Raw(B4i)). D. Schema of hemispleen metastatic liver tumor model utilized in following slides. E. Representative images of mouse livers collected at sacrifice, 2 weeks following implantation with fibroblast cocultured WT or ADAM10 KO PK5L1940 cells which had been treated with 0 or 10Gy RT 1 week prior, Created with BioRender.com. F. Number of metastatic liver lesions counted at necropsy, 14 days after hemispleen implantation of fibroblast cocultured WT or ADAM10 KO PK5L1940 cells after treatment with 10Gy RT. G. Proportion of liver surface area comprised of tumor at day 14 post implant of WT or ADAM10 knockout PK5L1940 cells after treatment with 10Gy RT. H. Survival in mice treated with hemispleen implantation of metastatic liver tumors, using fibroblast cocultured WT and ADAM10 KO PK5L1940 cells, N=5. P values shown derived from Mantel-Cox log rank analysis. I. Liver mass of mice 14 days after hemispleen implantation with WT PK5L1940 cells co-cultured with WT or EphrinB2 KO NIH 3T3 cells. J. Proportion of liver surface area comprised of tumor 14 days after hemispleen implantation with WT PK5L1940 cells co-cultured with WT or EphrinB2 KO NIH 3T3 cells. K. Tumor volume, 27 days following implantation of WT or ADAM10KO tumors into flanks of PDGFRa-ADAM10 fl mice or littermate controls. L. Tumor volume of WT tumors 27 days following implantation into flanks of PDGFRa-ADAM10 fl mice or littermate controls, all treated with 16Gy RT 7 days following implantation. N>3, error bars represent SEM. P values calculated using student’s T-test. * indicates p<0.05, ** p<0.02, *** indicates p<0.001, **** indicates p<0.0001
Figure 6.
Figure 6.. EphrinB2 is released into patient plasma and mouse plasma after high dose RT to PDAC tumors.
A. ELISA for ephrinB2 in patient plasma samples collected from patients with LAPC, prior to, during, and after treatment with SBRT. X axis shows dose per fraction of SBRT, patients were treated with 3 fractions. Y axis represents ephrinB2 plasma concentration determined by standard curve. *p<0.05 B. ELISA for ephrinB2 in mouse plasma collected 2 weeks following increasing single fraction doses of RT to flank grafts, Y axis represents absorbance at 450nm minus negative control. N=6 replicates. C. ELISA for ephrinB2 in mice implanted with WT KPC flank grafts, vs. ADAM10 KO KPC grafts, Y axis represents absorbance at 450nm minus negative control N=6 replicates. P values calculated using Student’s T-Test.

Comment in

Similar articles

Cited by

References

    1. Ilic M, Ilic I. Epidemiology of pancreatic cancer. World J Gastroenterol 2016;22:9694–705 - PMC - PubMed
    1. Ohlund D, Handly-Santana A, Biffi G, Elyada E, Almeida AS, Ponz-Sarvise M, et al. Distinct populations of inflammatory fibroblasts and myofibroblasts in pancreatic cancer. J Exp Med 2017;214:579–96 - PMC - PubMed
    1. Bailey P, Chang DK, Nones K, Johns AL, Patch AM, Gingras MC, et al. Genomic analyses identify molecular subtypes of pancreatic cancer. Nature 2016;531:47–52 - PubMed
    1. Moffitt RA, Marayati R, Flate EL, Volmar KE, Loeza SG, Hoadley KA, et al. Virtual microdissection identifies distinct tumor- and stroma-specific subtypes of pancreatic ductal adenocarcinoma. Nat Genet 2015;47:1168–78 - PMC - PubMed
    1. Nicolle R, Blum Y, Marisa L, Loncle C, Gayet O, Moutardier V, et al. Pancreatic Adenocarcinoma Therapeutic Targets Revealed by Tumor-Stroma Cross-Talk Analyses in Patient-Derived Xenografts. Cell Rep 2017;21:2458–70 - PMC - PubMed

Publication types

MeSH terms