. 2021 Feb 16;118(7):e2012170118.
doi: 10.1073/pnas.2012170118.

Chromatophores efficiently promote light-driven ATP synthesis and DNA transcription inside hybrid multicompartment artificial cells

Affiliations

Chromatophores efficiently promote light-driven ATP synthesis and DNA transcription inside hybrid multicompartment artificial cells

Emiliano Altamura et al. Proc Natl Acad Sci U S A. .

Abstract

The construction of energetically autonomous artificial protocells is one of the most ambitious goals in bottom-up synthetic biology. Here, we show an efficient manner to build adenosine 5'-triphosphate (ATP) synthesizing hybrid multicompartment protocells. Bacterial chromatophores from Rhodobacter sphaeroides accomplish the photophosphorylation of adenosine 5'-diphosphate (ADP) to ATP, functioning as nanosized photosynthetic organellae when encapsulated inside artificial giant phospholipid vesicles (ATP production rate up to ∼100 ATP∙s-1 per ATP synthase). The chromatophore morphology and the orientation of the photophosphorylation proteins were characterized by cryo-electron microscopy (cryo-EM) and time-resolved spectroscopy. The freshly synthesized ATP has been employed for sustaining the transcription of a DNA gene, following the RNA biosynthesis inside individual vesicles by confocal microscopy. The hybrid multicompartment approach here proposed is very promising for the construction of full-fledged artificial protocells because it relies on easy-to-obtain and ready-to-use chromatophores, paving the way for artificial simplified-autotroph protocells (ASAPs).

Keywords: artificial photosynthesis; artificial protocells; bacterial chromatophores; light transduction; synthetic biology.


Conflict of interest statement

The authors declare no competing interest.

Figures

Fig. 1.
Fig. 1.
Chromatophore-containing ASAPs. (A) R. sphaeroides R-26 is a carotenoidless mutant strain lacking LH2 complexes. For these reasons, the membrane exhibits few invaginations, large spherical vesicles (average diameter 80 nm), and several stratified flattened vesicles (35, 36). Chromatophores are ∼80-nm closed vesicles derived from the lysis of R. sphaeroides R-26 cells, typically via French pressing or sonication. Their membrane also contains LH1 (not shown for sake of clarity), RC (yellow), bc1 (blue), ATPsyn (purple) in inside-out orientation when compared with the cytoplasmic photosynthetic membrane. The chromatophore lumen contains periplasmic solutes, in particular cytochrome c 2 (here shown in both oxidation states: i.e., reduced cyt2+, green; and oxidized cyt3+ orange) whereas the chromatophore membrane hosts the ubiquinone pool (oxidized Q, black circles and reduced QH2, white circles). The photophosphorylation mechanism starts with a light-induced oxidation of a bacteriochlorophyll dimer (D) in RC. The photogenerated electron travels through the RC and reduces the bound Q that, in two steps, forms QH2 (two protons are extracted from the outer solution). The oxidized dimer is reduced by cyt2+ present in the chromatophore lumen. The bc1 complex restores the initial conditions by transferring electrons from QH2 to cyt3+, with a concomitant translocation of protons from the outer solution to the chromatophore lumen. The resulting proton electrochemical gradient (positive inside) is exploited by the ATPsyn rotatory mechanism to catalyze the thermodynamically uphill conversion of ADP + Pi into ATP (∼100 ATP∙s−1 per ATPsyn), produced in the outer solution. Chromatophores act as ATP-producing organellae when illuminated by an 860-nm light. (B) ASAP functioning. Chromatophores are encapsulated inside ∼20-µm giant phospholipid vesicles made of POPC and illuminated (hν represents the energy of the radiation) to generate a proton motive force (Δp ∼130 mV) across the membrane. Coencapsulated ADP, Pi, GTP, CTP, UTP, T7 RNA polymerase (dark green), and a DNA template give rise to an out-of-equilibrium system of coupled reactions: namely, photophosphorylation and DNA transcription. The biosynthesized mRNA is revealed by OA (pink), which binds it, forming a green-fluorescent complex.
Fig. 2.
Fig. 2.
R. sphaeroides R-26 chromatophores. (A) Green chromatophores produced by French pressing R. sphaeroides cells and pelleted by ultracentrifugation. (B) Number-weighted size distribution of chromatophores as obtained by DLS (the curve refers to an average of three measurements of an individual sample; mode: 68 nm; mean ± SD: 80 ± 23 nm). (C and D) Cryo-EM tomographic slice of chromatophores; yellow arrows indicate the clearly visible ATPsyn in their equatorial plane, cyan arrow indicates an open membrane fragment; additional images in SI Appendix, Fig. S1. The yellow and red dashed rectangles in C and D are zoomed-in D and E, respectively. (E) Magnification of a single ATPsyn (13 nm wide, 21 nm long); additional images in SI Appendix, Fig. S2. (F) A 3D-tomographic reconstruction of ATPsyn shown in E. (G) Ultraviolet visible (UV-Vis) absorption spectrum of purified chromatophores; note the peak at 860 nm, due to bacteriochlorophylls, that serves as a measure of chromatophore concentration. (H) Kinetics of charge recombination taking place within the RC. The amplitude of the 860-nm peak suddenly decreases upon actinic light irradiation (saturating flash, indicated by the arrow), due to charge separation. Next, a slow increase of the 860-nm absorbance is observed (completed in about 2 s), due to charge recombination (mAU respresents AU/1,000, where AU stands for absorbance unit). The two curves refer to an individual chromatophore sample before (yellow points, A), and after treatment with 1% wt/vol LDAO (cyan points, B). (I) Comparison between ΔA860(0) (bar A) and ΔA860(0),LDAO (bar B) and their meaning in terms of RC orientation in the chromatophores. The bars represent the values reported in H and refer to an individual chromatophore sample. [Scale bars: 100 nm (C), 50 nm (D), 10 nm (E and F).]
Fig. 3.
Fig. 3.
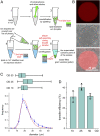
Preparation of multicompartment protocells. (A) The droplet transfer method consists of two steps. In the first, lipid-stabilized w/o droplets are prepared by mechanical emulsification of a chromatophore-containing aqueous solution in a lipid-containing mineral oil solution. Chromatophores and all water-soluble solutes are entrapped inside the w/o droplets. Next, the w/o droplets are gently poured over another vial consisting of a lipid-in-oil solution stratified over an aqueous phase. GUVs are formed when the w/o droplets cross the second lipid monolayer at the oil–water interface. Chromatophores and water-soluble compounds are found inside GUVs. The droplet transfer is not 100% efficient; some w/o droplets break during the centrifugation, releasing their content in the bottom aqueous solution. (B) Appearance of multicompartment protocells (fluorescent channel, top; bright field, center; overlay, bottom). Chromatophores have been stained by the hydrophobic fluorescent dye Nile Red. (Scale bar: 20 µm.) (C) Protocell size distribution (blue points) obtained by image analysis of protocells (n = 948, mean ± SE). The red curve represents the best-fit log-normal distribution (mean: 20.5 µm). The horizontal boxes represent the three protocell size distributions obtained by varying the concentration of entrapped chromatophores (OD860 = 10, n = 234; OD860 = 25, n = 171; OD860 = 50, n = 194); the two extreme marks indicate the limits of the distribution, and the box marks indicate the first, the second, and the third quartiles. The three medians are not significantly different according to the Kruskal–Wallis test for nonnormal distributions. (D) Comparison between the transfer efficiency as a function of the concentration of entrapped chromatophores (OD860 = 10, 25, 50). Bars represent the transfer efficiency (mean ± SD, n = 3, independently prepared samples) as obtained by measuring the concentration of chromatophores released in the aqueous solution just after the droplet transfer. The three means are not significantly different according to the one-way ANOVA test.
Fig. 4.
Fig. 4.
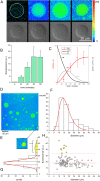
mRNA biosynthesis inside ASAPs. (A) Typical appearance of mRNA-biosynthesizing ASAPs after 30, 60, 90, and 120 min of illumination and incubation at 37 °C (fluorescent channel, top; bright field, bottom). The white dotted circle represents the vesicle contour. Note that, for each time point, a different representative vesicle is shown. Fluorescence is due to the complex between AO and mRNA. Images are given in a coded-color scale, shown on the right (different colors represent different fluorescence intensities). (Scale bar: 20 µm.) (B) Increase of the average inner fluorescence of ASAPs determined by image analysis over different ASAP populations (30 min, n = 43; 60 min, n = 121; 90 min, n = 113; 120 min, n = 72); bars represent the mean ± SD. The inner fluorescence of each ASAP was determined as the pixel signal mean (C) Calculated time-dependent profiles of ADP (black), ATP (gray), and polymerized ATP (in form of mRNA, red) according to a minimal two-reaction model described in SI Appendix, Text S7 . (D) Diversity among mRNA-biosynthesizing ASAPs made evident by a wide-field image (coded-color scale). (E) Magnification of a highly fluorescent ASAP. (F) ASAP size distribution of data points shown in H; the red curve represents the best-fit log-normal distribution. (G) Fluorescence distribution of data points shown in H; the red curve represents the best-fit normal distribution matching the major distribution peak; bars outside the normal distribution are marked yellow. (H) Dot plot representing the size and the internal fluorescence of ASAPs after 90 min illumination. ASAPs with high fluorescence are marked yellow. The continuous red line and the two dashed red lines represent the average and the boundaries of a subpopulation of ASAPs whose fluorescence is normally distributed (a.u. stands for arbitrary unit).

References

    1. Luisi P. L., Toward the engineering of minimal living cells. Anat. Rec. 268, 208–214 (2002). - PubMed
    1. Schwille P., et al. ., MaxSynBio: Avenues towards creating cells from the bottom up. Angew. Chem. Int. Ed. Engl. 57, 13382–13392 (2018). - PubMed
    1. Blain J. C., Szostak J. W., Progress toward synthetic cells. Annu. Rev. Biochem. 83, 615–640 (2014). - PubMed
    1. Hindley J. W., et al. ., Building a synthetic mechanosensitive signaling pathway in compartmentalized artificial cells. Proc. Natl. Acad. Sci. U.S.A. 116, 16711–16716 (2019). - PMC - PubMed
    1. Fanalista F., et al. ., Shape and size control of artificial cells for bottom-up biology. ACS Nano 13, 5439–5450 (2019). - PMC - PubMed

Publication types

MeSH terms

Substances