. 2021 Feb;9(2):e001906.
doi: 10.1136/jitc-2020-001906.

STING agonist-based treatment promotes vascular normalization and tertiary lymphoid structure formation in the therapeutic melanoma microenvironment

Affiliations

STING agonist-based treatment promotes vascular normalization and tertiary lymphoid structure formation in the therapeutic melanoma microenvironment

Manoj Chelvanambi et al. J Immunother Cancer. 2021 Feb.

Abstract

Background: The degree of immune infiltration in tumors, especially CD8+ T cells, greatly impacts patient disease course and response to interventional immunotherapy. Enhancement of tumor infiltrating lymphocyte (TIL) is a critical element of efficacious therapy and one that may be achieved via administration of agents that promote tumor vascular normalization (VN) and/or induce the development of tertiary lymphoid structures (TLS) within the tumor microenvironment (TME).

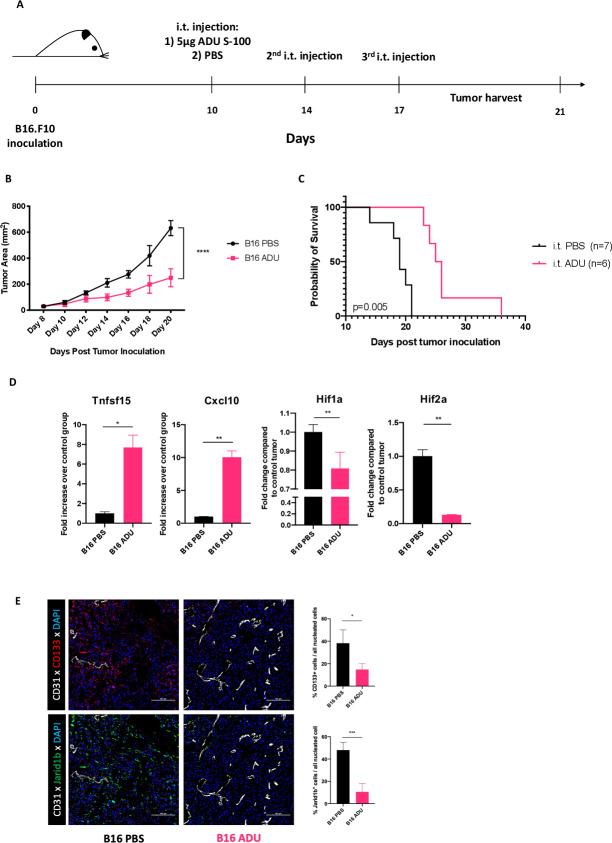
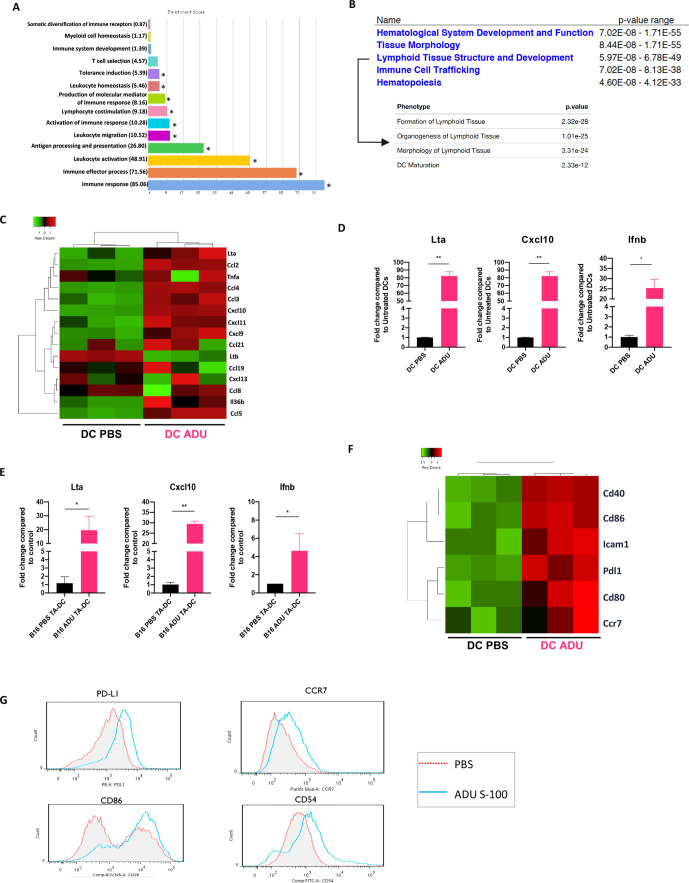
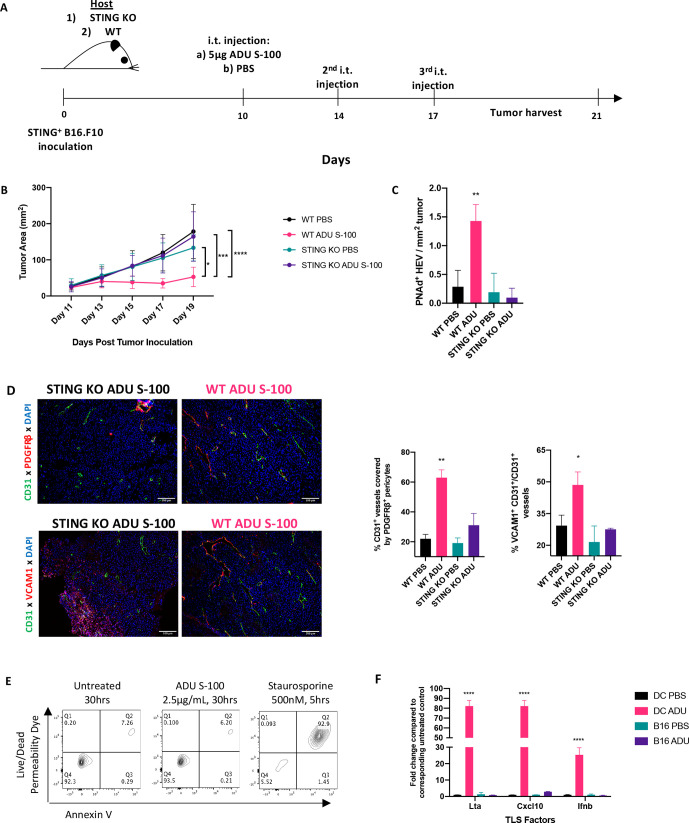
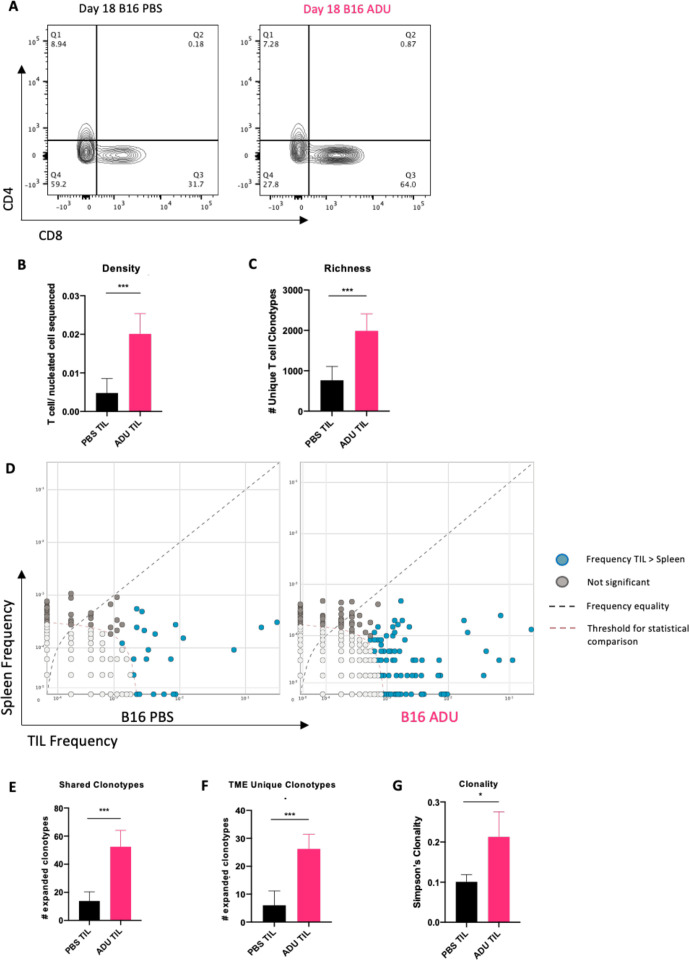
Methods: Low-dose stimulator of interferon genes (STING) agonist ADU S-100 (5 µg/mouse) was delivered intratumorally to established subcutaneous B16.F10 melanomas on days 10, 14 and 17 post-tumor inoculation. Treated and control tumors were isolated at various time points to assess transcriptional changes associated with VN and TLS formation via quantitative PCR (qPCR), with corollary immune cell composition changes in isolated tissues determined using flow cytometry and immunofluorescence microscopy. In vitro assays were performed on CD11c+ BMDCs treated with 2.5 µg/mL ADU S-100 or CD11c+ DCs isolated from tumor digests and associated transcriptional changes analyzed via qPCR or profiled using DNA microarrays. For T cell repertoireβ-CDR3 analyses, T cell CDR3 was sequenced from gDNA isolated from splenocytes and enzymatically digested tumors.

Results: We report that activation of STING within the TME leads to slowed melanoma growth in association with increased production of antiangiogenic factors including Tnfsf15 (Vegi) and Cxcl10, and TLS-inducing factors including Ccl19, Ccl21, Lta, Ltb and Light. Therapeutic responses resulting from intratumoral STING activation were characterized by improved VN, enhanced tumor infiltration by CD8+ T cells and CD11c+ DCs and local TLS neogenesis, all of which were dependent on host expression of STING. Consistent with a central role for DC in TLS formation, ADU S-100-activated mCD11c+ DCs also exhibited upregulated expression of TLS promoting factors including lymphotoxin-α (LTA), interleukin (IL)-36, inflammatory chemokines and type I interferons in vitro and in vivo. TLS formation in ADU S-100-treated mice was associated with the development of a highly oligoclonal TIL repertoire enriched in expanded T cell clonotypes unique to the TME and not detected in the periphery.

Conclusions: Our data support the premise that i.t. delivery of low-dose STING agonist promotes VN and a proinflammatory TME supportive of TLS formation, enrichment in the TIL repertoire and tumor growth control.

Keywords: CD8-Positive T-Lymphocytes; dendritic cells; immunohistochemistry; immunotherapy; melanoma.


Conflict of interest statement

Competing interests: None declared.

Figures

Figure 1
Figure 1
Intratumoral STING activation slows melanoma growth in mice. (A) Schematic depiction of our in vivo experimental design. C57BL/6J mice bearing subcutaneous B16.F10 tumors received three intratumoral injections of 5 µg ADU S-100 over the span of a week. (n=5/group) (B) representative tumor growth curves from cohorts of B16.F10 melanoma showing significantly slower tumor growth kinetics when mice were treated with ADU S-100 intratumorally. Tumor measurements represented as total tumor area (calculated as small axis X large axis) ****p < 0.0001, two-way ANOVA (C). Representative Kaplan-Meier survival plot depicting improved survival in mice treated with ADU S-100 vs control mice. *p = 0.005, Mantel-Cox log RANK test. (D) Post-treatment tumor digests obtained on day 18 show transcriptional signatures associated with vascular normalization such as with increased anti-angiogenic factors (Tnfsf15/Vegi, Cxcl10) and decreased tissue hypoxia (using Hif1a and Hif2a as biomarkers) in ADU S-100 treated tumors. *p < 0.05; **p < 0.002. (E) Immunofluorescence staining and image quantitation showing reduced expression of hypoxia-responsive cancer stem cell markers CD133 and JARID1B in ADU S-100-treated B16.F10. *p< 0.05; ***p < 0.0002. Data are representative of three independent experiments. ANOVA, analysis of variance; i.t, intratumorally.
Figure 2
Figure 2
Delivery of low-dose STING agonist into the TME promotes vasculature normalization (VN), lymphangiogenesis and improved immune cell recruitment. (A) Representative images of lectin perfused functional vessels in PBS or ADU S-100 treated B16.F10 melanoma resected 18 days post-tumor inoculation. (B) Quantitation of vessel perfusion in PBS or ADU S-100 treated tumors shown as a function of percent CD31+ VECs containing luminal lectin-AF488. (C) Representative images depicting PDGFRβ+ pericyte coverage on tumor VECs in PBS or ADU S-100 treated B16.F10 tumors resected 18 days post inoculation (inset scale bar=50 µm). (D) Quantitation of the percentage of CD31+ VECs with tightly-approximated (covering) PDGFRβ+ pericytes based on overlapping fluorescence signals at the abluminal VEC surface-pericyte interface. (E) Representative images showing increased abundance of Lyve-1+ lymphatic endothelial cells in ADU S-100 treated B16.F10 tumors. (F) Quantitation of Lyve-1+ LEC density per unit area tumor. (G) Representative images showing VCAM-1 expression on tumor VECs in PBS or ADU S-100 treated B16.F10 melanoma (H) quantitation of VCAM-1 expression on CD31+VECs. (I) Percent quantitation of live CD45+ cells in resected B16.F10 melanoma treated with PBS or ADU S-100. (J) Quantitation of CD8+ T cell and CD11c+ DC infiltrates in ADU S-100 treated or control B16.F10 tumors. Data are representative of three independent experiments. *p < 0.05; ** p < 0.002; ***p < 0.0002. scale bar=100 µm. LEC, lymphatic endothelial cells; TME, tumor microenvironment.
Figure 3
Figure 3
STING activated DCs exhibit TLS inducing characteristics. (A) Visualization of Biological Processes Gene Ontology terms associated with differentially expressed genes (DEG) in sting activated CD11c+ DCs. Go analysis performed using Partek genomics suite, *p < 0.05, one-way ANOVA (B) annotated microarray probes cross-referenced with ingenuity pathway analysis (Qiagen) implicates Deg gene expression of sting activated DCs in promoting their maturation and in the formation, structure and development of lymphoid tissues. (C) STING activated DCs upregulate factors associated with TLS formation. (D) Quantitative rtPCR validation of TLS inducing factors highlighted by microarray analysis. (E) Quantitative rtPCR validation showing increased TLS-associated analyte production by CD11c+ DCs directly isolated from digests of tumors treated with ADU S-100 vs PBS in vivo. (F) STING activated DCs demonstrate a more mature phenotype as evidenced by increased transcript levels of DC maturation markers. (G) Flow cytometric validation of DC maturation on STING activation. Data representative of three independent experiments *p < 0.05; **p < 0.002. ANOVA, analysis of variance; DCs, dendritic cells; IFN, interferon TLS; tertiary lymphoid structures.
Figure 4
Figure 4
Low-dose STING activation induces non-classical TLS formation in the therapeutic TME. (A) Post-treatment tumor digests obtained on day 18 show increased transcript levels of TLS inducing homeostatic chemokines (Ccl19 and Ccl21) and TLS inducing LTβR agonists (Lta, Ltb and Tnfsf14/Light). (B) Representative immunofluorescent images showing TLS in ADU S-100 treated B16.F10 tumors resected on day 15 (2 injections completed) or on day 18 (3 injections completed) in comparison to PBS treated B16.F10 tumors lacking TLS. (C) Representative image of ADU S-100 treated B16.F10 tumor resected on day 18 showing sting induced non-classical TLS composed of CD11c+ DCs and CD3+ T cells surrounding PNAd+ HEV. (D) TLS formation quantitated using PNAd+ HEV density in PBS or ADU S-100 treated B16.F10 tumors. Data representative of three independent experiments. (E) ADU S-100-treated vs control B16.F10 tumors demonstrate marked increase in number of physical contacts between infiltrating CD11c+ DCs and CD3+ T cells. *p < 0.05; **p < 0.002; ***p < 0.0002; ****p < 0.0001. Scale bar=100 µm. DCs, dendritic cells; TLS, tertiary lymphoid structures; TMS, tumor microenvironment; TNF, tumor necrosis factor.
Figure 5
Figure 5
Host STING expression is required for therapeutic VN, TLS neogenesis and treatment benefit. (A) Schematic representation of animal experiments performed using WT and sting KO (Tmem173gt) mice. Treatment timelines for PBS or ADU S-100 were identical as in previous experiments. All mice received S.C. injections of STING+ B16.F10 tumors. (n=5/group) (B). Tumor growth curves of WT and sting KO mice showing observed therapeutic effect in only the ADU S-100 treated WT host group. *p < 0.05, ***p < 0.0002; ****p < 0.0001, two-way ANOVA. (C) Quantitation of HEVs in WT host or sting KO host receiving ADU S-100 or PBS **p < 0.002, one-way ANOVA. (D) Representative images showing VN as a function of pericyte coverage and VEC activation in tumors resected from WT hosts, but not from sting KO hosts, treated with ADU S-100. *p < 0.05; **p < 0.002, one-way ANOVA. (E) Representative flow cytometric plots from apoptosis assay on cultured B16.F10 cells confirming sting agonism is not directly tumoricidal. (F) Quantitative rtPCR validation of the lack of response to sting activation in B16.F10 cells (as compared with responsive CD11c+ DCs). ****p < 0.0001, one-way ANOVA. Scale bar=100 µm. ANOVA, analysis of variance; DC, dendritic cell; i.t, intratumorally; rtPCR, real time PCR; TLS, tertiary lymphoid structures; VN, vascular normalization.
Figure 6
Figure 6
Therapeutic STING activation expands a TIL repertoire unique to the TLS+ TME. (A) representative flow cytometry plots from day 18 ADU S-100 treated or control tumors showing increased infiltration of CD8+ T cells post-STING activation. (B) TCRseq analysis confirming increased T cell presence in ADU S-100 treated bulk tumor samples sequenced. (C) TILs in ADU S-100 treated tumors characterized by increased populational richness (greater number of divergent clonotypes/sample). (D) differential abundance plots comparing relative frequencies of expanded clonotypes (using cut-off clonal count >10) between matched TILs and splenocytes. (E) ADU S-100 treated tumors (vs control tumors) exhibit expansion in T cell clonotypes common to peripheral tissues (ie, spleen). (F) ADU S-100 TILs (vs control TILs) contain expanded T cell clonotypes unique to the Tme. (G) TILs in ADU S-100 treated tumors demonstrate increased clonality (more oligoclonal) compared with TILs from PBS-treated tumors. n=5/cohort. TCRseq differential abundance calculated using non-parametric two-tailed t-tests (bH <0.01, p-value<0.05) on ImmunoSEQ analyzer 3.0. *p<0.05; ***p < 0.0002; ****p<0.0001.

References

    1. Society AC ACS facts and figures 2020.
    1. Tumeh PC, Harview CL, Yearley JH, et al. . PD-1 blockade induces responses by inhibiting adaptive immune resistance. Nature 2014;515:568–71. 10.1038/nature13954 - DOI - PMC - PubMed
    1. Fabian KPL, Chi-Sabins N, Taylor JL, et al. . Therapeutic efficacy of combined vaccination against tumor pericyte-associated antigens DLK1 and DLK2 in mice. Oncoimmunology 2017;6:e1290035. 10.1080/2162402X.2017.1290035 - DOI - PMC - PubMed
    1. Li W, Quan Y-Y, Li Y, et al. . Monitoring of tumor vascular normalization: the key points from basic research to clinical application. Cancer Manag Res 2018;10:4163–72. 10.2147/CMAR.S174712 - DOI - PMC - PubMed
    1. Jain RK Barriers to drug delivery in solid tumors. Sci Am 1994;271:58–65. 10.1038/scientificamerican0794-58 - DOI - PubMed

Publication types

MeSH terms