. 2021 Feb 9;118(6):e2012658118.
doi: 10.1073/pnas.2012658118.

Area-specific thalamocortical synchronization underlies the transition from motor planning to execution

Affiliations

Area-specific thalamocortical synchronization underlies the transition from motor planning to execution

Abdulraheem Nashef et al. Proc Natl Acad Sci U S A. .

Abstract

We studied correlated firing between motor thalamic and cortical cells in monkeys performing a delayed-response reaching task. Simultaneous recording of thalamocortical activity revealed that around movement onset, thalamic cells were positively correlated with cell activity in the primary motor cortex but negatively correlated with the activity of the premotor cortex. The differences in the correlation contrasted with the average neural responses, which were similar in all three areas. Neuronal correlations reveal functional cooperation and opposition between the motor thalamus and distinct motor cortical areas with specific roles in planning vs. performing movements. Thus, by enhancing and suppressing motor and premotor firing, the motor thalamus can facilitate the transition from a motor plan to execution.

Keywords: cerebellum; motor cortex; motor thalamus; movement initiation; nonhuman primates.


Conflict of interest statement

The authors declare no competing interest.

Figures

Fig. 1.
Fig. 1.
Task schematic and SCP stimulation. (A) Illustration of the thalamocortical system and the experimental setup. Fibers from the deep cerebellar nuclei ascend via the superior cerebellar peduncle to contact neurons in the motor thalamus, which in turn send ascending fibers to the motor cortex. Recordings were made simultaneously in the motor thalamus and the motor cortex which includes the primary motor and premotor areas. Stimulations were applied through chronic stimulating electrodes implanted in the SCP. (B) The sequence of events composing a single trial included a precue period, cue onset (where one of eight equally distributed peripheral targets appeared), a delay period, and a go signal, after which the monkey had to acquire the target within a limited movement time. Correct performance resulted in a reward (a drop of applesauce). (C) Responses of simultaneously recorded thalamic (black raster plot) and motor cortical (green raster plot) cells to single-pulse SCP stimulation. Both raster plots are aligned around stimulation time (t = 0) indicated also by the vertical dashed line. (C, Upper) Two peristimulus time histograms, one for each cell. The neuronal waveforms (Upper Right) are depicted using 50 randomly selected waveforms (with an average waveform in bold).
Fig. 2.
Fig. 2.
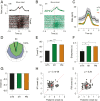
Task-related activity of identified thalamic and cortical cells. (A) Example of task-related activity of a single thalamic cell aligned on movement onset (vertical red lines). Each line represents a single trial, and each dot corresponds to a single spike emitted by the cell. Trials are sorted by cue direction (1 through 8) and the horizontal red lines mark the transitions between different movement directions. (A, Upper) The perievent time histogram of the cell, computed by averaging the activity across all movement directions using a bin size of 25 ms. (B) Task-related activity of a single cortical neuron recorded simultaneously with the thalamic neuron shown in A. The PSTH of the thalamic cell in gray shading is depicted for comparison. (C) The mean firing rate (±SEM shading) of the three groups of cells recorded from the motor thalamus (black; n = 78 cells), M1 (green; n = 1,734 cells), and PM (orange; n = 846 cells). Activity was aligned on movement onset (t = 0). For directionally tuned cells, we computed the mean activity around the preferred direction (±1 target around the preferred target). For untuned cells, activity was averaged across all targets. (D) Example of tuning curves and preferred directions of thalamic (gray) and cortical (green) neurons recorded simultaneously. (E) The fraction of directionally tuned cells in each area (mTh: 43.6%; M1: 70.4%; PM: 68%; ***P < 0.001 using a χ2 test with 1 degree of freedom). (F) Mean (±SEM) of the concentration parameter [Kappa (8, 26)] calculated from the Von Mises fit computed for all tuned cells for each of the Von Mises functions had a significant fit. The Kappa was correlated with the width of the tuning curve such that higher kappa values correspond to narrower tuning curves (mTh: 0.35 ± 0.03; M1: 0.53 ± 0.02; PM: 0.52 ± 0.04; Wilcoxon’s rank-sum test, ***P < 0.001, **P < 0.01, *P < 0.05). (G) The mean onset time relative to movement onset computed for all three groups of neurons used to compute the average response profile shown in C. (H) Pairwise comparisons of the onset time computed for M1 neurons (y axis) and the corresponding thalamic neurons (x axis) that were recorded simultaneously. Each black circle indicates one simultaneous pair; the red rectangle represents the average of the pairwise comparisons and the red dashed line is the unity line (x = y). Red squares show the mean values (mean M1 onset = −0.35 ± 0.02 s; mTh onset = −0.54 ± 0.036 s; Wilcoxon’s signed-rank test, P = 3.1 × 10⁻⁶). (I) Same as H but for PM neurons (average PM onset = −0.44 ± 0.04 s; mTh onset = −0.38 ± 0.045 s; P = 0.26).
Fig. 3.
Fig. 3.
Site-specific modulation of TC interactions. (A) jPSTH computed between the thalamic (y axis) and M1 (x axis) neurons for trials performed toward the preferred direction of the thalamic neurons. The plotted matrix depicts the differences between the actual count matrix and the predicted count matrix computed based on the PSTH of the cells. Time 0 corresponds to movement onset, and the diagonal depicts the zero-lag interunit interactions. The z axis corresponds to the color-coded covariance values (sp2/s2). Vertical and horizontal white lines correspond to movement onset time. The dashed diagonal lines highlight the data used to compute the mean time-resolved correlation values. (B) Same as in A but for mTh–PM cell pairs. (C) Same as in A but for M1–PM cell pairs. Here, for each pair the preferred direction for computing the matrices was randomly selected as the PD of either cell.
Fig. 4.
Fig. 4.
Analysis of direction-specific TC interactions. (A) The mean diagonal of the jPSTHs in Fig. 3A (±SEM). The mean was computed using the diagonals highlighted in Fig. 3A (dashed lines) which span +0.5 s above the main diagonal and −0.5 s below the main diagonal. This was done to capture the directional interactions between the two sites. Asterisks above the curves correspond to time points where the two traces were significantly different (paired t test, P < 0.05). (A, Inset) Relationships between the curves and the specific directional interactions (e.g., the green curve corresponds to M1 preceding mTh and the black curve corresponds to mTh preceding M1). The gray dashed trace shows the average hand velocity profile computed during the same time frame. (B and C) Same as in A but for thalamic–PM pairs (B) and M1–PM pairs (C). (D) The zero-lag (i.e., values along the main diagonal in Fig. 3) pairwise cofiring between the different sites computed for simultaneously recorded triplets of cells (one from each site; n = 488 triplets). (E) Schematic summary of the directional pairwise interaction results. Connecting lines between sites (circles) correspond to the net correlation between the two areas. Arrowheads indicate positive correlation and circles indicate negative correlation. The width of the arrow corresponds to the magnitude of the correlation. Intraareal autocorrelations are shown as well. (E, Left) Computed for a time window before movement onset (−0.5 s to 0). (E, Right) Interactions computed after movement onset (0 to +0.5 s). The dashed vertical line depicts movement onset time.

References

    1. Strick P., Sterling P., Synaptic termination of afferents from the ventrolateral nucleus of the thalamus in the cat motor cortex. A light and electron microscopy study. J. Comp. Neurol. 153, 77–106 (1974). - PubMed
    1. Strick P. L., Light microscopic analysis of the cortical projection of the thalamic ventrolateral nucleus in the cat. Brain Res. 55, 1–24 (1973). - PubMed
    1. Nashef A., Cohen O., Harel R., Israel Z., Prut Y., Reversible block of cerebellar outflow reveals cortical circuitry for motor coordination. Cell Rep. 27, 2608–2619.e4 (2019). - PubMed
    1. Sauerbrei B. A., et al. ., Cortical pattern generation during dexterous movement is input-driven. Nature 577, 386–391 (2020). - PMC - PubMed
    1. Dacre J., et al. , Cerebellar-recipient motor thalamus drives behavioral context-specific movement initiation (2019). dx.doi.org/10.2139/ssrn.3470398. Accessed 14 January 2021.

Publication types

LinkOut - more resources