. 2021 Feb 9;118(6):e2014723118.
doi: 10.1073/pnas.2014723118.

Consequences of aneuploidy in human fibroblasts with trisomy 21

Affiliations

Consequences of aneuploidy in human fibroblasts with trisomy 21

Sunyoung Hwang et al. Proc Natl Acad Sci U S A. .

Abstract

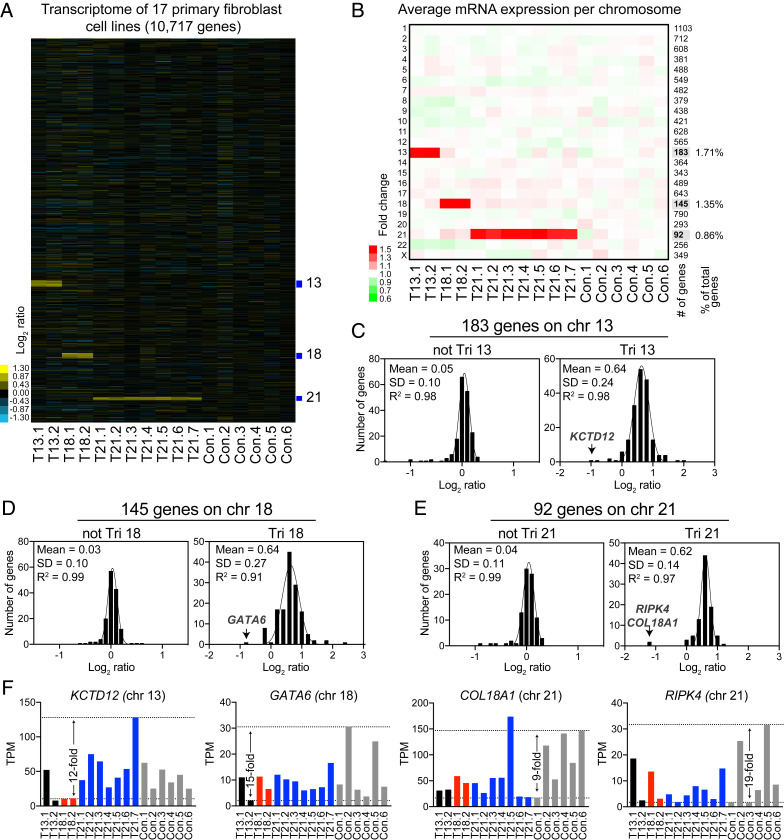
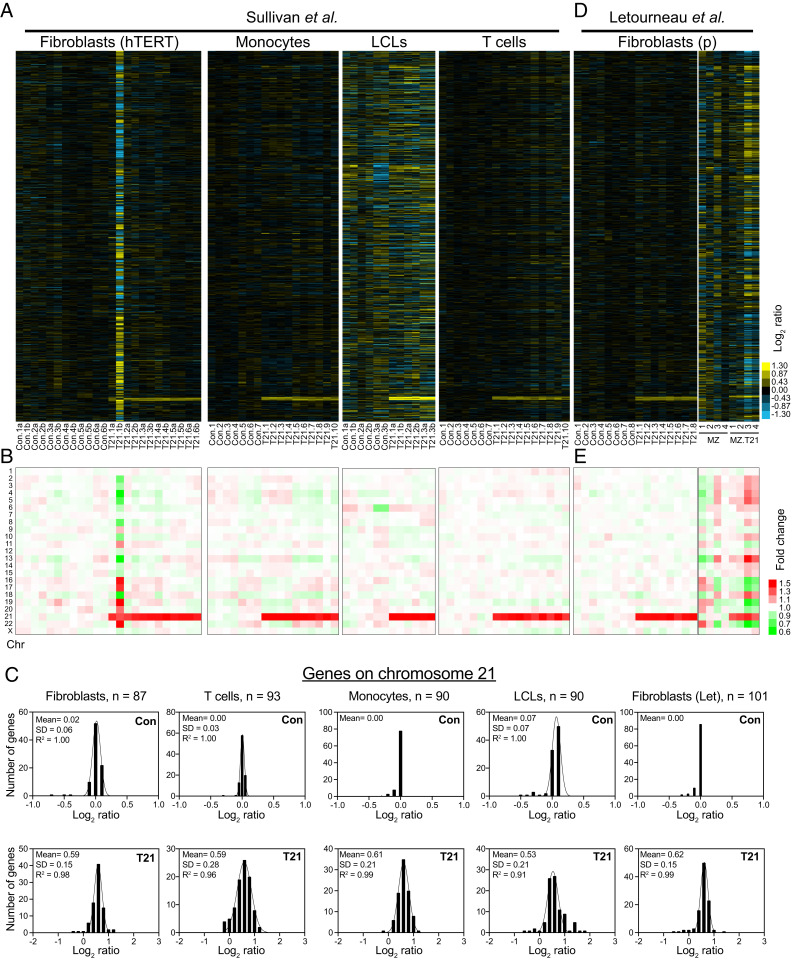
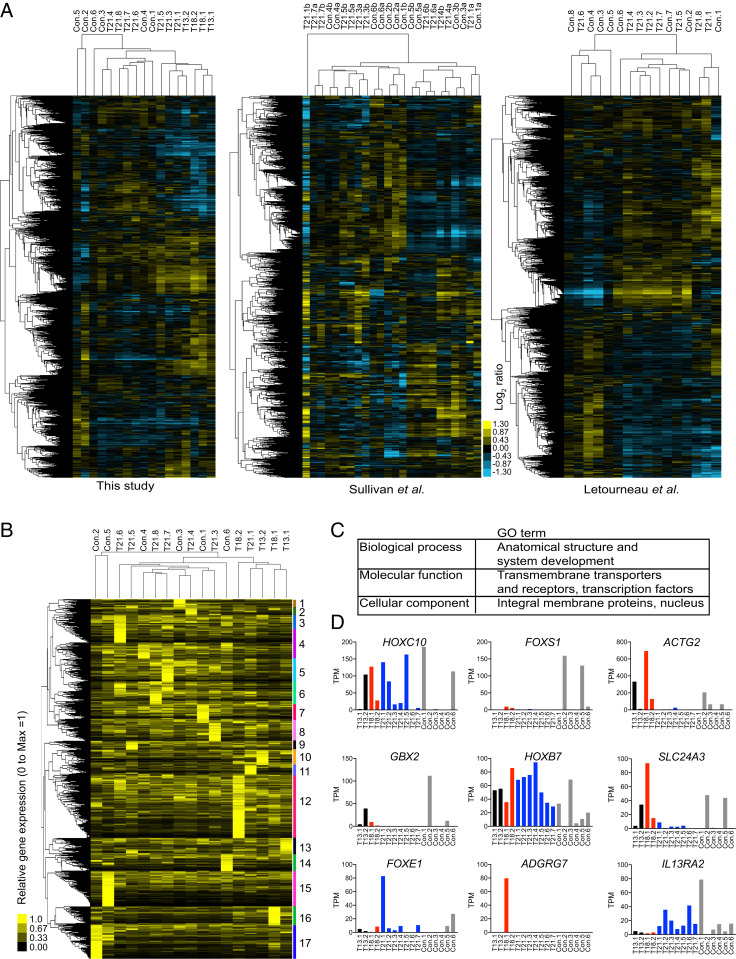
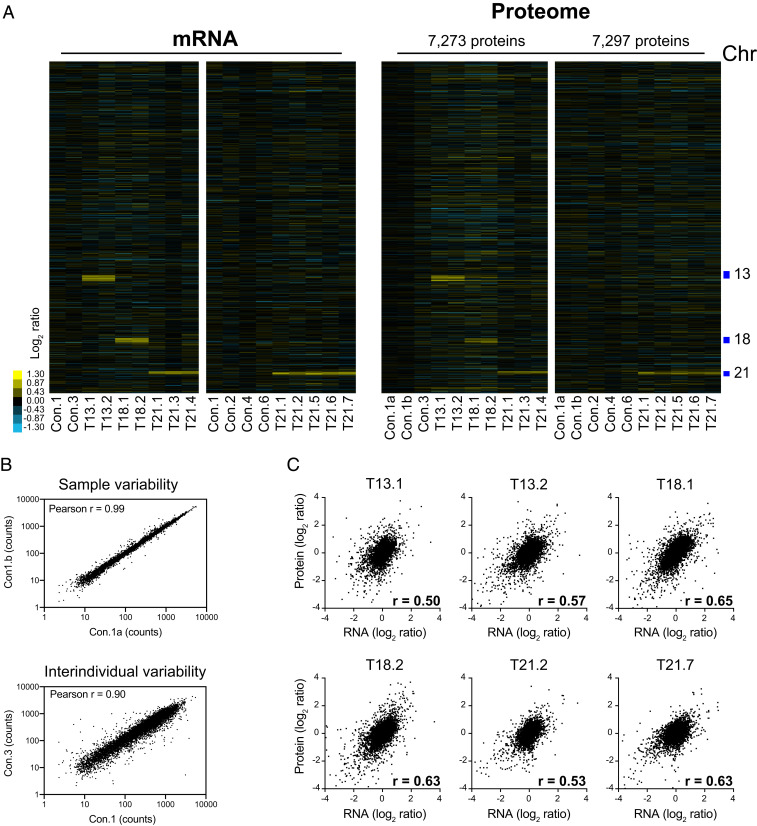
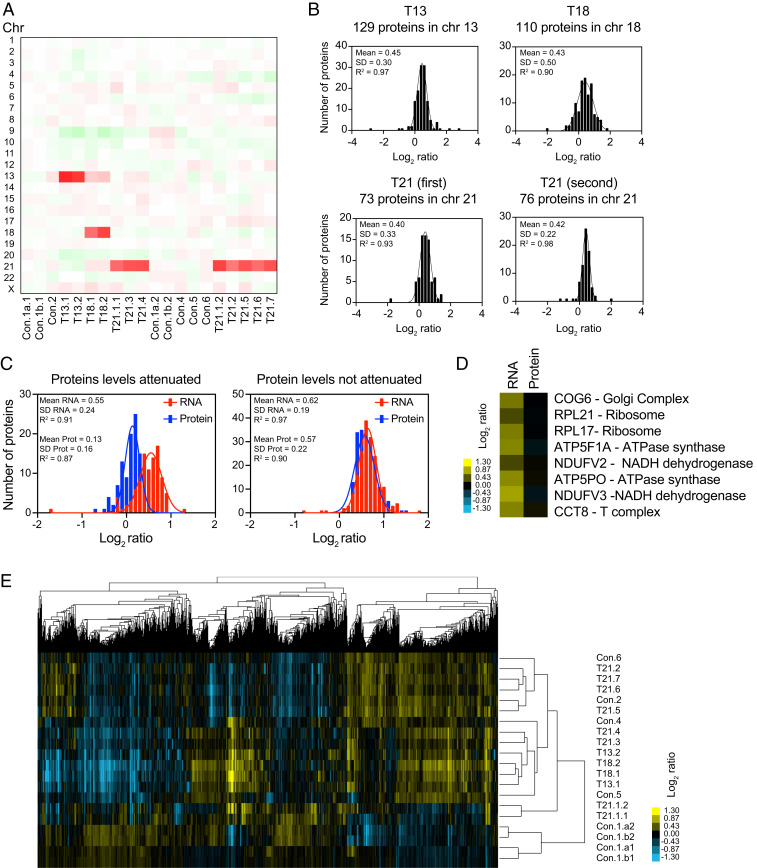
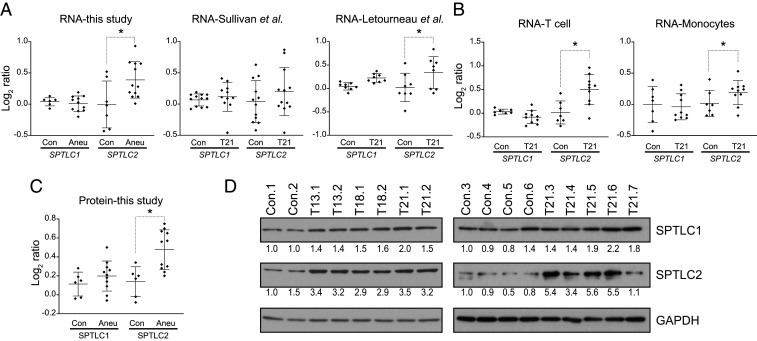
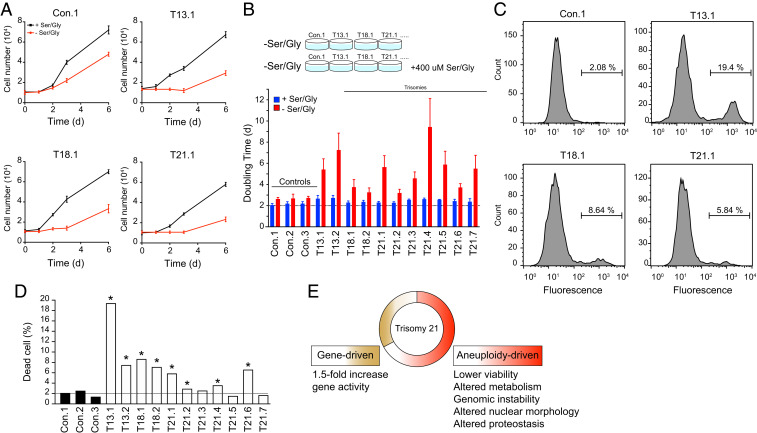
An extra copy of chromosome 21 causes Down syndrome, the most common genetic disease in humans. The mechanisms contributing to aneuploidy-related pathologies in this syndrome, independent of the identity of the triplicated genes, are not well defined. To characterize aneuploidy-driven phenotypes in trisomy 21 cells, we performed global transcriptome, proteome, and phenotypic analyses of primary human fibroblasts from individuals with Patau (trisomy 13), Edwards (trisomy 18), or Down syndromes. On average, mRNA and protein levels were increased by 1.5-fold in all trisomies, with a subset of proteins enriched for subunits of macromolecular complexes showing signs of posttranscriptional regulation. These results support the lack of evidence for widespread dosage compensation or dysregulation of chromosomal domains in human autosomes. Furthermore, we show that several aneuploidy-associated phenotypes are present in trisomy 21 cells, including lower viability and increased dependency on serine-driven lipid synthesis. Our studies establish a critical role of aneuploidy, independent of triplicated gene identity, in driving cellular defects associated with trisomy 21.

Keywords: Down syndrome; aneuploidy; dosage compensation; sphingolipids; trisomy 21.


Conflict of interest statement

The authors declare no competing interest.

Figures

Fig. 1.
Fig. 1.
Transcript levels increase proportionally with gene copy number in trisomic primary fibroblasts. (A) The gene expression of 17 primary fibroblast cell lines ordered by chromosome position. The experiments (columns) for each cell line are shown. T13 = trisomy 13, T18 = trisomy 18, T21 = trisomy 21, and Con = euploid control; refer to SI Appendix, Fig. S1A for detailed cell line nomenclature. (B) The average gene expression per chromosome was calculated for each cell line. The number of genes quantified per chromosome is shown in the right of the heat map. Chromosomes 21, 18, and 13 represent 0.86%, 1.35%, and 1.71% of the total transcriptome, respectively. (C) A histogram of the average log2 ratios of the RNA copy number of genes located on euploid chromosomes (Left) and genes present on trisomic chromosome 13 (Right) in cell lines GM00526 and GM02948, relative to euploid controls, are shown. (D) A histogram of the average log2 ratios of the RNA copy number of genes located on euploid chromosomes (Left) and genes present on trisomic chromosome 18 (Right) in cell lines GM00734 and GM03538, relative to euploid controls are shown. (E) A histogram of the average log2 ratios of the RNA copy number of genes located on euploid chromosomes (Left) and genes present on trisomic chromosome 21 (Right) in cell lines GM04616, GM04592, AG05397, AG06922, GM02767, AG08941, and AG08942, relative to euploid controls are shown. In CE, the bin size for all histograms is log2 ratio of 0.2 and medians are identical to means. Fits to a normal distribution (black line), means, SD, and goodness of fit (R2) are shown for each distribution. (F) Examples of the normalized TPM of a couple of triplicated genes that are outliers in the fits of the normal distributions. Black, red, blue, and gray bars correspond to expression in trisomy 13, 18, 21, and controls, respectively.
Fig. 2.
Fig. 2.
Transcript levels increase proportionally with gene copy number in distinct trisomy 21 cell lines. (A) The gene expression of 24 immortalized fibroblast cell lines, 17 monocytes cell lines, 12 LCLs, and 17 T cell lines obtained by Sullivan et al. (20). The experiments (columns) for each cell line are shown ordered by chromosome position. Refer to SI Appendix, Fig. S2A for detailed cell line nomenclature. (B) The average gene expression per chromosome was calculated for each cell line. (C) A histogram of the average log2 ratios of the RNA copy number of genes located on euploid chromosomes (Top) and genes present on trisomic chromosomes (Top) of the trisomic cell lines relative to euploid controls are shown. The bin size for all histograms is log2 ratio of 0.2, and medians are identical to means. Fits to a normal distribution (black line), means, SD, and goodness of fit (R2) are shown for each distribution. (D) The gene expression of 16 primary fibroblast and 4 technical replicates of each of 2 (MZ and MZ.T21) primary fibroblasts from monozygotic twins; data obtained by Letourneau et al. (16). The experiments (columns) for each cell line are shown ordered by chromosome position. Refer to SI Appendix, Fig. S2B for detailed cell line nomenclature. (E) The average gene expression per chromosome was calculated for each cell line (D).
Fig. 3.
Fig. 3.
Interindividual variability drives gene expression patterns of human primary fibroblasts. (A) The hierarchical clustering analysis of the expression patterns of primary fibroblasts analyzed in this study and in the studies by Sullivan et al. (20) and Letourneau et al. (16) are shown. The expression patterns cluster independent of the karyotype of the cell line. (B) The relative gene expression of genes uniquely expressed in some cell lines. The hierarchical clustering analysis revealed 17 clusters specific for each cell line. (C) The gene ontology enrichment analysis shows that the uniquely expressed genes are enriched in master transcription factors that regulate development and cell surface markers, including transmembrane transporters and receptors proteins. (D) Examples of the normalized TPM of a couple of genes highly expressed in some cell lines but poorly expressed in others. Black, red, blue, and gray bars correspond to expression in trisomy 13, 18, 21, and controls, respectively.
Fig. 4.
Fig. 4.
Protein levels proportionally increase with copy number in trisomic fibroblasts. (A) A comparison of the mRNA (Left) and protein levels (Right) of human primary fibroblasts. The genes are ordered by chromosome position in each experiment (columns). (B) A linear regression analysis of protein counts in technical replicates of a control cell line and between two cell lines from different individuals. (C) The Pearson correlation r was calculated for the mRNA and protein levels for six representative trisomic cell lines.
Fig. 5.
Fig. 5.
Protein levels of subunits of macromolecular complexes are attenuated in trisomic primary fibroblasts. (A) A heatmap of the average protein levels per chromosome in primary fibroblasts. The experiments (columns) for each cell line are ordered by chromosome position. (B) A histogram of the average log2 ratios of the protein levels of genes located on chromosome 13 in trisomy 13 cell lines on chromosome 18 in trisomy 18 cell lines, on chromosome 21 in trisomy 21 cell lines in the first and second datasets, relative to euploid controls are shown. The bin size for all histograms is log2 ratio of 0.2. Fits to a normal distribution (black line), means, SD, and goodness of fit (R2) are shown for each distribution. (C) A histogram of the average log2 ratios of the RNA (red) and protein (blue) levels of triplicated genes that show protein levels lower than predicted (Left) and 1.5-fold changes in trisomic fibroblasts. The bin size for all histograms is log2 ratio of 0.1. Fits to a normal distribution (solid lines), means, SD, and goodness of fit (R2) are shown for each distribution. (D) A few examples of individual subunits located on triplicated chromosomes that show attenuation at the protein levels compared to RNA. COG6 and RPL21 are in chromosome 13. RPL17, ATP5F1A, and NDUFV2 are in chromosome18. ATP5PO, NDUFV3, and CCT8 are in chromosome 21. (E) The hierarchical clustering analyses of proteome profiles do not cluster by karyotype of the cell lines.
Fig. 6.
Fig. 6.
Trisomic primary fibroblasts up-regulate the de novo synthesis of sphingolipids. (A) The expression levels of subunits SPTLC1 and SPTLC2 of the serine palmitoyltransferase enzyme in fibroblasts in this study and in the Sullivan et al. (20) and Letourneau et al. (16) studies. (B) The expression levels of subunits SPTLC1 and SPTLC2 in T cells and monocytes (20). (C) The protein levels of SPTLC1 and SPTLC2 in primary fibroblasts. (D) The Western blots of SPTLC1 and SPTLC2 in primary fibroblasts. GADPH was used as a loading control.
Fig. 7.
Fig. 7.
Trisomic primary fibroblasts rely on serine-driven lipid biosynthesis and show lower viability compared to euploid controls. (A) The proliferation of control fibroblasts and trisomic fibroblasts with or without serine and glycine. The glycine was depleted because it can be used to generate serine by the SHMT1/2 enzymes. The growth curves of four representative cell lines are shown. (B) Doubling times of primary fibroblasts were calculated in medium with (blue bars) or without serine (red bars). A schematic of the experimental procedure is show above. The error bars represent SD, n = 3. (C, D) The viability assay shows that there is an increase in cell death in the trisomic fibroblasts. Fluouresence-activated cell sorting is shown for four representative measurements, n = 5,000 cells (see SI Appendix, Fig. S7 for assay schematic and control experiment). In D, *P < 0.05 between trisome and average control, Student’s t test. (E) The consequences of trisomy 21 in human cells are driven by gene- and aneuploidy-driven phenotypes.

References

    1. Nagaoka S. I., Hassold T. J., Hunt P. A., Human aneuploidy: Mechanisms and new insights into an age-old problem. Nat. Rev. Genet. 13, 493–504 (2012). - PMC - PubMed
    1. Hassold T. J., Jacobs P. A., Trisomy in man. Annu. Rev. Genet. 18, 69–97 (1984). - PubMed
    1. Antonarakis S. E., Lyle R., Dermitzakis E. T., Reymond A., Deutsch S., Chromosome 21 and down syndrome: From genomics to pathophysiology. Nat. Rev. Genet. 5, 725–738 (2004). - PubMed
    1. Antonarakis S. E., et al. ., Down syndrome. Nat. Rev. Dis. Primers 6, 9 (2020). - PMC - PubMed
    1. Naylor R. M., van Deursen J. M., Aneuploidy in cancer and aging. Annu. Rev. Genet. 50, 45–66 (2016). - PMC - PubMed

Publication types

LinkOut - more resources