. 2021 Feb 9;118(6):e2018093118.
doi: 10.1073/pnas.2018093118.

Data integration enables global biodiversity synthesis

Affiliations

Data integration enables global biodiversity synthesis

J Mason Heberling et al. Proc Natl Acad Sci U S A. .

Abstract

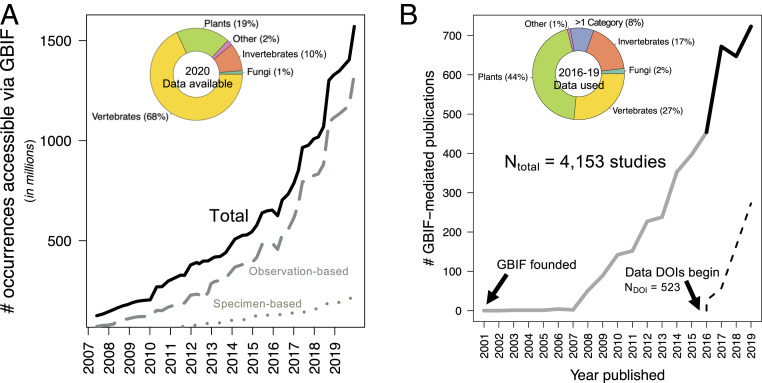
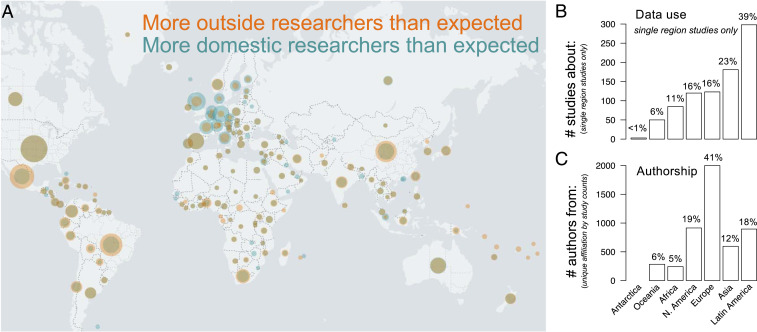
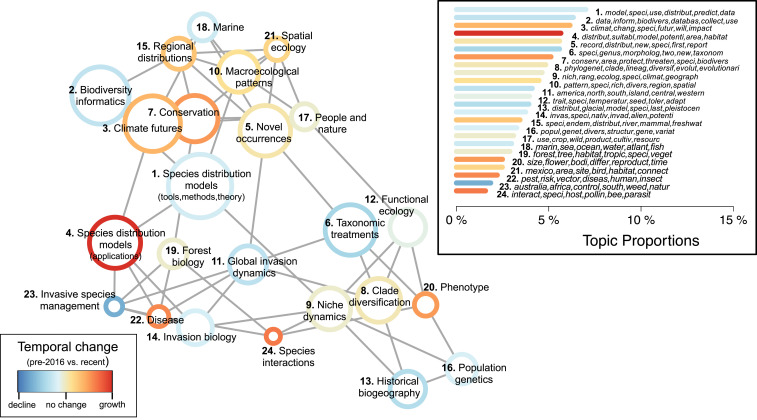
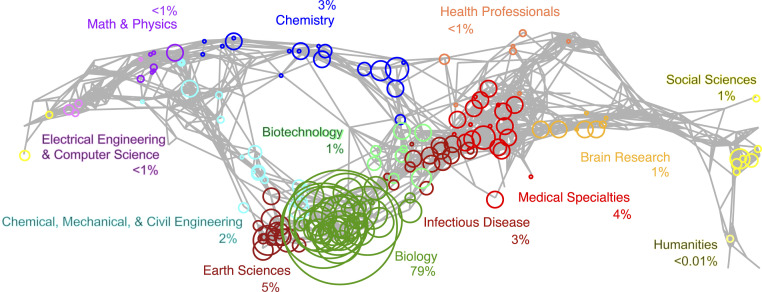
The accessibility of global biodiversity information has surged in the past two decades, notably through widespread funding initiatives for museum specimen digitization and emergence of large-scale public participation in community science. Effective use of these data requires the integration of disconnected datasets, but the scientific impacts of consolidated biodiversity data networks have not yet been quantified. To determine whether data integration enables novel research, we carried out a quantitative text analysis and bibliographic synthesis of >4,000 studies published from 2003 to 2019 that use data mediated by the world's largest biodiversity data network, the Global Biodiversity Information Facility (GBIF). Data available through GBIF increased 12-fold since 2007, a trend matched by global data use with roughly two publications using GBIF-mediated data per day in 2019. Data-use patterns were diverse by authorship, geographic extent, taxonomic group, and dataset type. Despite facilitating global authorship, legacies of colonial science remain. Studies involving species distribution modeling were most prevalent (31% of literature surveyed) but recently shifted in focus from theory to application. Topic prevalence was stable across the 17-y period for some research areas (e.g., macroecology), yet other topics proportionately declined (e.g., taxonomy) or increased (e.g., species interactions, disease). Although centered on biological subfields, GBIF-enabled research extends surprisingly across all major scientific disciplines. Biodiversity data mobilization through global data aggregation has enabled basic and applied research use at temporal, spatial, and taxonomic scales otherwise not possible, launching biodiversity sciences into a new era.

Keywords: Global Biodiversity Information Facility (GBIF); biodiversity informatics; biological collections; community science; scientometrics.


Conflict of interest statement

Competing interest statement: GBIF opened a call for proposals to carry out a contracted analysis of scientific research published based on GBIF-mediated data in 2016 to 2019. J.M.H. was selected to carry out and lead author this study; J.T.M., D.N., and D.S. are employees of GBIF. GBIF as a funder of the study took part in scoping and setting the study goals, but had no influence on study analysis, results, or conclusions.

Figures

Fig. 1.
Fig. 1.
Growth over time of the biodiversity occurrence data accessible via the Global Biodiversity Information Facility (GBIF) (A) and peer-reviewed articles using these data (B). Occurrence data (solid line in A) is further broken into observation-based records (dashed) and museum specimen-based records (dotted). Pie charts illustrate proportional taxonomic representation in GBIF datasets as of July 2020 (A) and corresponding representation of data use in recently published articles (2016 to 2019; solid black line) (B). “Other” refers to organismal groups not included in other categories (A and B). “>1 category” refers to data use of multiple organismal groups (B). Citable digital object identifiers (DOIs) were provided with each GBIF data download since 2016 (dash line in B).
Fig. 2.
Fig. 2.
Geography of GBIF data use and authorship. World map (A) highlights disparities between country-level biodiversity data use and author affiliation. The map overlays two normalized datasets: orange circles indicate country-level biodiversity data use, and teal circles indicate country-level author affiliations. Circle sizes are proportional to the maximum value in each dataset. Researcher affiliation (teal) is overlaid atop research coverage (orange), mixing to form brown where they overlap. Wider teal rings indicate disproportionately higher number of researchers than research specific to that country (e.g., United Kingdom), whereas wider orange rings (e.g., Mexico) indicate the opposite. Brown circles with no external rings indicate a proportionally similar number of studies about a given country to authors from a given country (e.g., United States). Bar charts show the corresponding frequency of studies published in 2016 to 2019 about a specific region, excluding global studies (B) and the frequency of authorship from each region (C; unique country-level affiliation by study counts). GBIF regions follow ref. .
Fig. 3.
Fig. 3.
Structural topic model results from 4,035 studies that used GBIF-mediated data published from 2003 to 2019. Topic correlations network visualizes quantitative associations between topics (nodes), with topics near each other and connected by a gray line more likely to appear together in a given study. Node color denotes the relative change in prevalence over time within each topic, comparing topic prevalence in earlier studies (2003 to 2015) to those recently published (2016 to 2019). Node sizes are proportional to overall topic proportions. Network graphed using the Fruchterman–Reingold algorithm. (Inset) Bar chart of topic proportions across all years, indicating the percentage of the total corpus that belongs to each topic, with topic numbers corresponding to topic names in network graph and bar color corresponding to temporal change. The top six words by probability associated with each topic are given in italics (SI Appendix, Table S1).
Fig. 4.
Fig. 4.
The GBIF map of science, visualizing the network of interdisciplinary knowledge facilitated through GBIF-mediated data in the context of a broader research landscape. The reference base map (gray lines), the UCSD map of science (36), displays a network of >25,000 journals classified across 554 subdisciplines (nodes), grouped into 13 primary disciplines (colors). Circles illustrate GBIF-mediated studies (2003–2019) centered on subdiscipline node assignments with circle size proportion to number of studies. Note that only GBIF-mediated studies published in journals in UCSD map of science are included (2,810 articles, 548 journals). Map is a 2D projection of a spherical 3D layout (i.e., the right and left of map connect) and produced using the Sci2 Tool (61).

References

    1. Ceballos G., et al. ., Accelerated modern human-induced species losses: Entering the sixth mass extinction. Sci. Adv. 1, e1400253 (2015). - PMC - PubMed
    1. IPBES , Summary for policymakers of the global assessment report on biodiversity and ecosystem services of the Intergovernmental Science-Policy Platform on Biodiversity and Ecosystem Services. 10.5281/zenodo.3553579. Accessed 10 June 2020. - DOI
    1. Proença V., et al. ., Global biodiversity monitoring: From data sources to essential biodiversity variables. Biol. Conserv. 213, 256–263 (2017).
    1. Wilkinson M. D., et al. ., The FAIR guiding principles for scientific data management and stewardship. Sci. Data 3, 160018 (2016). - PMC - PubMed
    1. König C., et al. ., Biodiversity data integration-the significance of data resolution and domain. PLoS Biol. 17, e3000183 (2019). - PMC - PubMed

Publication types