. 2021 Feb 9;118(6):e2018234118.
doi: 10.1073/pnas.2018234118.

Identifying hydrophobic protein patches to inform protein interaction interfaces

Affiliations

Identifying hydrophobic protein patches to inform protein interaction interfaces

Nicholas B Rego et al. Proc Natl Acad Sci U S A. .

Abstract

Interactions between proteins lie at the heart of numerous biological processes and are essential for the proper functioning of the cell. Although the importance of hydrophobic residues in driving protein interactions is universally accepted, a characterization of protein hydrophobicity, which informs its interactions, has remained elusive. The challenge lies in capturing the collective response of the protein hydration waters to the nanoscale chemical and topographical protein patterns, which determine protein hydrophobicity. To address this challenge, here, we employ specialized molecular simulations wherein water molecules are systematically displaced from the protein hydration shell; by identifying protein regions that relinquish their waters more readily than others, we are then able to uncover the most hydrophobic protein patches. Surprisingly, such patches contain a large fraction of polar/charged atoms and have chemical compositions that are similar to the more hydrophilic protein patches. Importantly, we also find a striking correspondence between the most hydrophobic protein patches and regions that mediate protein interactions. Our work thus establishes a computational framework for characterizing the emergent hydrophobicity of amphiphilic solutes, such as proteins, which display nanoscale heterogeneity, and for uncovering their interaction interfaces.

Keywords: PPI; dewetting; hydration; hydrophobicity; proteins.


Conflict of interest statement

The authors declare no competing interest.

Figures

Fig. 1.
Fig. 1.
Identifying protein patches that mediate its interactions. (A) The atoms of TS that participate in the formation of an obligate homodimer are projected onto a TS monomer. Although the knowledge of such interaction interfaces is desirable, it is unavailable for most proteins. (B and C) Protein structures provide access to the nanoscale chemical and topographical patterns displayed by the protein; however, using this information to predict the protein patches that mediate its interactions is nontrivial. Such patterns are shown here for the TS protein, wherein each residue is colored according to its overall chemistry (B) and each atom is colored using the Kapcha–Rossky classification (42) (C).
Fig. 2.
Fig. 2.
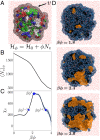
Disrupting protein–water interactions using ϕ-ensemble simulations. (A) The hydration shell, v, of the TS protein is shown (transparent gray). The protein surface is colored by residue (as in Fig. 1B), the waters in v are shown in licorice, and the rest are shown as lines. In ϕ-ensemble simulations, an unfavorable biasing potential, ϕNv, is applied to the Nv waters in v. (B) As the strength of the potential ϕ is increased, the average number of waters, Nvϕ, decreases in a sigmoidal manner. (C) The corresponding susceptibility, χv=Nvϕ/(βϕ), displays a peak at βϕ*=2.16 (diamond), highlighting that dewetting of the protein hydration shell is collective. The potential strengths that mark the onset ϕ() (left triangle) and the end ϕ(+) (right triangle) of the peak in χv are also shown. (D) Simulation snapshots are shown for ϕ ensembles corresponding to βϕ=1.8 (Top), βϕ=2.4 (Middle), and βϕ=3.0 (Bottom). Protein atoms are shown in surface representation (black), hydration waters as licorice, and the rest as lines. The waters in v are surrounded by a blue mesh, whereas cavities are shown using an orange mesh.
Fig. 3.
Fig. 3.
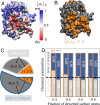
Uncovering hydrophobic protein patches by identifying regions that dewet in ϕ-ensemble simulations. (A) Snapshot of the TS protein is shown with every protein heavy atom, i, colored according to the average water density, ρiϕ, in its hydration shell at βϕ=2.4; dewetted atoms are colored red, whereas atoms that remain hydrated are colored blue. (B) Protein atoms for which ρiϕ falls below a threshold, s=0.5, are considered to be dewetted and are shown in orange; the rest are shown in gray. (C) Protein atoms are categorized according to whether they dewet (orange fill) or not (gray fill) at βϕ=2.4, as well as whether they are nonpolar (white outline) or polar/charged (blue outline) according to the Kapcha–Rossky classification (42). Interestingly, only 60% of the dewetted protein atoms (orange fill) are nonpolar (white outline), whereas the remaining 40% of the atoms are polar/charged (blue outline). (D) As ϕ is increased and a larger fraction of the protein surface dewets, the hydrophobic (dewetted) and hydrophilic (wet) protein regions remain heterogeneous and have chemical compositions that are remarkably similar; the dashed line represents the overall composition of the protein surface.
Fig. 4.
Fig. 4.
Protein hydrophobicity informs protein-interaction interfaces. (A) Schematic (Upper) and TS protein structure (Lower) highlighting protein atoms (purple) which participate in the formation of the TS homodimer and those that don’t (gray). (B) Schematic (Upper) and TS protein structure (Lower) showing protein atoms that are dewetted at βϕ=2.4 (orange) and those that remain wet (gray). (C) By comparing dewetted protein atoms against those belonging to the interaction interface (contacts), we identify protein contacts that dewet (TP; pink) and those that remain wet (FN; dark purple), as well as noncontacts that dewet (FP; dark orange) and ones that stay wet (TN; gray). Schematic (Left) and TS protein structures (Right) illustrate such a comparison for βϕ=1.8,2.4, and 3. Very few atoms are dewetted at βϕ=1.8; consequently, much of the interaction interface remains wet (dark purple). In contrast, much of the protein surface is dewetted at βϕ=3, including several noncontacts (dark orange). The right balance between FNs and FPs is achieved at βϕ=2.4, where most of the contacts are dewetted, and most of the noncontacts remain wet. (D) Both the fraction of contacts that dewet (TPR) and the fraction of noncontacts that dewet (FPR) display a sigmoidal increase with increasing ϕ. (E) The ROC curve illustrates the variation of TPR with FPR; symbols correspond to ϕ-ensemble simulations, whereas the dashed line corresponds to nonpolar clusters (see Comparing Dewetted Atoms and Protein Contacts). (F) The harmonic average, dh, of TPR and 1FPR, shown as a function of ϕ, displays a peak at βϕopt=2.4 with a peak value, dhopt=0.71. In DF, the left triangle, diamond, cross, and right triangle symbols correspond to ϕ values of ϕ(), ϕ*, ϕopt, and ϕ(+), respectively.
Fig. 5.
Fig. 5.
Proteins that participate in the formation of homodimers and heterodimers. (A) The correspondence between hydrophobic protein patches that dewet in the ϕopt ensemble and protein-interaction interfaces is quantified by using dhopt; for the five proteins studied here, we find dhopt0.7. In each case, we further find that ϕoptϕ*; the optimal potential strength for uncovering the interaction interface is similar to the potential strength to which the protein hydration waters are most susceptible. (B) Protein atoms that dewet in the ϕopt ensemble are compared against protein contacts for the self-interacting MBP and MLT dimer, as well as for the MDM2 protein and UBQ, which interact with other proteins to form heterodimers. The color scheme used here is the same as in Fig. 4C. In each case, the center of the interaction interface tends to dewet (TPs; pink), whereas the periphery of the interface features FNs and FPs.

References

    1. Futran A. S., Link A. J., Seger R., Shvartsman S. Y., ERK as a model for systems biology of enzyme kinetics in cells. Curr. Biol. 23, R972–R979 (2013). - PMC - PubMed
    1. Thirumalai D., Reddy G., Straub J. E., Role of water in protein aggregation and amyloid polymorphism. Acc. Chem. Res. 45, 83–92 (2012). - PMC - PubMed
    1. Trevino S. R., Scholtz J. M., Pace C. N., Measuring and increasing protein solubility. J. Pharmacol. Sci. 97, 4155–4166 (2008). - PubMed
    1. Scott D. E., Bayly A. R., Abell C., Skidmore J., Small molecules, big targets: Drug discovery faces the protein-protein interaction challenge. Nat. Rev. Drug Discov. 15, 533–550 (2016). - PubMed
    1. Petta I., Lievens S., Libert C., Tavernier J., De Bosscher K., Modulation of protein-protein interactions for the development of novel therapeutics. Mol. Ther. 24, 707–718 (2016). - PMC - PubMed

Publication types

LinkOut - more resources