. 2021 Feb 1;12(1):727.
doi: 10.1038/s41467-020-20578-2.

Identification and analysis of splicing quantitative trait loci across multiple tissues in the human genome

Affiliations

Identification and analysis of splicing quantitative trait loci across multiple tissues in the human genome

Diego Garrido-Martín et al. Nat Commun. .

Abstract

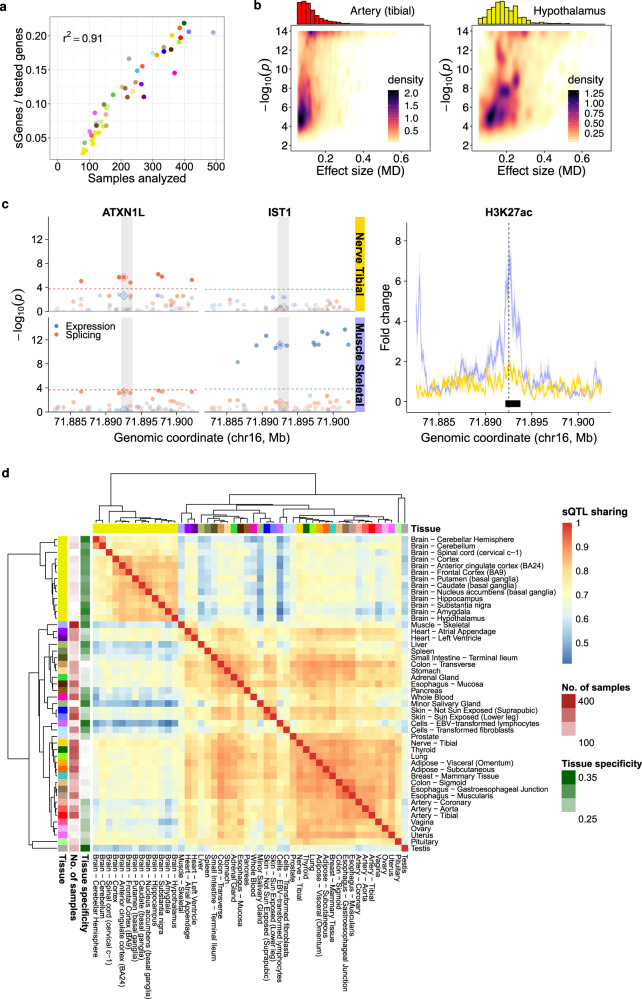
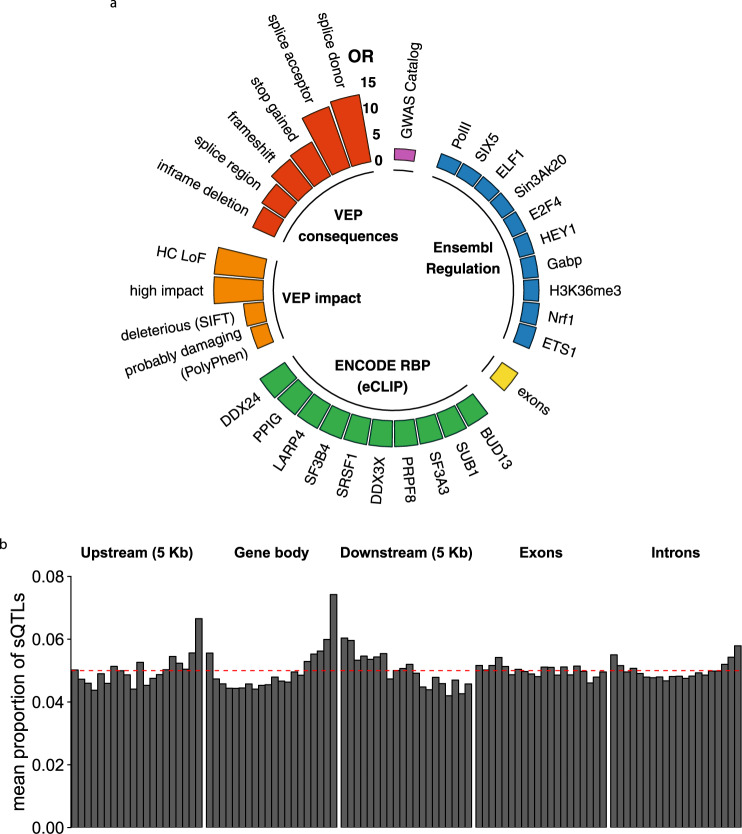
Alternative splicing (AS) is a fundamental step in eukaryotic mRNA biogenesis. Here, we develop an efficient and reproducible pipeline for the discovery of genetic variants that affect AS (splicing QTLs, sQTLs). We use it to analyze the GTEx dataset, generating a comprehensive catalog of sQTLs in the human genome. Downstream analysis of this catalog provides insight into the mechanisms underlying splicing regulation. We report that a core set of sQTLs is shared across multiple tissues. sQTLs often target the global splicing pattern of genes, rather than individual splicing events. Many also affect the expression of the same or other genes, uncovering regulatory loci that act through different mechanisms. sQTLs tend to be located in post-transcriptionally spliced introns, which would function as hotspots for splicing regulation. While many variants affect splicing patterns by altering the sequence of splice sites, many more modify the binding sites of RNA-binding proteins. Genetic variants affecting splicing can have a stronger phenotypic impact than those affecting gene expression.


Conflict of interest statement

The authors declare no competing interests.

Figures

Fig. 1
Fig. 1. sQTL example.
a Relative abundances of the three most expressed isoforms in the brain cortex from the gene RBM23 (chr14:23,369,854-23,388,393, reverse strand, RBM23-001, RBM23-002 and RBM23-003, all protein coding), for each genotype group at the rs2295682 locus (chr14:23,374,862, G/A in the reverse strand), represented as boxplots. RBM23 encodes for an RBP that may be itself involved in splicing. The least abundant isoforms are grouped in Others. The number of individuals in each genotype group is shown between parentheses. Individuals that are homozygous for the reference allele (GG) at the SNP locus, express preferentially RBM23-002 (blue), while they barely express RBM23-003 (red). In contrast, AA homozygous express preferentially RBM23-003 (red). Heterozygous individuals exhibit intermediate abundances. RBM23-001 (green) has similar levels in the three genotype groups. In boxplots, the box represents the first to third quartiles and the median, while the whiskers indicate ± 1.5 × interquartile range (IQR). Source data are provided as a Source Data file. b Exonic structure of the isoforms of RBM23. Compared to RBM23-001 (green), RBM23-002 (blue) lacks exon 6, and RBM23-003 (red), exons 4 and 6. A sashimi plot corresponding to the highlighted area displays the mean exon inclusion of exon 6 of RBM23 across all brain cortex samples of each genotype group at rs2295682. The plot was obtained using ggsashimi. The dotted vertical line marks the location of the SNP. The number of reads supporting exon skipping increases with the number of copies of the alternative allele A, matching the changes observed in isoform abundances. This allele has been previously associated with increased skipping of exon 6.
Fig. 2
Fig. 2. Overall results, heteropleiotropy and sQTL sharing across tissues.
a Proportion of sGenes (over tested genes) per tissue (y-axis) with respect to the tissue sample size (x-axis). Tissue color codes are shown in Supplementary Table 1. b For two tissues with markedly different sample sizes, such as tibial artery (left panel, n = 388 samples) and hypothalamus (right panel, n = 108 samples), we display the effect sizes (MD values, x-axis) of significant sQTLs vs the −log10 of their association p-value (Anderson test) with the target sGene (y-axis). The density of points is shown, together with the sQTL effect size distribution. Note that MD for sQTLs is bounded to [0.05, 1] (see Methods). c Example of a heteropleiotropic locus. The SNP rs8046859 (chr16:71,892,531, C/T) is an sQTL for the gene ATXN1L (chr16:71,879,894-71,919,171, forward strand) in Nerve Tibial (n = 361), but not in Muscle Skeletal (n = 491). The SNP is not an eQTL for ATXN1L in any of the two tissues. In contrast, the SNP is an eQTL for the gene IST1 (chr16:71,879,899-71,962,913, forward strand) in Muscle Skeletal, but not in Nerve Tibial. The SNP is not an sQTL for IST1 in any of the two tissues. In the left panel, the dots represent the −log10 p-values of association with the expression (two-sided t-test, blue) and splicing (Anderson test, red) of the two genes in the two tissues, for variants in a 20 Kb window centered at rs8046859 (the −log10 p-values corresponding to rs8046859 are highlighted by a diamond). The transparency of the dots depends on the −log10 p-value. The significance level for each molecular trait, gene and tissue is shown as a colored, horizontal dashed line. When this line is not present, the gene-level p-value is above the 0.05 FDR threshold and hence no variant is significantly associated with this molecular trait in this tissue (see Methods). The shaded area represents the position of a H3K27ac ChIP-seq peak (see below). The right panel shows the fold-change signal of the H3K27ac histone mark with respect to the input across ENTEx donors in Nerve Tibial and Muscle Skeletal, in the same genomic region of the left panel. The line and colored area correspond, respectively, to the mean fold-change signal and its standard error (SEM) across four ENTEx donors (i.e. mean ± SEM). The location of the SNP (vertical dashed line) and the overlapping ChIP-seq peak (intersection of the peaks in the four donors, black rectangle) are also displayed. d Heatmap of sQTL sharing across GTEx tissues. Sharing estimates (see Methods) range from 0 (low sharing, blue) to 1 (high sharing, red). In addition, hierarchical clustering of the tissues based on sQTL sharing is displayed, together with the tissue sample sizes and tissue specificity estimates. Source data for ad are provided as a Source Data file.
Fig. 3
Fig. 3. Functional enrichment and distribution of sQTLs.
a Top enrichments of sQTLs in functional annotations. The height of the bars represents the odds ratio (OR) of the observed number of sQTLs to the expected number of variants that are not sQTLs overlapping a given annotation (see Methods): Variant Effect Predictor (VEP) categories (red) and impact (orange), ENCODE RBP eCLIP peaks (green), exons of GENCODE v19 protein coding and lincRNA genes (yellow), Ensembl Regulatory Build elements (blue) and GWAS Catalog hits (purple). All these enrichments are significant at FDR < 0.05 and have OR confidence intervals not overlapping the range [1/1.50, 1.50]. b Distribution of the mean proportion of sQTLs along the gene bodies of sGenes, their upstream and downstream regions, introns and exons. The red dashed line represents the expected distribution under a uniform model (see Methods). Source data for both a and b are provided as a Source Data file.
Fig. 4
Fig. 4. Impact of sQTLs on splice sites and RBP binding sites.
a Distribution of the absolute change in splice site strength for sQTLs with low, moderate and high effect sizes (MD value). b Distribution of the absolute deltaSVM value (∣deltaSVM∣) of sQTLs and non-sQTLs, for RBPs with significantly different mean ∣deltaSVM∣ between sQTLs and non-sQTLs (two-sided Wilcoxon Rank-Sum test, FDR < 0.05, total sample size for each test listed as follows: nRBFOX2 = 509, nPRPF8 = 1,133, nGTF2F1 = 376, nSF3B4 = 595, nGRWD1 = 736, nPPIG = 691, nGEMIN5 = 345, nCSTF2T = 1,170, nRBM15 = 373 and nXRN2 = 450). Data is shown as boxplots, where the box represents the first to third quartiles and the median, and the whiskers indicate ± 1.5 × interquartile range (IQR). c Modification of the binding sites of the RBPs RBFOX2 (left) and PRPF8 (right) by SNPs rs4959783 (chr6:3,260,093, G/A, ∣deltaSVM∣ = 2.48) and rs9876026 (chr3:11,849,807, T/G in the reverse strand, ∣deltaSVM∣ = 4.77), respectively. The lines represent the gkm-SVM scores of all possible (overlapping) 10-mers in a 100 bp window around the SNP. Those corresponding to the 10-mers overlapping the SNP are colored according to the allele. SNP positions are marked with a dashed line. The gray area includes the 90% middle gkm-SVM scores of 10-mers not overlapping the variant. The relative location of the predicted RBP motifs and the corresponding sequence logos are also displayed. In the logos, the SNP position is marked with an asterisk. Source data for ac are provided as a Source Data file.
Fig. 5
Fig. 5. sQTLs and GWAS.
a Multidimensional scaling-based representation of the semantic dissimilarities between GWAS traits and diseases whose associated variants are enriched among sQTLs with respect to non-sQTLs (two-sided Fisher’s exact test FDR < 0.05). Each GWAS term is represented by a dot, whose size corresponds to the enrichment odds ratio (OR), and its color to the Experimental Factor Ontology (EFO) parent category the term belongs to. GWAS terms that lie close to each other are semantically similar. Eight representative traits with available summary statistics are highlighted. To help visualization, only the labels for the non-redundant, confidently and highly enriched terms are displayed (p-value < 10−8, lower bound of the 95% confidence interval (CI) for the OR estimate > 1.5, width of the 95% CI for the OR estimate below the median). b Maximum likelihood estimates and 95% CIs (shown as dots and error bars, respectively) for the GWAS association effect size of variants affecting splicing (S), and variants affecting expression, but not splicing (E), for eight traits and diseases. c Quantile-quantile plot of p-values for association with asthma in for sQTLs (black dots), eQTLs without effects on splicing (blue line and area), and variants with effects neither on expression nor on splicing (black line and gray area). Lines and colored areas represent, respectively, medians and middle 95% observed −log10 p-values across 10,000 random samplings from the corresponding variant set, with the same size as the sQTL set. The identity line is shown in red. d p-values for association with asthma in (left y-axis) of variants in the region chr17:38,010,000-38,130,000, around the GSDMB gene (highlighted). The larger dots correspond to variants identified as sQTLs for the GSDMB gene in the lung. Linkage disequilibrium patterns (color-coded) and recombination rates are also displayed. The lower panels represent the location of RBP eCLIP peaks, H3K36me3 marked-regions and other GWAS Catalog associations with asthma (shown as arrows). The highlighted variant (rs2305480) is in perfect LD with rs11078928, previously shown to have an impact on GSDMB splicing. Source data for ad are provided as a Source Data file.

References

    1. Nilsen TW, Graveley BR. Expansion of the eukaryotic proteome by alternative splicing. Nature. 2010;463:457–463. doi: 10.1038/nature08909. - DOI - PMC - PubMed
    1. Keren H, Lev-Maor G, Ast G. Alternative splicing and evolution: diversification, exon definition and function. Nat. Rev. Genet. 2010;11:345–55. doi: 10.1038/nrg2776. - DOI - PubMed
    1. Scotti MM, Swanson MS. RNA mis-splicing in disease. Nat. Rev. Genet. 2016;17:19–32. doi: 10.1038/nrg.2015.3. - DOI - PMC - PubMed
    1. Chen M, Manley JL. Mechanisms of alternative splicing regulation: insights from molecular and genomics approaches. Nat. Rev. Mol. Cell Biol. 2009;10:741–754. doi: 10.1038/nrm2777. - DOI - PMC - PubMed
    1. Fu X-D, Ares M. Context-dependent control of alternative splicing by RNA-binding proteins. Nat. Rev. Genet. 2014;15:689–701. doi: 10.1038/nrg3778. - DOI - PMC - PubMed

Publication types