Observational Study
. 2021 Feb 1;12(1):721.
doi: 10.1038/s41467-021-21057-y.

Asymmetric thinning of the cerebral cortex across the adult lifespan is accelerated in Alzheimer's disease

Collaborators, Affiliations
Observational Study

Asymmetric thinning of the cerebral cortex across the adult lifespan is accelerated in Alzheimer's disease

James M Roe et al. Nat Commun. .

Erratum in

Abstract

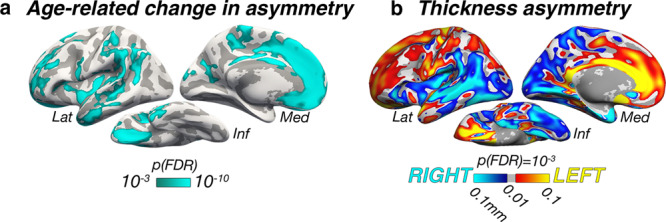
Aging and Alzheimer's disease (AD) are associated with progressive brain disorganization. Although structural asymmetry is an organizing feature of the cerebral cortex it is unknown whether continuous age- and AD-related cortical degradation alters cortical asymmetry. Here, in multiple longitudinal adult lifespan cohorts we show that higher-order cortical regions exhibiting pronounced asymmetry at age ~20 also show progressive asymmetry-loss across the adult lifespan. Hence, accelerated thinning of the (previously) thicker homotopic hemisphere is a feature of aging. This organizational principle showed high consistency across cohorts in the Lifebrain consortium, and both the topological patterns and temporal dynamics of asymmetry-loss were markedly similar across replicating samples. Asymmetry-change was further accelerated in AD. Results suggest a system-wide dedifferentiation of the adaptive asymmetric organization of heteromodal cortex in aging and AD.


Conflict of interest statement

The authors declare no competing interests.

Figures

Fig. 1
Fig. 1. Samples and analysis method.
a Age-distribution of the LCBC discovery sample. b Age-distributions of the four replication samples. Colors in (a, b) highlight the number of longitudinal scans available per sample (i.e., dark green denotes subjects with only one timepoint, light green denotes subjects with two timepoints, blue denotes subjects with more than two timepoints; stacked bars). The number of unique subjects (N) is given in total and per number of available timepoints. The total number of scan observations (obs) is given per cohort. c Spherical surface rendering of a nonsymmetrical (top) compared to the symmetrical template (bottom) used in the present study. Mean sulcal topography of the left and right hemispheres is shown in yellow and orange, respectively. Note the near-perfect alignment of left- and right-hemisphere topography on the symmetrical surface. d Visualization of asymmetry analysis at an example vertex (black circle). GAMMs were used to compute the zero-centered (i.e., demeaned) age trajectories of the left [s(LH-Age)] and right [s(RH-Age)] hemisphere at every vertex. Blue and yellow lines indicate the smooth age trajectory of mean cortical thickness for the left and right hemisphere, respectively, after each has been demeaned. The difference between these (green line) depicts the asymmetry trajectory [s(LH-Age)-s(RH-Age)] that was used for assessment of age-change in asymmetry, equivalent to the GAMM interaction term. Ribbons depict SEM. Significant asymmetry trajectories were downsampled to a lower resolution template (fsaverage5; N vertices = 10,242) and a dissimilarity matrix based on the distance between trajectories at every vertex pair (computed by sum of least squares) was obtained and submitted to partition around medoids (PAM) clustering. e Mean silhouette width was used to determine the optimal partition number. LH left hemisphere, RH right hemisphere.
Fig. 2
Fig. 2. Vertex-wise GAMM effects.
a Significance map for age-related changes in asymmetry in the LCBC discovery sample (2577 observations; Age × Hemisphere GAMM interaction; one-sided F-test). b Mean thickness asymmetry for the discovery sample, irrespective of age (main effect of Hemisphere; two-sided test). Only regions showing significant asymmetry are shown. Warm and cold colors indicate leftward and rightward thickness asymmetry (mm), respectively. Maps in (a, b) are corrected for multiple comparisons using false discovery rate (FDR) at p(FDR) < 0.001. Lat lateral, Med medial, Inf inferior.
Fig. 3
Fig. 3. Clustered trajectories.
a PAM clustering solutions for asymmetry trajectories in the LCBC discovery sample. Each colored line represents a vertex (N = number of vertices within each solution). Mean trajectories are in gray. Vertices showing leftward asymmetry in early adult life (higher than dotted line) typically exhibit loss of leftward asymmetry with age (blue plot), whereas vertices showing rightward asymmetry (lower than dotted line) typically exhibit loss of rightward asymmetry (yellow plot). Importantly, because asymmetry trajectories were computed as the difference between zero-centered hemispheric trajectories [s(LH-Age)-s(RH-Age)] (cf. Fig. 1d), mean differences between LH and RH thickness (i.e., mean asymmetry/the intercept) are not taken into account and do not influence the clustering. For visualization of the absolute asymmetry trajectories we added the main effect of Hemisphere, vertex-wise, and computed the mean asymmetry trajectory of vertices in each clustering solution. b Standard deviations (SD) of the asymmetry trajectories for the clustering solutions. c Solutions mapped on the surface. d Thinning trajectories plotted separately for LH and RH in regions derived from the clustering (numbered 1–8). Colors correspond to the solutions in (a), and darker shades indicate LH trajectories. All trajectories were fitted using GAMMs. Data are residualized for sex, scanner, and random subject intercepts. Trajectories depict mean thickness and ribbons depict 95% confidence intervals. Smaller plots illustrate percentage change with age for each region. As outliers were removed on a region-wise basis (see “Methods”), the number of observations underlying plots 1–8 is: 5150, 5154, 5148, 5152, 5150, 5150, 5148, 5154, respectively. LH left hemisphere, RH right hemisphere, Lat lateral, Med medial, Inf inferior.
Fig. 4
Fig. 4. Replication.
a PAM clustering solutions of asymmetry trajectories in the four replication samples (depicted row-wise). Each colored line represents a vertex (N = number of vertices within each solution). Mean trajectories are in gray. In three out of four samples, the clustering solutions were highly similar to the discovery sample (cf. Fig. 3 and Supplementary Fig. 5). b Standard deviations (SD) of the asymmetry trajectories for the clustering solutions. c Solutions mapped on the surface. All trajectories were fitted using GAMMs. LH left hemisphere, RH right hemisphere.
Fig. 5
Fig. 5. Longitudinal AD analysis.
Thickness asymmetry change in AD versus healthy aging in the AIBL clinical dementia sample. a x-axis denotes study timepoints. Single-timepoint diagnoses (y-axis; NC normal controls, MCI mild cognitive impairment, AD Alzheimer’s disease) were used to define two longitudinal Groups of AD and NC individuals. Each line represents a subject and the color denotes longitudinal group membership (AD-long, in green; NC-long, in gold). AD-long individuals were diagnosed with AD by their final timepoint, whereas NC-long individuals were classified as healthy at every timepoint. Note that single-timepoint MCI diagnoses were considered only for the purpose of defining the longitudinal AD group (see “Methods”). b LME interaction between Group × Time (years) since baseline measurement upon asymmetry in clustering-derived ROI’s (AD-long, N = 41, obs = 110; NC-long, N = 128, obs = 435; two-sided test). Colored lines depict mean thickness asymmetry (LH–RH) per group and ribbons depict 95% confidence intervals. Accelerated change in asymmetry was observed in the AD group in frontal and anterior temporal cortical ROI’s. Results were corrected for multiple comparisons using FDR. Significant FDR-corrected p values are shown on plots (*p(FDR) < 0.05; ** <0.01; see Supplementary Table 6). LH left hemisphere, RH right hemisphere.

References

    1. Damoiseaux JS. Effects of aging on functional and structural brain connectivity. Neuroimage. 2017;160:32–40. - PubMed
    1. Fjell AM, Walhovd KB. Structural brain changes in aging: courses, causes and cognitive consequences. Rev. Neurosci. 2010;221:187–221. - PubMed
    1. Koen JD, Hauck N, Rugg MD. The relationship between age, neural differentiation, and memory performance. J. Neurosci. 2019;39:1498–1418. - PMC - PubMed
    1. Cassady K, Ruitenberg MFL, Reuter-lorenz PA, Tommerdahl M, Seidler RD. Neural dedifferentiation across the lifespan in the motor and somatosensory systems. Cereb. Cortex. 2020;30:1–13. - PMC - PubMed
    1. Park J, et al. Neural broadening or neural attenuation? Investigating Age-related dedifferentiation in the face network in a large lifespan sample. J. Neurosci. 2012;32:2154–2158. - PMC - PubMed

Publication types