. 2021 Feb 1;12(1):724.
doi: 10.1038/s41467-020-20639-6.

A glucose meter interface for point-of-care gene circuit-based diagnostics

Affiliations

A glucose meter interface for point-of-care gene circuit-based diagnostics

Evan Amalfitano et al. Nat Commun. .

Abstract

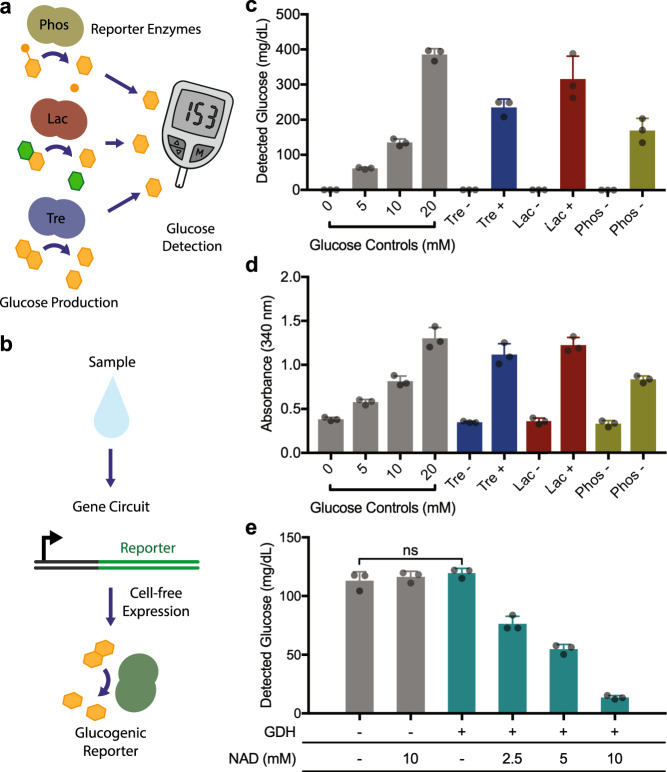
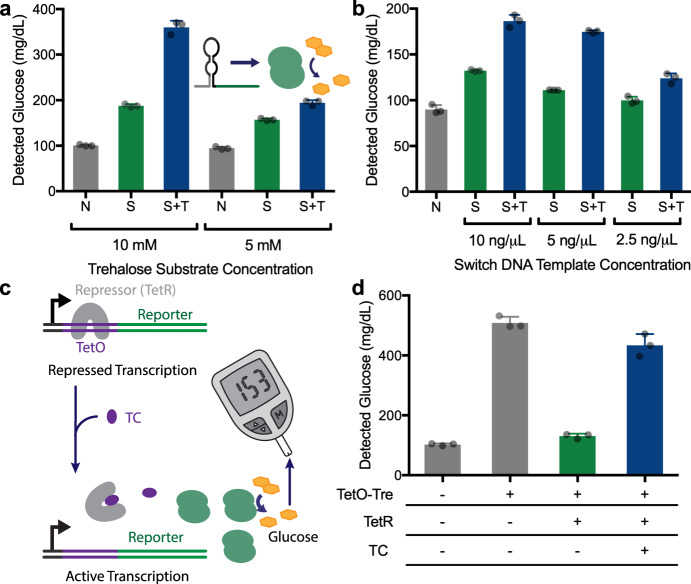
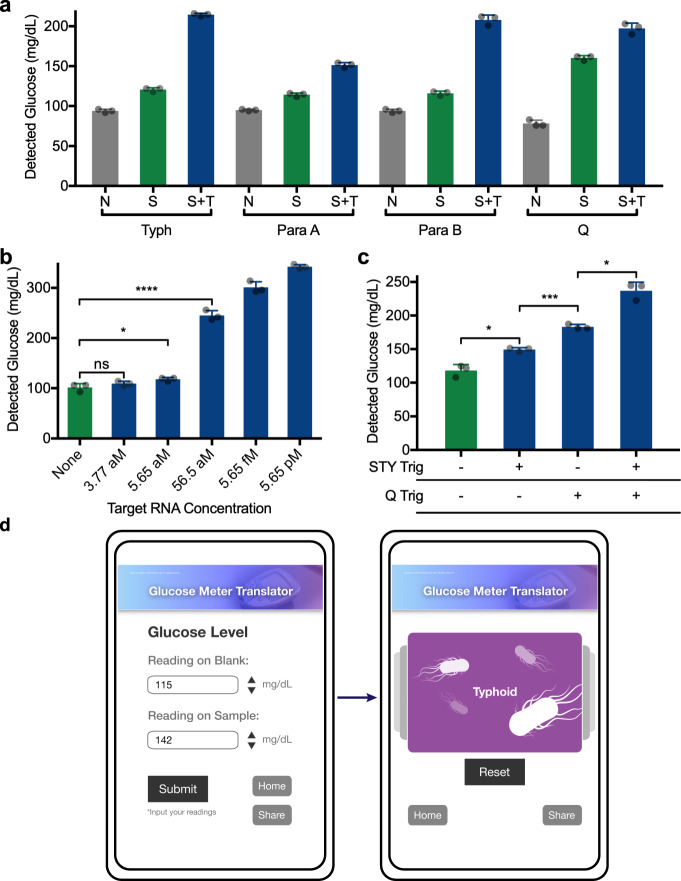
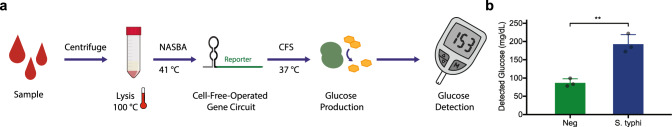
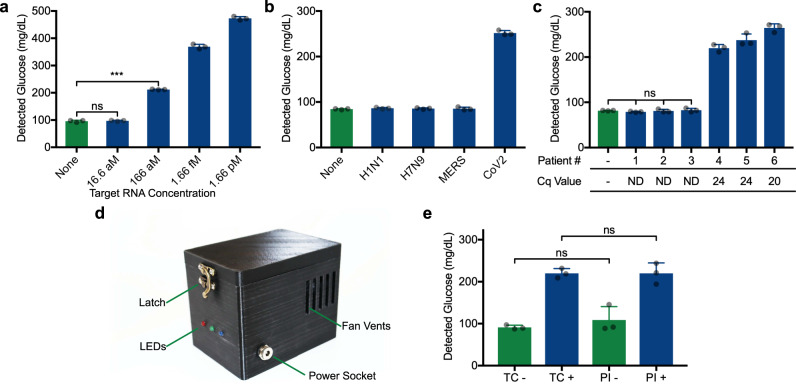
Recent advances in cell-free synthetic biology have given rise to gene circuit-based sensors with the potential to provide decentralized and low-cost molecular diagnostics. However, it remains a challenge to deliver this sensing capacity into the hands of users in a practical manner. Here, we leverage the glucose meter, one of the most widely available point-of-care sensing devices, to serve as a universal reader for these decentralized diagnostics. We describe a molecular translator that can convert the activation of conventional gene circuit-based sensors into a glucose output that can be read by off-the-shelf glucose meters. We show the development of new glucogenic reporter systems, multiplexed reporter outputs and detection of nucleic acid targets down to the low attomolar range. Using this glucose-meter interface, we demonstrate the detection of a small-molecule analyte; sample-to-result diagnostics for typhoid, paratyphoid A/B; and show the potential for pandemic response with nucleic acid sensors for SARS-CoV-2.


Conflict of interest statement

The Governing Council of the University of Toronto has filed a patent application covering the invention of the gene circuit-glucose meter interface with inventors Evan Amalfitano, Margot Karlikow and Keith Pardee (International application number PCT/CA2018/051646, provisional status). Arizona State University has filed a patent application covering the invention of the SARS-CoV-2 sensors with Masoud Norouzi, Margot Karlikow, Alexander Green and Keith Pardee (US patent number 63/038,609, provisional status). The remaining authors declare no competing interests.

Figures

Fig. 1
Fig. 1. Development of a glucose meter interface for cell-free, gene circuit-based sensors.
a Concept schematic of glucose generation by reporter enzymes upon the activation of gene circuit sensors. b Expression of different reporter enzymes can be used to generate glucose using their respective substrates. c Using a glucose meter for measurement, glucose is generated from the expression of three enzymes: trehalase (Tre), lactase (Lac), phosphatase (Phos). 5 ng/µL plasmid DNA used for expression, reactions incubated for 16 h. Control reactions (-) were identical, but lacked DNA encoding an enzyme. d Cell-free protein expression reactions were also analyzed for glucose production using a colorimetric GDH-NAD absorbance-based assay. e Using the expression of GDH and a titration of NAD concentration, glucose can be selectively removed from samples. Negative controls (−), without GDH and/or NAD, show no background glucose degradation. GDH DNA added to 10 ng/µL. All data presented are the mean of N = 3 independent experiments (as indicated by dot plots) ±SD. Statistical analysis: one-way ANOVA, ns = not significant. Source data are provided as a Source Data file.
Fig. 2
Fig. 2. Demonstration of gene circuit-based sensors linked to a glucose output.
a Effect of trehalose substrate concentration on glucose output levels in a blank CFS reaction (N, negative control), or reactions with toehold switch-regulated glucose production in the absence (S, switch only) or presence (S + T, switch and trigger) of the corresponding trigger RNA. Switch and trigger added to 10 ng/µL DNA. N = 3 biological replicates, error bars represent mean ± SD. b Effect of different switch DNA template concentrations on glucose output in the absence (S, switch only) or presence (S + T, switch and trigger) of the corresponding trigger, shown with a CFS without any added DNA (N, negative control) for background comparison. Trehalose present at 5 mM. c Schematic of an alternative gene circuit for small molecule detection, based on the TetO/TetR inducible system. The repressor element regulates trehalase expression in response to tetracycline. d Demonstration of the system shown in c in practice. As seen in the control reactions, TetO-Tre expression results in high glucose production in the absence of both TetR and tetracycline (TC). With the addition of the TetR, glucose production is reduced to near background levels. The addition of both TetR and tetracycline, however, results in a significant increase in glucose output levels. All data presented are the mean of N = 3 independent experiments (as indicated by dot plots) ±SD Source data are provided as a Source Data file.
Fig. 3
Fig. 3. Demonstration of typhoid- and paratyphoid-specific toehold switches.
a Glucose output from the detection of RNA sequences related to typhoid (Typh), paratyphoid A (Para A), paratyphoid B (Para B), and fluoroquinolone resistance (Q). CFS background (N, no switch/trigger), switch alone (S, no trigger), and switch with target (S + T) are shown for each experiment. Typh, Para A, Para B switches at 312.5 pg/µL and targets at 50 nM. Q switch at 1.25 ng/µL and target at 100 nM. For each set 3 technical replicates are shown, representative of 3 independent experiments. b NASBA amplification of STY RNA at the given initial concentrations followed by glucose generation reaction. Typh switch at 1.25 ng/µL. *p = 0.0460; ****p < 0.0001. 3 technical replicates are shown, representative of 3 independent experiments. c RNA target(s) corresponding to typhoid (“STY”) and fluoroquinolone resistance (“Q”) were first amplified in a combined NASBA reaction, followed by multiplexed glucose reactions containing trehalase switches for both targets. Typh switch at 1.25 ng/µL, Q at 2.5 ng/µL. *: STY Trig vs. None p = 0.0180, STY Trig + Q Trig vs. Q Trig p = 0.0128; ***p = 0.0003. d Web-based interface for automated interpretation of the multiplexed diagnostic data presented in c. The user inputs the glucose measurements for a negative control and their experimental sample. Following submission, the website compares the data with known results to provide an interpretation of results (here typhoid positive). ns: not significantly different. All data are presented as mean values ± SD. Source data are provided as a Source Data file.
Fig. 4
Fig. 4. Detection of S. typhi using the STY-specific toehold switch.
a Schematic of the workflow used for detection of S. typhi from serum-containing mock samples (7% FBS). b Detection of S. typhi cells using this workflow from the serum-containing input with 103 CFU/mL. Typh switch at 1.25 ng/µL. **p = 0.0097. Data presented is the mean of N = 3 independent experiments (as indicated by dot plots) ±SD Source data are provided as a Source Data file.
Fig. 5
Fig. 5. Demonstration of the SARS-CoV-2 gene N sensor coupled to glucose meter detection.
a Assay sensitivity (using N3 B toehold switch) demonstrated with purified viral RNA. The concentration indicated reflects the viral RNA concentration of the 1 µL aliquot added to NASBA reactions prior to glucose generation. ***p = 0.0001. b The SARS-CoV-2 gene N sensor (N3 B) specificity was tested using viral RNA genomes isolated from influenza A subtypes H1N1 and H7N9, MERS and SARS-CoV-2 using an initial RNA concentration of 1.66 pM. c Sensor N3 B performance upon exposure to RNA extracted from 6 different patient samples (3 SARS-CoV-2 positive and 3 negative patients) assayed with glucose-based sensor. Switch DNA template present at 1.25 ng/µL. Neg: no RNA sample added to NASBA. Cq values from the parallel RT-qPCR assay of these sample listed on the x-axis. ND: not detected. d Companion portable incubator. This device is capable of facilitating the experiment in place of a thermocycler. e Using sensor N3 B, direct comparison between the thermocycler (TC) and portable incubator (PI). SARS-CoV-2 RNA was added to positive (+) reactions at 1.66 pM. For c, statistical analysis is one-way ANOVA. a and b are comprised of 3 technical replicates, representative of 3 independent experiments. e is comprised of 3 biological replicates. ns: not significantly different. Data are presented as mean values ± SD. Source data are provided as a Source Data file.

References

    1. Pardee K. Perspective: solidifying the impact of cell-free synthetic biology through lyophilization. Biochem. Eng. J. 2018;138:91–97. doi: 10.1016/j.bej.2018.07.008. - DOI - PMC - PubMed
    1. Bowie JU, et al. Synthetic biochemistry: the bio-inspired cell-free approach to commodity chemical production. Trends Biotechnol. 2020;38:766–778. doi: 10.1016/j.tibtech.2019.12.024. - DOI - PubMed
    1. Wu M-R, Jusiak B, Lu TK. Engineering advanced cancer therapies with synthetic biology. Nat. Rev. Cancer. 2019;19:187–195. - PubMed
    1. Pardee K, et al. Rapid, low-cost detection of Zika virus using programmable biomolecular components. Cell. 2016;165:1255–1266. doi: 10.1016/j.cell.2016.04.059. - DOI - PubMed
    1. Takahashi MK, et al. A low-cost paper-based synthetic biology platform for analyzing gut microbiota and host biomarkers. Nat. Commun. 2018;9:3347. doi: 10.1038/s41467-018-05864-4. - DOI - PMC - PubMed

Publication types

MeSH terms

LinkOut - more resources