. 2021 Feb 1;12(1):723.
doi: 10.1038/s41467-021-20962-6.

Mesenchymal stem cell-derived interleukin-28 drives the selection of apoptosis resistant bone metastatic prostate cancer

Affiliations

Mesenchymal stem cell-derived interleukin-28 drives the selection of apoptosis resistant bone metastatic prostate cancer

Jeremy J McGuire et al. Nat Commun. .

Abstract

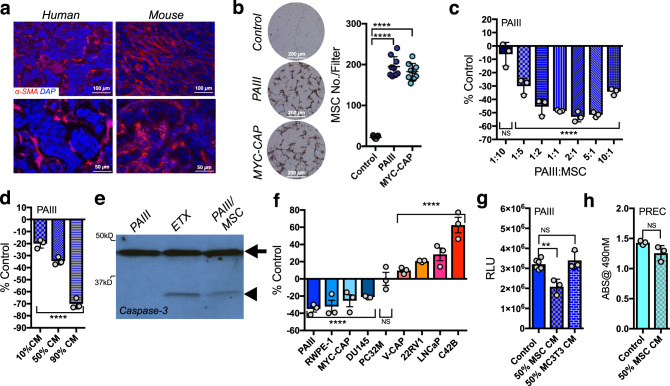
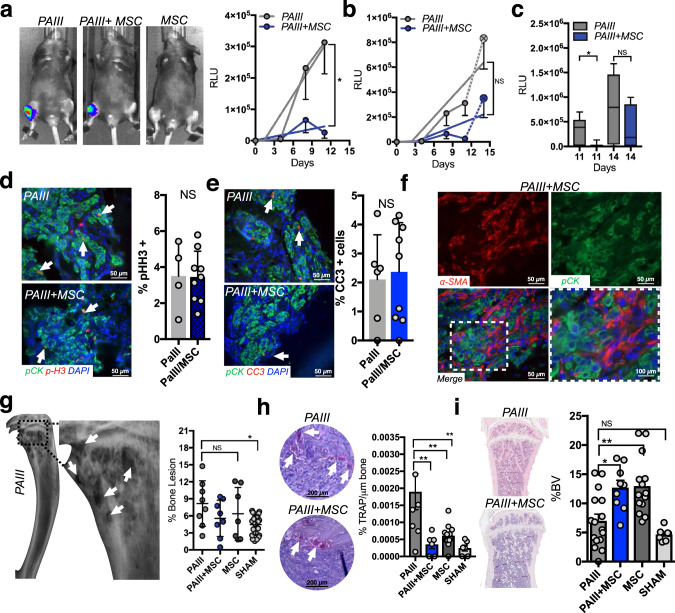
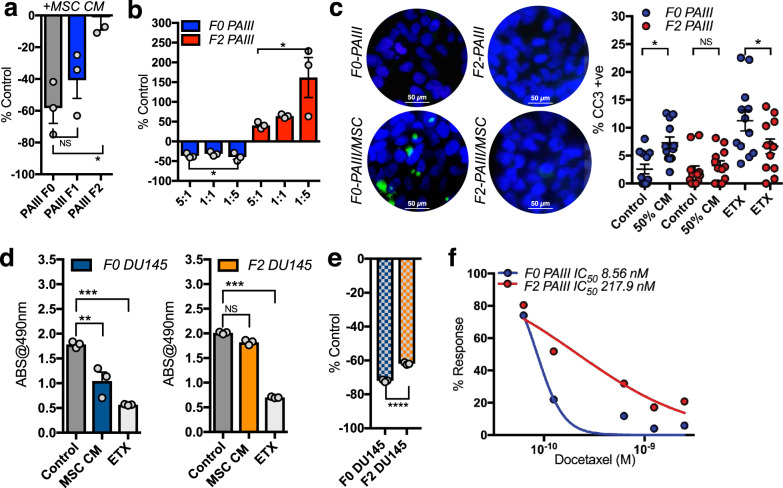
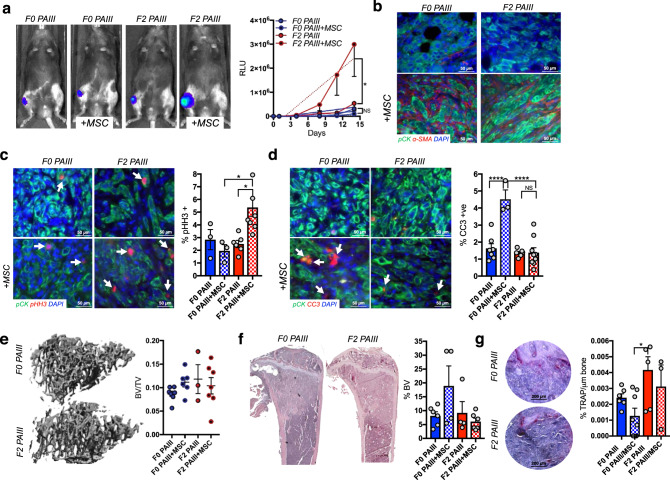
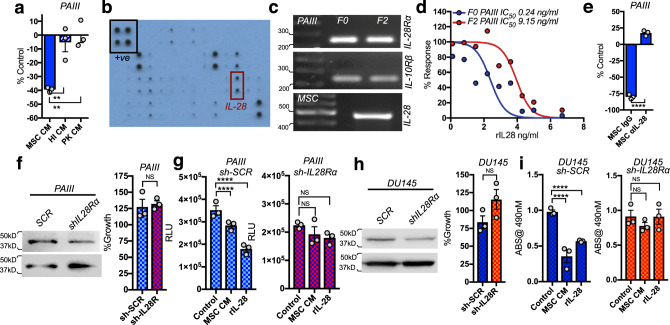
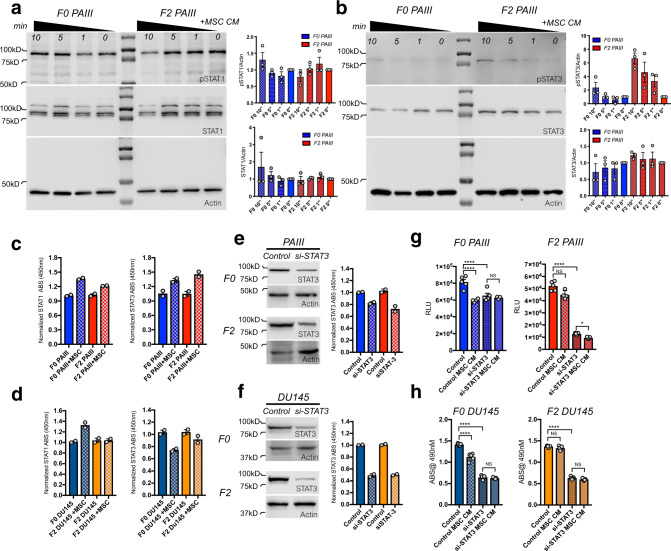
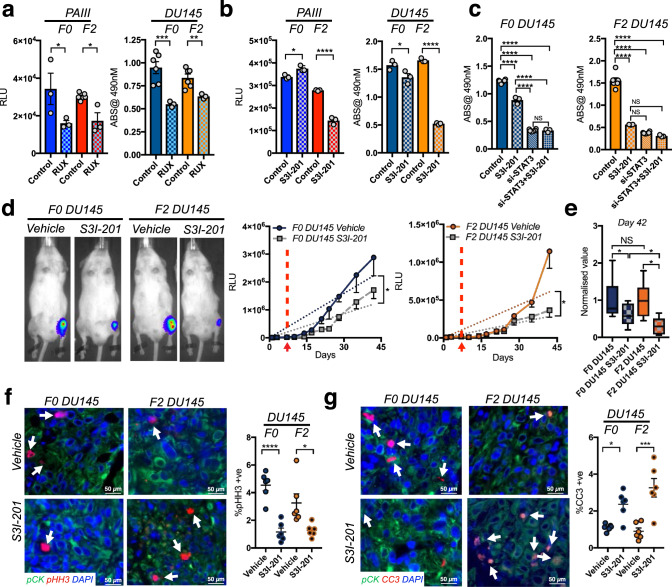
Bone metastatic prostate cancer (PCa) promotes mesenchymal stem cell (MSC) recruitment and their differentiation into osteoblasts. However, the effects of bone-marrow derived MSCs on PCa cells are less explored. Here, we report MSC-derived interleukin-28 (IL-28) triggers prostate cancer cell apoptosis via IL-28 receptor alpha (IL-28Rα)-STAT1 signaling. However, chronic exposure to MSCs drives the selection of prostate cancer cells that are resistant to IL-28-induced apoptosis and therapeutics such as docetaxel. Further, MSC-selected/IL-28-resistant prostate cancer cells grow at accelerated rates in bone. Acquired resistance to apoptosis is PCa cell intrinsic, and is associated with a shift in IL-28Rα signaling via STAT1 to STAT3. Notably, STAT3 ablation or inhibition impairs MSC-selected prostate cancer cell growth and survival. Thus, bone marrow MSCs drive the emergence of therapy-resistant bone metastatic prostate cancer yet this can be disabled by targeting STAT3.


Conflict of interest statement

The authors declare no competing interests.

Figures

Fig. 1
Fig. 1. Bone marrow-derived MSC effects on prostate cancer cells.
a Representative images (n ≥ 3 biologically independent samples) of α-Smooth muscle actin (SMA) staining of human and rodent bone metastatic prostate cancer. b MSC migration to prostate cancer cell conditioned media. Number of hematoxylin and eosin stained MSCs per filter (MC No./Filter; n = 3 fields of view from n = 3 biologically independent samples) were counted after 6 h of incubation. Representative photomicrographs of fields of view are shown. c Direct co-culture of MSCs and PAIII prostate cancer cells at various ratios of PAIII:MSC. Values calculated as percentage of respective PAIII controls seeded at the same density (% Control). Growth was determined by luminescence assay and relative light unit (RLU) measurement. d MSC conditioned media (CM) treatment of PAIII at varying ratios. Final concentration of serum was 10% for each condition. e Cleaved caspase-3 (arrow head) in PAIII cells treated for 6 h with MSC CM (50% ratio). Arrow indicates full-length caspase-3. Etoposide (ETX; 50 μM) was used as a positive control. These experiments were repeated twice with similar results. f MSC CM (50%) effects on prostate cancer cell line growth, relative to untreated controls. Growth measurements were performed by MTT or luminescence assay. g PAIII treated with MSC or osteoblast (MC3T3) CM. h Prostate epithelial cells (PREC) treated with MSC CM. MTT absorbance (ABS) was used as a readout for cell growth. Statistical analyses used include unpaired t-test (c, d and fh) and ANOVA with multiple comparisons at 95% CI (bd and f, g) with error bars representing the mean ± SD. All experiments were independently repeated (n = 3). Asterisks denotes statistical significance (*p ≤ 0.05, **p ≤ 0.01, ***p ≤ 0.001, ****p ≤ 0.0001) while NS denotes not significant.
Fig. 2
Fig. 2. MSCs initially suppress prostate cancer growth in the bone microenvironment.
a, b Prostate cancer growth (PAIII) overtime in the presence (1:1 ratio) or absence of MSCs (n = 8/group). An MSC-alone group was also included as a control (n = 7). Representative images of bioluminescence for each group at day 11 time point are shown. Graphs illustrate collected RLUs over time for each group thru days 11 and 14. Error bars represent mean ± SEM. Linear regression was used to determine significance at day 11 (p = 0.0324). c Analysis of RLU values at day 11 and 14 in the PAIII vs. PAIII + MSC group. Error bars represent the mean  ± SEM. d, e Ex vivo analyses from study endpoint of proliferative and apoptotic indices using phospho-histone H3 (p-H3; red arrows; c) and cleaved caspase 3 (CC3; red, arrows, d), respectively. Pan-cytokeratin (green) was used to identify prostate cancer cells. f Representative images (n ≥ 3 biologically independent samples) of smooth muscle actin staining (α-SMA; red) in tissues derived from the PAIII + MSC group. Pan-cytokeratin (pCK; green) was used to localize prostate cancer cells. Dashed box in merge represents area of magnification. g X-ray analysis of cancer-induced bone destruction. Representative X-ray from PAIII group is shown with dashed box defining area of magnification. Arrows indicate areas of cancer-induced bone destruction. The area of bone destruction was calculated as a percentage of total volume. h The number of osteoclasts (TRAcP positive; red, multinucleated; arrows) per μm of bone was calculated in non-sequential sections derived from the PAIII and PAIII + MSC groups. i Trabecular bone volume (BV) was measured via histomorphometry on non-sequential H&E multiple sections derived from each group and calculated as a percentage of total volume. Representative gross H&E images are illustrated from the PAIII and PAIII + MSC group. Representative micrographs (d, e, g, i) are derived from independent bones (≥ 3) from each study group. Statistical analyses were generated from one-way ANOVA with multiple comparisons at 95% CI. Asterisks denote statistical significance (*p ≤ 0.05, **p ≤ 0.01) while NS denotes not significant.
Fig. 3
Fig. 3. MSCs select for apoptotic resistant prostate cancer cell populations.
a Growth of parental PAIIIs (F0) and MSC PAIII cell lines selected after one (F1) or two rounds (F2) of exposure to MSC conditioned media (50% concentration). Cell growth was calculated as a percentage of controls grown in the absence of MSC CM (n ≥ 3 biologically independent samples). b Direct co-culture of F0 and F2 PAIIIs with MSCs at varying ratios (MSC:PAIII). Data obtained from n ≥ 3 biologically independent samples. Cell growth was calculated as a percentage of F0 and F2 PAIIIs seeded at equivalent numbers in the absence of MSCs. c Immunofluorescence (IF) analysis of cleaved caspase-3 positivity (green) in F0 and F2 PAIII cell lines treated for 6 h with MSC CM. Graphs illustrate the number of cleaved caspase-3 positive cells as a ratio of total cell number (nuclear DAPI-blue). Data obtained from n ≥ 3 fields of view from at least three independent experiments. Etoposide (ETX; 50 μM) was used as a positive control. Data shown as mean ± SD. d, e MSC CM (50%) selection of apoptosis resistant DU-145 prostate cancer cells (F2) and the response to etoposide (ETX; 50 μM). Cell growth was calculated by MTT assay with absorbance (ABS) at 490 nm used as a correlate for cell number (n ≥ 3 biologically independent samples). f IC50 curves of PAIII F0 and MSC selected F2 cells treated with docetaxel for 48 h at a concentration range of 0–6.25 nM (n ≥ 3 biologically independent samples at each concentration used. Dots represent the mean combined with a nonlinear fit solid line. Error bars shown as mean ± SEM (a, b, d) or ±SD (c, e). Statistical analyses were generated from one-way ANOVA with multiple comparisons at 95% CI or unpaired t-test (e). Asterisks denotes statistical significance (*p ≤ 0.05, **p ≤ 0.01, ***p ≤ 0.001, ****p ≤ 0.0001) while NS denotes not significant.
Fig. 4
Fig. 4. MSC selected prostate cancer cell growth is promoted rather than suppressed by the presence of MSCs.
a Parental (F0 PAIII) and MSC selected (F2 PAIII) growth over time in the presence (1:1 ratio) or absence of MSCs (n ≥ 6/group). Representative images of bioluminescence in each group are shown at day 11 time point. Graphs illustrate collected RLUs over time for each group. Non-linear regression was used for statistical analysis with mean  ± SEM, p = 0.0052. b Representative images (n≥3 biologically independent samples) of smooth muscle actin staining (α-SMA; red) in tissues derived from the F0 and F2 groups in the presence or absence of MSCs. Pan-cytokeratin (pCK; green) was used to localize prostate cancer cells. Dashed box in merge represents area of magnification. c, d Ex vivo analyses from study endpoint of proliferative and apoptotic indices using phospohistone H3 (pHH3; red arrows; b) and cleaved caspase 3 (CC3; red, arrows, b), respectively. Pan-cytokeratin (green) was used to identify prostate cancer cells (n ≥ 3 fields of view from at least three independent experiments). e μCT scan analysis of cancer-induced bone destruction. Representative μCT images of the trabecular bone are shown for the F0 and F2 PAIII group. The trabecular bone volume was calculated as a ratio to total volume analyzed (BV/TV; n ≥ 3 bones from each group). f Trabecular bone volume (BV) was measured via histomorphometry on non-sequential H&E multiple sections derived from each group and calculated as a percentage of total volume (n ≥ 4 bones derived from each group). Representative gross H&E images are illustrated from the F0 and F2 groups. g The number of osteoclasts (TRAcP positive; red, multi-nucleated; arrows) per μm of bone was calculated in non-sequential sections derived from each group (n ≥ 3 fields of view from at least three independent experiments). For all graphs shown, error bars represent mean ± SEM, statistical analyses were performed by one-way ANOVA with multiple comparisons. Asterisks denotes statistical significance (*p ≤ 0.05, ****p ≤ 0.0001) while NS denotes not significant.
Fig. 5
Fig. 5. MSC-derived IL-28 directs PCa apoptosis.
a PAIII growth (F0) in response to treatment with MSC CM, heat-inactivated (HI) MSC CM, or proteinase-K (PK) treated MSC CM. b Cytokine Array of MSC CM. Black box indicates positive control (+ve), red box indicates IL-28. c RT-PCR analysis of PAIII (F0 and F2) of IL28Rα, IL-10Rβ and IL-28 expression. Molecular weights in base pairs are shown. d Growth of PAIII (F0) in MSC CM immune-depleted of IL-28 (MSC αIL-28). IgG was used as negative control (MSC IgG). Growth is expressed as a percentage of non-treated cells. e Treatment of PAIII F0 and F2 cell lines with the indicated concentrations of recombinant IL-28 (rIL-28) for 48 h. f Growth of IL-28Rα silenced (sh-IL28R) and scrambled control (sh-SCR) compared to parental PAIII cell lines. g, h Control (sh-SCR) and IL-28Rα (sh-IL28R) PAIII and DU145 growth in MSC CM or rIL-28 as measured by luminescence assay and relative light unit (RLU) measurement or MTT assay. Experiments were repeated on at least two (c, f, h) or three (a, ei) occasions. Error bars represent the mean ± SEM. Statistical analyses were performed by one-way ANOVA with multiple comparisons at 95% CI (a, g, i) or unpaired t-test (e, f, h). Asterisks denotes statistical significance (**p ≤ 0.01, ****p ≤ 0.0001) while NS denotes not significant.
Fig. 6
Fig. 6. Elevated STAT3 signaling in MSC selected prostate cancer cell lines.
a, b pSTAT1 (a) and pSTAT3 (b) levels at baseline and in response to MSC CM (50%) over a 10 min (min) period in PAIII parental (F0) and MSC selected (F2) cell lines. Molecular weights are shown in kDa. Actin was used as a loading control. For densitometry, pSTAT and STAT levels were each normalized to their respective actin controls and time responses for F0 and F2 are compared to their respective 0’ minute controls that were set at a normalized value of 1. All experiments were repeated on at least three separate occasions with similar results. c, d STAT1 and STAT3 DNA binding activity in the PAIII (c) and DU145 (d) F0 and F2 cell lines was measured in response to MSC CM for 30 min. Results obtained via absorbance (ABS@450 nm) were normalized to respective controls. e, f STAT3 was silenced (si-STAT3) in PAIII (e) and DU145 (f) F0 parental and F2 MSC-selected cell lines and the resultant impact on STAT3 activity was measured. Blots show total STAT3. Experiments were independently repeated with similar results. g, h The effect of STAT3 silencing on PAIII (g) and DU145 (h) cell growth in the presence or absence of MSC CM compared to control treated cells using luminescence assay and relative light unit (RLU) measurement or MTT assay (n ≥ 3 biologically independent samples). Molecular weights are shown in kDa. Error bars in graphs represent the mean ± SEM and statistical analyses were performed by one-way ANOVA with multiple comparisons at 95% CI. Asterisks denote statistical significance (*p ≤ 0.05, **p ≤ 0.01, ***p ≤ 0.001, ****p ≤ 0.0001) while NS denotes not significant.
Fig. 7
Fig. 7. STAT3 inhibition impairs the growth of MSC-selected prostate cancer in vitro and in vivo.
a, b Parental (F0) and MSC-selected (F2) cell lines treated with vehicle control (Control) or the JAK2 inhibitor ruxolitinib (RUX)/STAT3 inhibitor (S3I-201) for 24 h. c F0 and F2 DU145 control (scr-siRNA) or STAT3 silenced (si-STAT3) cells treated with vehicle or S3I-201 for 24 h. d F0 and F2 DU145 growth over time in the presence or absence of STAT3 inhibitor, S3I-201 (n = 10/group). Representative images of bioluminescence in each group are shown at day 35-time point. Arrow and dashed line represent time of treatment initiation. Graphs illustrate collected RLUs over time for each group. Error bars represent the mean ± SEM and linear regression was used for statistical analysis. e S3I-201 effect on F0 and F2 DU145 at day 42 normalized to respective controls. Box and whisker plots show min to max values obtained. f, g Ex vivo analyses from study endpoint of proliferative and apoptotic indices using phospohistone H3 (pHH3; red arrows; f) and cleaved caspase 3 (CC3; red, arrows, g), respectively. Pan-cytokeratin (green) was used to identify prostate cancer cells. Error bars represent the mean  ± SEM. Experiments (ad) were repeated on at least three separate occasions with similar results. Error bars in graphs represent the mean ± SEM. Statistical analyses were performed by one-way ANOVA with multiple comparisons at 95% CI. Asterisks denote statistical significance (*p ≤ 0.05, **p ≤ 0.01, ***p ≤ 0.001, ****p ≤ 0.0001) while NS denotes not significant.

References

    1. Bubendorf L, et al. Metastatic patterns of prostate cancer: an autopsy study of 1,589 patients. Hum. Pathol. 2000;31:578–583. doi: 10.1053/hp.2000.6698. - DOI - PubMed
    1. Petrylak DP, et al. Docetaxel and estramustine compared with mitoxantrone and prednisone for advanced refractory prostate cancer. N. Engl. J. Med. 2004;351:1513–1520. doi: 10.1056/NEJMoa041318. - DOI - PubMed
    1. Frieling JS, Basanta D, Lynch CC. Current and emerging therapies for bone metastatic castration-resistant prostate cancer. Cancer Control. 2015;22:109–120. doi: 10.1177/107327481502200114. - DOI - PMC - PubMed
    1. Guise TA, et al. Basic mechanisms responsible for osteolytic and osteoblastic bone metastases. Clin. Cancer Res. 2006;12:6213s–6216s. doi: 10.1158/1078-0432.CCR-06-1007. - DOI - PubMed
    1. Weilbaecher KN, Guise TA, McCauley LK. Cancer to bone: a fatal attraction. Nat. Rev. Cancer. 2011;11:411–425. doi: 10.1038/nrc3055. - DOI - PMC - PubMed

Publication types

MeSH terms