. 2021 Feb 1;11(1):2714.
doi: 10.1038/s41598-021-81566-0.

The role of tropical volcanic eruptions in exacerbating Indian droughts

Affiliations

The role of tropical volcanic eruptions in exacerbating Indian droughts

Suvarna Fadnavis et al. Sci Rep. .

Abstract

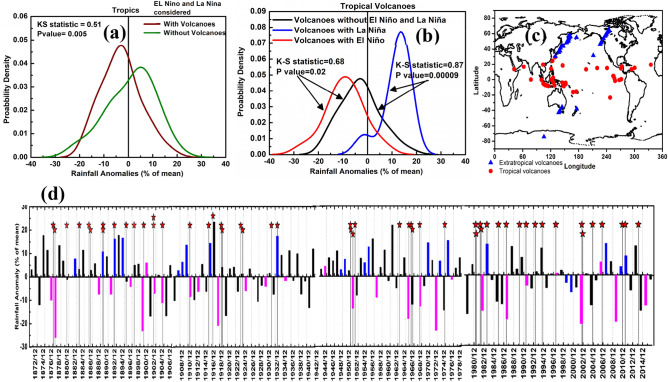
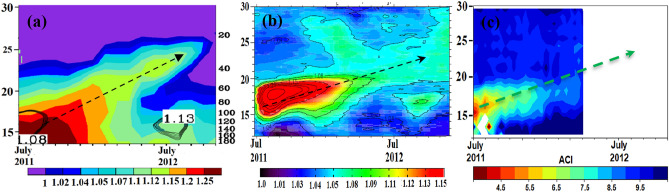
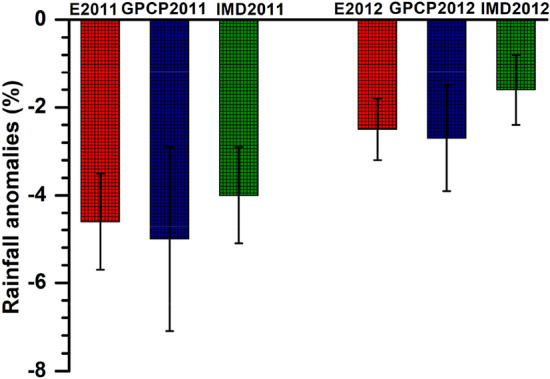
The Indian summer monsoon rainfall (ISMR) is vital for the livelihood of millions of people in the Indian region; droughts caused by monsoon failures often resulted in famines. Large volcanic eruptions have been linked with reductions in ISMR, but the responsible mechanisms remain unclear. Here, using 145-year (1871-2016) records of volcanic eruptions and ISMR, we show that ISMR deficits prevail for two years after moderate and large (VEI > 3) tropical volcanic eruptions; this is not the case for extra-tropical eruptions. Moreover, tropical volcanic eruptions strengthen El Niño and weaken La Niña conditions, further enhancing Indian droughts. Using climate-model simulations of the 2011 Nabro volcanic eruption, we show that eruption induced an El Niño like warming in the central Pacific for two consecutive years due to Kelvin wave dissipation triggered by the eruption. This El Niño like warming in the central Pacific led to a precipitation reduction in the Indian region. In addition, solar dimming caused by the volcanic plume in 2011 reduced Indian rainfall.


Conflict of interest statement

The authors declare no competing interests.

Figures

Figure 1
Figure 1
Volcanic eruptions and Indian summer monsoon rainfall: (a) probability distribution of rainfall anomalies within two years of eruption, when stratified with and without tropical volcanic eruptions; (b) probability distribution of rainfall anomalies within two years of a tropical volcanic eruption during El Niño, La Niña, and normal years; the statistical measures of K-S test shown in (a,b) indicates that distributions are distinct; (c) spatial distribution of moderate-to-large (VEI > 3) volcanic eruptions; (d) time series of June–September mean precipitation anomaly (%) during 1871 –2016 along with tropical (30° S–30° N) volcanic eruptions indicated with stars. Bars in magenta and blue in panel (d) indicate El Niño and La Niña years, respectively. Details of the volcanic eruption are listed in Table S1. Anomalies are obtained as difference in rainfall amount of the respective year and climatology of 1871–2016 (figure created using the COLA/GrADS software).
Figure 2
Figure 2
Aerosol vertical distribution during July 2011–November 2012 averaged over India (70–95° E; 10–30° N). Scattering ratio at 532 nm in the ECHAM6-HAMMOZ (Vol) simulation (a), Scattering ratio at 532 nm from CALIPSO (b), and Aerosol cloud index (ACI) estimates from MIPAS (c). Arrows indicate the transport of the NABRO plume. The ATAL is indicated as contours in (a,b) (Figure are created using the COLA/GrADS software and Fig. 2c is created using Python).
Figure 3
Figure 3
(a) Distribution of anomalies (Vol-CTL) in net direct radiative forcing at TOA (Wm−2) and the surface (Wm−2) for 2011 and 2012 monsoon from the ECHAM6-HAMMOZ simulations (ETOA and ESur), SOCRATES model (STOA and SSur), aerosols in the UTLS from SOCRATES: STOAUTLS and SSurUTLS), (b) same as (a) but changes in net solar radiation (flux) at the surface (W.m−2) (ECHAM6-HAMMOZ—E2011 and E2012; SOCRATES—S2011 and S2012, aerosols in the UTLS from SOCRATES—SUTLS2011 and SUTLS2012). Bars in panels (a) and (b) correspond to minimum, mean, maximum values. Vertical distribution of changes in heating rate (K day−1) averaged for 70°E–95°E and monsoon (c) 2011, and (d) 2012. (Figure created using the COLA/GrADS software).
Figure 4
Figure 4
Distribution of anomalies (Vol-CTL) of rainfall (%) (averaged for 78–93°E, 8–35°N and for monsoon 2011 (July–September) and monsoon 2012 (June–September) from MPI-ESM represented as E2011, E2012; Global Precipitation Climatology Project (GPCP) (precipitation of monsoon 2011/2012—climatology of 1981–2015), India Meteorology Department (IMD) data (precipitation of monsoon 2011/2012—climatology of 1950–2015) (Figure created using Origin (OriginLab, Northampton, MA)).
Figure 5
Figure 5
Anomalies (Vol-CTL) in temperature of sea water (K) from MPI-ESM (a)-(t) from July 2011 to February 2013. (Figure created using the COLA/GrADS software).
Figure 6
Figure 6
(a) Anomalies (Vol-CTL) in ocean eastward velocity (m s−1) averaged for 2°S–2°N, (b) Power spectral density plot of anomalies (Vol-CTL) in zonal wind stress (Pa) averaged for 2°S–2°N and 140° W, it indicates the Kelvin waves with dominant periodicity of 70–100 days during July 2011 to January 2013, (c) Eastward propagating Kelvin waves near the equator (averaged for 2°S–2°N) after application of band pass filter (70–100 days) on anomalies (Vol-CTL) in zonal wind stress (Pa), (d) Seasonal mean anomalies (Vol-CTL) in surface temperature of sea water (K) at the Niño 3 (5°S to 5°N, 150 W and 90 W) and Niño 3.4 (170°W to 120°W, 5°S to 5°N) regions. M2011 represents as 2011 monsoon (JAS 2011), W2011 as 2011 winter (December 2011-Feb2012), M2012 as 2012 monsoon (JJAS 2012), and W2012 as 2012 winter (December 2012-Feb2013). Bars in panel (d) correspond to minimum, mean, maximum values. Figure (ad) are from the MPI-ESM model simulations (Figure created using the COLA/GrADS software).
Figure 7
Figure 7
A schematic of the impact of volcanic eruptions on monsoon precipitation: (a) normal monsoon with a strong Hadley circulation, (b) Nabro volcanic aerosol leading to a thick aerosol layer in the UTLS comprising of the ATAL, which reflects more solar radiation leading to a weak Hadley circulation (anomalous; denoted with sign reversal and dotted lines) and a reduction in rainfall. (c) The tropospheric cooling induced by the thicker ATAL (as in volcano year, "b") induces an El Niño in the following year (through anomalous atmospheric Kelvin and Rossby waves (shown as a blue wave in “b”), which induce a westerly wind burst (black wave) and produce an El Niño through downwelling Kelvin waves (shown in white colour)). However, the reduced aerosol layer lets pass more sunlight compared to the year of the eruption, but the El Niño weakens the Hadley circulation (anomalous; shown in lines [since it is less reduction than in the year of the eruption] with the inverted arrow) and retains the deficit rainfall condition. The SST patterns intend to indicate the normal and El Niño condition over the Pacific, rest of the oceanic basins are kept the same in all maps for illustration purpose (and are not connected with our simulations). Maps are prepared using NCL and 3D impact and schematic structures made utilizing Adobe illustrator.

References

    1. Cook ER, et al. Asian monsoon failure and mega drought during the last millennium. Science. 2010;328:486–490. doi: 10.1126/science.1185188. - DOI - PubMed
    1. Krishnan R, et al. Deciphering the desiccation trend of the South Asian monsoon hydroclimate in a warming world. Clim. Dyn. 2016;47:1007–1027. doi: 10.1007/s00382-015-2886-5. - DOI
    1. Mishra V, et al. Drought and famine in India 1870–2016. Geophys. Res. Lett. 2019;46:2075–2083. doi: 10.1029/2018GL081477. - DOI
    1. Kumar KK, Soman MK, Kumar KR. Seasonal forecasting of Indian summer monsoon rainfall: a review. Weather. 1995;50:449–467. doi: 10.1002/j.1477-8696.1995.tb06071.x. - DOI
    1. Paul S, et al. Weakening of Indian summer monsoon rainfall due to changes in land use land cover. Sci. Rep. 2016;6(32177):1–10. - PMC - PubMed

Publication types