. 2021 Feb 1;11(1):2704.
doi: 10.1038/s41598-021-80970-w.

Breath can discriminate tuberculosis from other lower respiratory illness in children

Affiliations

Breath can discriminate tuberculosis from other lower respiratory illness in children

Carly A Bobak et al. Sci Rep. .

Abstract

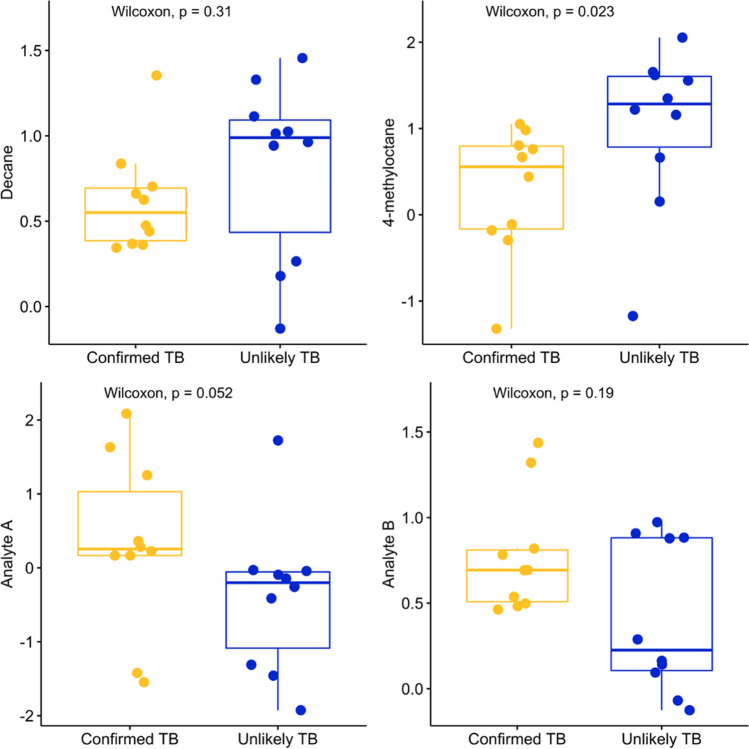
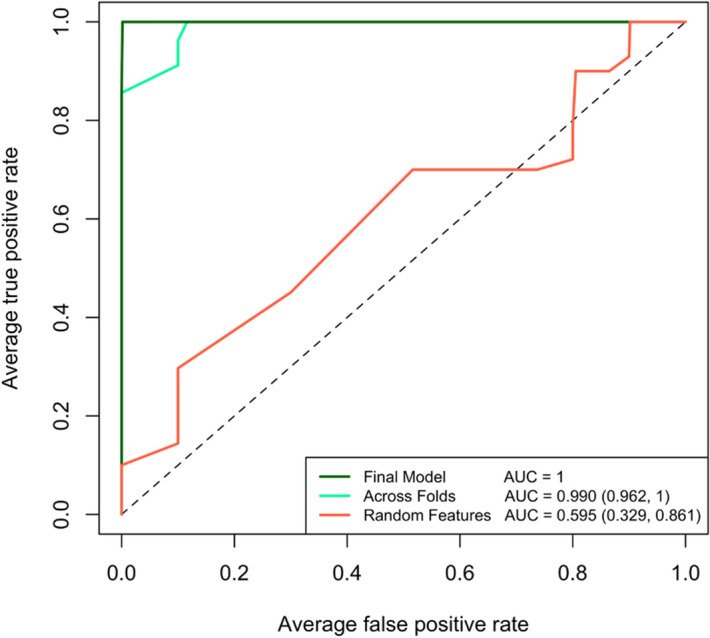
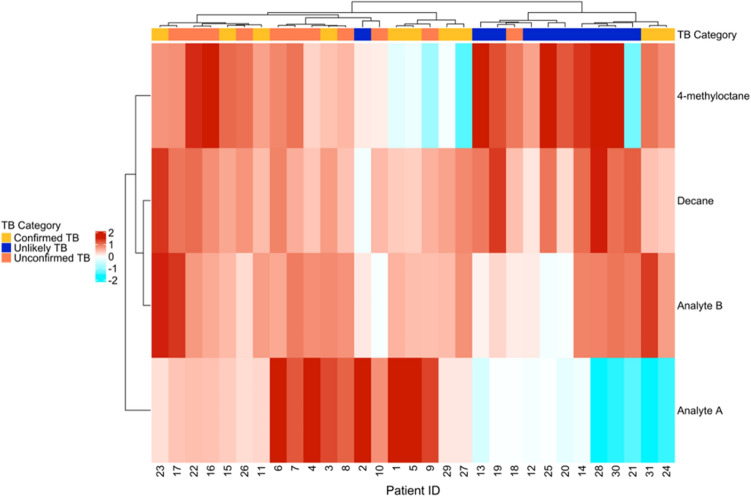
Pediatric tuberculosis (TB) remains a global health crisis. Despite progress, pediatric patients remain difficult to diagnose, with approximately half of all childhood TB patients lacking bacterial confirmation. In this pilot study (n = 31), we identify a 4-compound breathprint and subsequent machine learning model that accurately classifies children with confirmed TB (n = 10) from children with another lower respiratory tract infection (LRTI) (n = 10) with a sensitivity of 80% and specificity of 100% observed across cross validation folds. Importantly, we demonstrate that the breathprint identified an additional nine of eleven patients who had unconfirmed clinical TB and whose symptoms improved while treated for TB. While more work is necessary to validate the utility of using patient breath to diagnose pediatric TB, it shows promise as a triage instrument or paired as part of an aggregate diagnostic scheme.


Conflict of interest statement

The authors declare no competing interests.

Figures

Figure 1
Figure 1
The distribution of the mean centered and normalized peak area of each of the four compounds selected in the breathprint across confirmed TB and unlikely TB patients. For each compound, the median observed peak area between the two groups is different, indicating univariate differences which may contribute to the discrimination of confirmed TB patients from unlikely TB patients. Boxplots show the quartiles of the data (first line is the first quartile, midline is the median, third line is the third quartile) where whiskers represent 1.5 × IQR (inter-quartile range). The distribution across all three TB groups is shown in Supplementary Fig. 2. Figure created in R using ‘ggplot2’ and ‘ggpubr’.
Figure 2
Figure 2
The receiver operating characteristic curves from the random forest model used to classify confirmed TB from unlikely TB patients. The final model demonstrates perfect classification but is almost certainly overfit to the data. The AUC observed across folds using the identified breathprint is 0.99, demonstrating very good sensitivity and specificity across all folds of the data. In comparison, a randomly selected 4-compound breathprint only demonstrated an AUC of 0.595 across cross validation folds of the data. Figure created in R.
Figure 3
Figure 3
A dendrogram and heatmap demonstrating the unsupervised clustering of patients using the 4-compound breathprint. The annotation bar along the dendrogram indicates TB category. The heatmap shows the normalized peak area for each compound. Red indicates above average peak area, and blue indicates below average peak area. Figure created in R using ‘ComplexHeatmap’.
Figure 4
Figure 4
The output probabilities that each patient has TB disease from the random forest classifier across the TB categories. Patients with a probability of over 50% are assigned a label of having TB disease. Despite two unconfirmed TB patients having probabilities below 50%, there is clear differentiation in model probabilities between the unconfirmed and unlikely TB groups. Boxplots show the quartiles of the data (first line is the first quartile, midline is the median, third line is the third quartile) where whiskers represent 1.5 × IQR (inter-quartile range). Figure created in R using ‘ggplot2’ and ‘ggpubr’.

References

    1. Martinez L, Zar HJ. Tuberculin conversion and tuberculosis disease in infants and young children from the Drakenstein Child Health Study: A call to action. S. Afr. Med. J. 2018;108:247. doi: 10.7196/SAMJ.2018.v108i4.13169. - DOI - PubMed
    1. Dodd PJ, Gardiner E, Coghlan R, Seddon JA. Burden of childhood tuberculosis in 22 high-burden countries: A mathematical modelling study. Lancet Glob. Heal. 2014;2:e453–e459. doi: 10.1016/S2214-109X(14)70245-1. - DOI - PubMed
    1. WHO Global tuberculosis report 2018. WHO (World Health Organization, Geneva, 2019).
    1. Zar HJ, et al. Tuberculosis diagnosis in children using Xpert ultra on different respiratory specimens. Am. J. Respir. Crit. Care Med. 2019 doi: 10.1164/rccm.201904-0772OC. - DOI - PMC - PubMed
    1. Connell TG, Zar HJ, Nicol MP. Advances in the diagnosis of pulmonary tuberculosis in HIV-infected and HIV-uninfected children. J. Infect. Dis. 2011;204(Suppl 4):S1151–8. doi: 10.1093/infdis/jir413. - DOI - PMC - PubMed

Publication types