. 2021 May;17(5):531-539.
doi: 10.1038/s41589-020-00729-8. Epub 2021 Feb 1.

Computation-guided optimization of split protein systems

Affiliations

Computation-guided optimization of split protein systems

Taylor B Dolberg et al. Nat Chem Biol. 2021 May.

Abstract

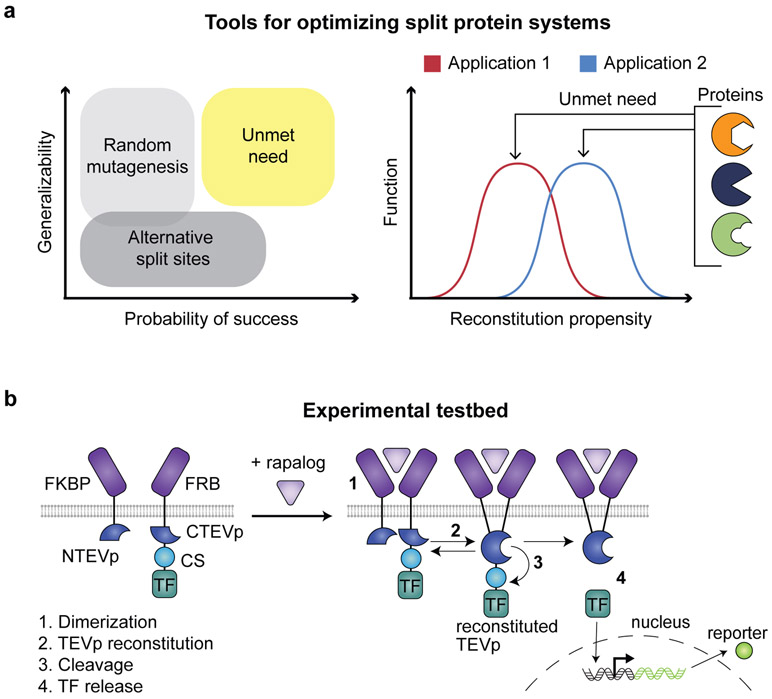
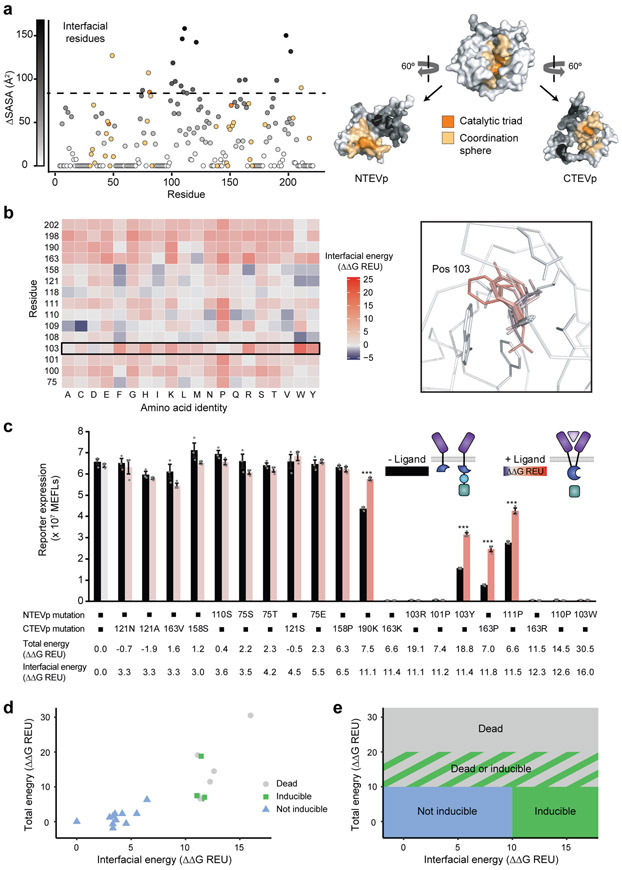
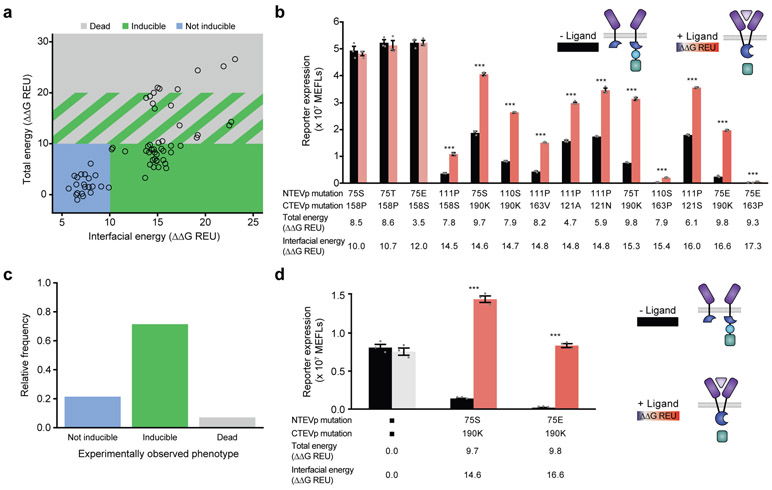
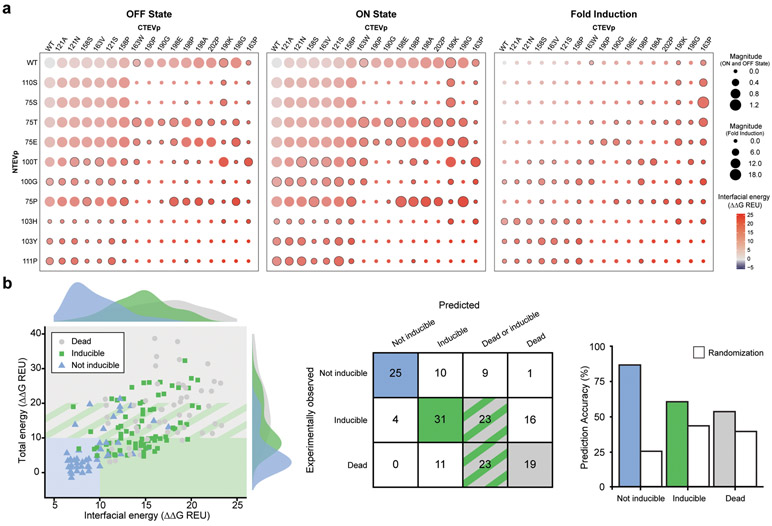
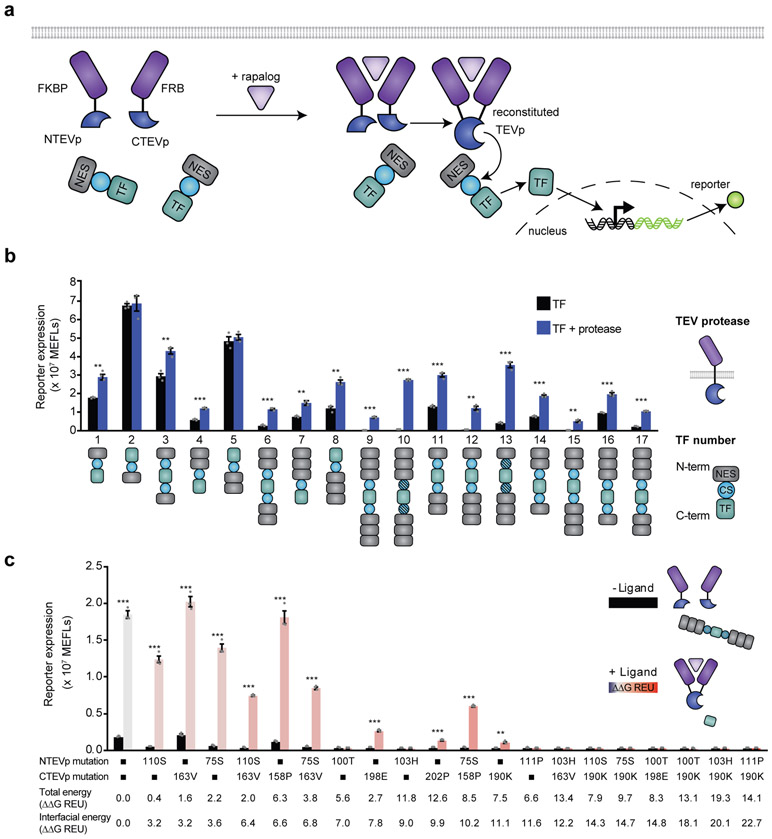
Splitting bioactive proteins into conditionally reconstituting fragments is a powerful strategy for building tools to study and control biological systems. However, split proteins often exhibit a high propensity to reconstitute, even without the conditional trigger, limiting their utility. Current approaches for tuning reconstitution propensity are laborious, context-specific or often ineffective. Here, we report a computational design strategy grounded in fundamental protein biophysics to guide experimental evaluation of a sparse set of mutants to identify an optimal functional window. We hypothesized that testing a limited set of mutants would direct subsequent mutagenesis efforts by predicting desirable mutant combinations from a vast mutational landscape. This strategy varies the degree of interfacial destabilization while preserving stability and catalytic activity. We validate our method by solving two distinct split protein design challenges, generating both design and mechanistic insights. This new technology will streamline the generation and use of split protein systems for diverse applications.


Figures

Fig. 1
Fig. 1. Design-driven strategy for tuning split protein systems.
a, Current methods for optimizing split proteins are limited (left); an ideal tool would enable adapting split proteins for multiple applications, each of which may require distinct reconstitution propensities (right). b, This cartoon illustrates the experimental testbed used here. Ligand binding-induced chain dimerization results in split TEVp reconstitution, trans-cleavage, and release of a previously sequestered transcription factor to drive reporter expression.
Fig. 2
Fig. 2. Computation guided method development and experimental analysis.
a, Left, characterization of the change in solvent-accessible surface area (SASA), between fragment and reconstituted forms, of each residue of 118/119 split TEVp. Right, 3D depiction of 118/119 split TEVp, showing the catalytic triad (orange), coordination sphere (yellow), and ΔSASA (greyscale). b, Mutational scanning of high ΔSASA residues (left) and example of all possible mutations of residue 103 (right), with change in interfacial energy indicated by color. Energetic perturbations to total protein stability are shown in Supplementary Fig. 3. c, Experimental analysis of TEVp mutations predicted to span a range of interfacial energies. We hypothesize that modest rapalog-induced toxicity or inhibition of protein expression could explain the slight decrease in signal observed upon rapalog addition for some mutants. Error bars depict S.E.M. Two-tailed Student’s t-test (*p ≤ 0.05, ***p ≤ 0.001). Experiments were performed in biological triplicate. Results are representative of two independent biological experiments. d, Experimental phenotypes observed in c were plotted on an energy landscape and annotated as indicated by color (reporter expression normalized to WT < 0.05 is “dead”, fold induction < 1.2 is “not inducible”, fold induction ≥ 1.2 is “inducible”). e, Proposed model for predicting zones of functional phenotypes based upon total and interfacial energy; the boundaries comprise hypotheses posed based upon observations using the initial 20 mutants tested in c.
Fig. 3
Fig. 3. Evaluation of model-predicted phenotypes for combined mutations.
a, Computed energies and computationally predicted phenotypes (open circle data points) based on the classifier model (shaded boxes)—proposed as a hypothesis in Fig. 2e—of all possible double and paired mutants constructed by combinatorial sampling of the 20 initial single mutants tested (omitting the 6 dead mutations) in Fig. 2c. b, Experimental evaluation of selected mutants predicted to be inducible. c, Experimentally observed phenotypes for the fourteen mutants predicted to be inducible (from b), showing that the model predicts inducibility at a fairly high rate (10/14). d, Normalizing protein expression levels improves performance (fold induction) of selected mutants (from b), whereas WT function is not changed. Fold inductions for 75S/190K and 75E/190K: 2.2 and 7.9 respectively (from b) and 10.3 and 43.3 respectively (from d). The normalization results in a statistically significant improvement of fold induction (between panels b and d) for each of the two mutant pairs analyzed (two-tailed Student’s t-test, p ≤ 0.001). Normalization was achieved using Western blot analysis (Supplementary Fig. 7) to adjust DNA doses transfected (per well, N-terminal chains: 0.4 ng WT, 1 ng 75S, 1.4 ng 75E; C-terminal chains: 5 ng WT, 12 ng 190K). Error bars depict S.E.M. (*p ≤ 0.05, ***p ≤ 0.001). Experiments were performed in biological triplicate. Results are representative of two independent biological experiments.
Fig. 4
Fig. 4. Evaluation of model-predicted phenotypes for novel mutations and combinations.
a, For each experimentally characterized construct, reporter output was quantified in the absence of ligand (OFF state) and following ligand addition (ON state), and the fold induction was calculated. Calculated interfacial energy for each construct is indicated by circle color, magnitude of reporter expression (or fold-induction) is indicated by circle size, and constructs with a fold induction ≥ 1.2 are denoted with a black border. Single mutants observed to be dead (Fig. 2c) were not carried forward to this analysis. b, Left, experimentally observed phenotypes (data point color) were mapped onto the proposed classifier model (shaded boxes) from Fig. 2e, with observed frequency distributions shown as histograms. Right, evaluation of model prediction accuracy compared to random assignment of phenotypes.
Fig. 5
Fig. 5. Model-guided design of a new split TEVp application in soluble context.
a, This cartoon illustrates the soluble split TEVp testbed. Ligand-binding-induced dimerization mediates reconstitution of split TEVp, which then cleaves one or more nuclear export sequence (NES) elements from a soluble transcription factor, leading to nuclear import and reporter expression. b, The testbed was developed by evaluating engineered transcription factors (TF) for consistency with the mechanism proposed in a; varying the number of NES elements, NES placement at the N and/or C terminus of the transcription factor, and the P1’ residue of the TEVp cleavage sequence, where shaded cleavage sequence (CS) domains indicate a Gly residue in the P1’ position, and unshaded CS domains indicate a Met residue in this position. c, Experimental analysis of single and paired mutants sampling a range of interfacial energies (indicated by color and labeled), employing TF10 from b. Error bars depict S.E.M. Two-tailed Student’s t-test (*p ≤ 0.05, ***p ≤ 0.001). Experiments were performed in biological triplicate. Results are representative of two independent biological experiments.

References

    1. Romei MG & Boxer SG Split Green Fluorescent Proteins: Scope, Limitations, and Outlook. Annual Review of Biophysics 48, 19–44 (2019). - PMC - PubMed
    1. Shekhawat SS & Ghosh I Split-protein systems: beyond binary protein-protein interactions. Curr Opin Chem Biol 15, 789–97 (2011). - PMC - PubMed
    1. Wehr MC & Rossner MJ Split protein biosensor assays in molecular pharmacological studies. Drug Discovery Today 21, 415–429 (2016). - PubMed
    1. Muller J & Johnsson N Split-ubiquitin and the split-protein sensors: chessman for the endgame. Chembiochem 9, 2029–38 (2008). - PubMed
    1. Paulmurugan R & Gambhir SS Monitoring protein-protein interactions using split synthetic renilla luciferase protein-fragment-assisted complementation. Anal Chem 75, 1584–9 (2003). - PMC - PubMed

REFERENCES: METHODS-ONLY

    1. Donahue PS et al. The COMET toolkit for composing customizable genetic programs in mammalian cells. Nature Communications 11, 779 (2020). - PMC - PubMed
    1. Xia Z & Liu Y Reliable and global measurement of fluorescence resonance energy transfer using fluorescence microscopes. Biophysical journal 81, 2395–2402 (2001). - PMC - PubMed
    1. Eisenhaber F, Lijnzaad P, Argos P, Sander C & Scharf M The double cubic lattice method: Efficient approaches to numerical integration of surface area and volume and to dot surface contouring of molecular assemblies. Journal of Computational Chemistry 16, 273–284 (1995).
    1. Alford RF et al. The Rosetta All-Atom Energy Function for Macromolecular Modeling and Design. J Chem Theory Comput 13, 3031–3048 (2017). - PMC - PubMed

Publication types

MeSH terms