. 2021 Feb;24(2):234-244.
doi: 10.1038/s41593-020-00770-9. Epub 2021 Feb 1.

CNS fibroblasts form a fibrotic scar in response to immune cell infiltration

Affiliations

CNS fibroblasts form a fibrotic scar in response to immune cell infiltration

Cayce E Dorrier et al. Nat Neurosci. 2021 Feb.

Abstract

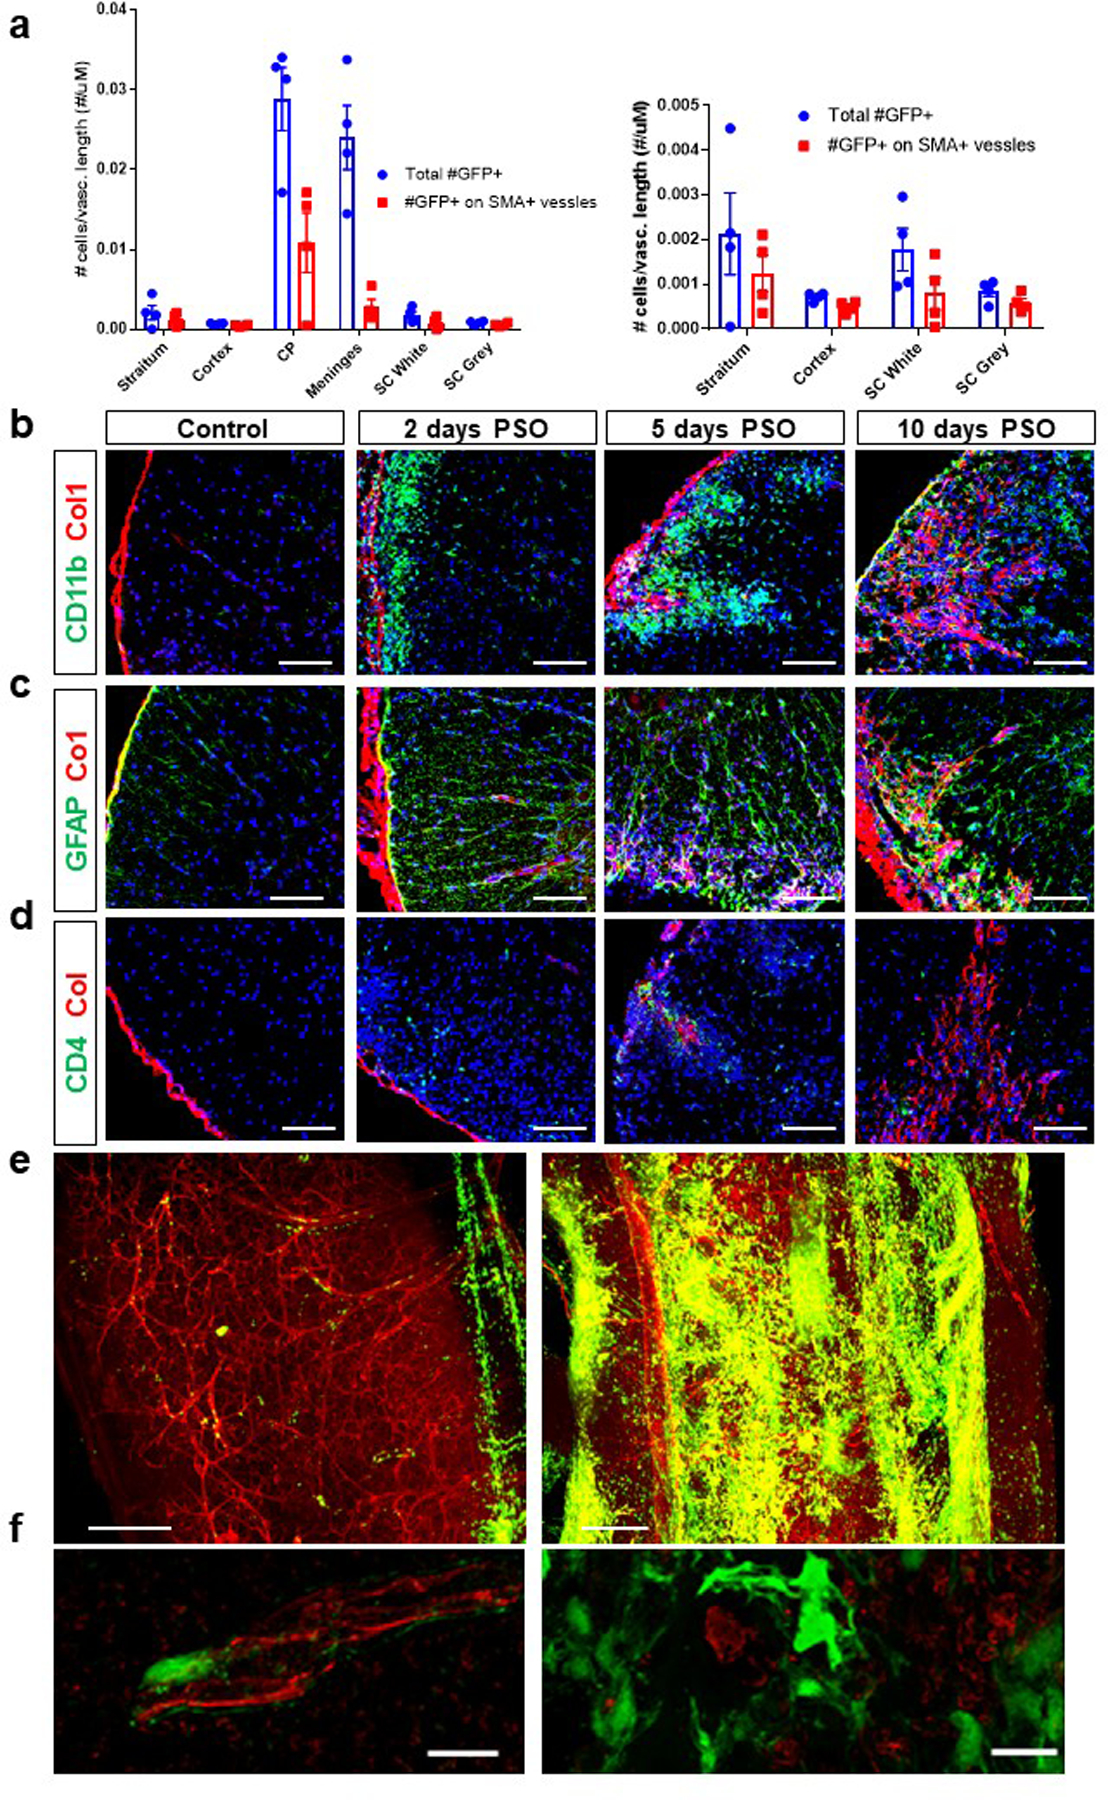
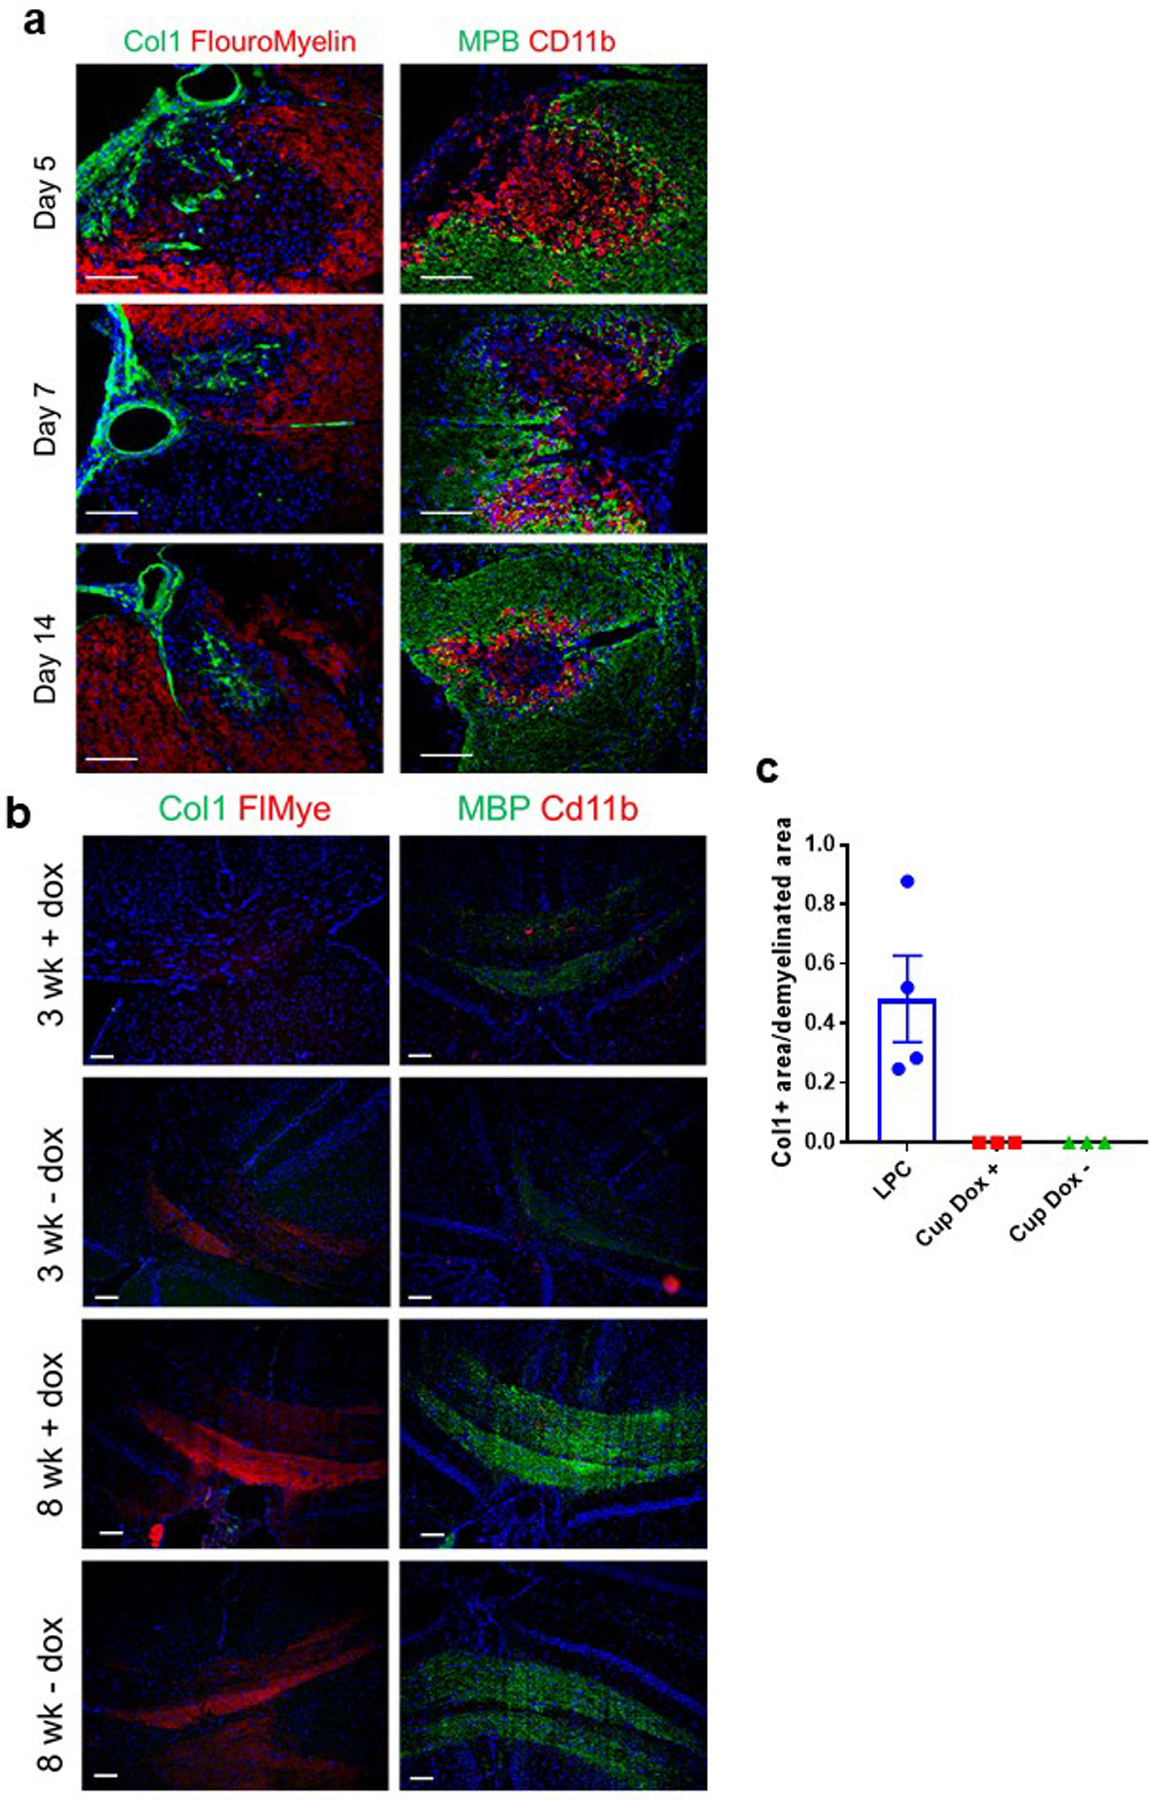
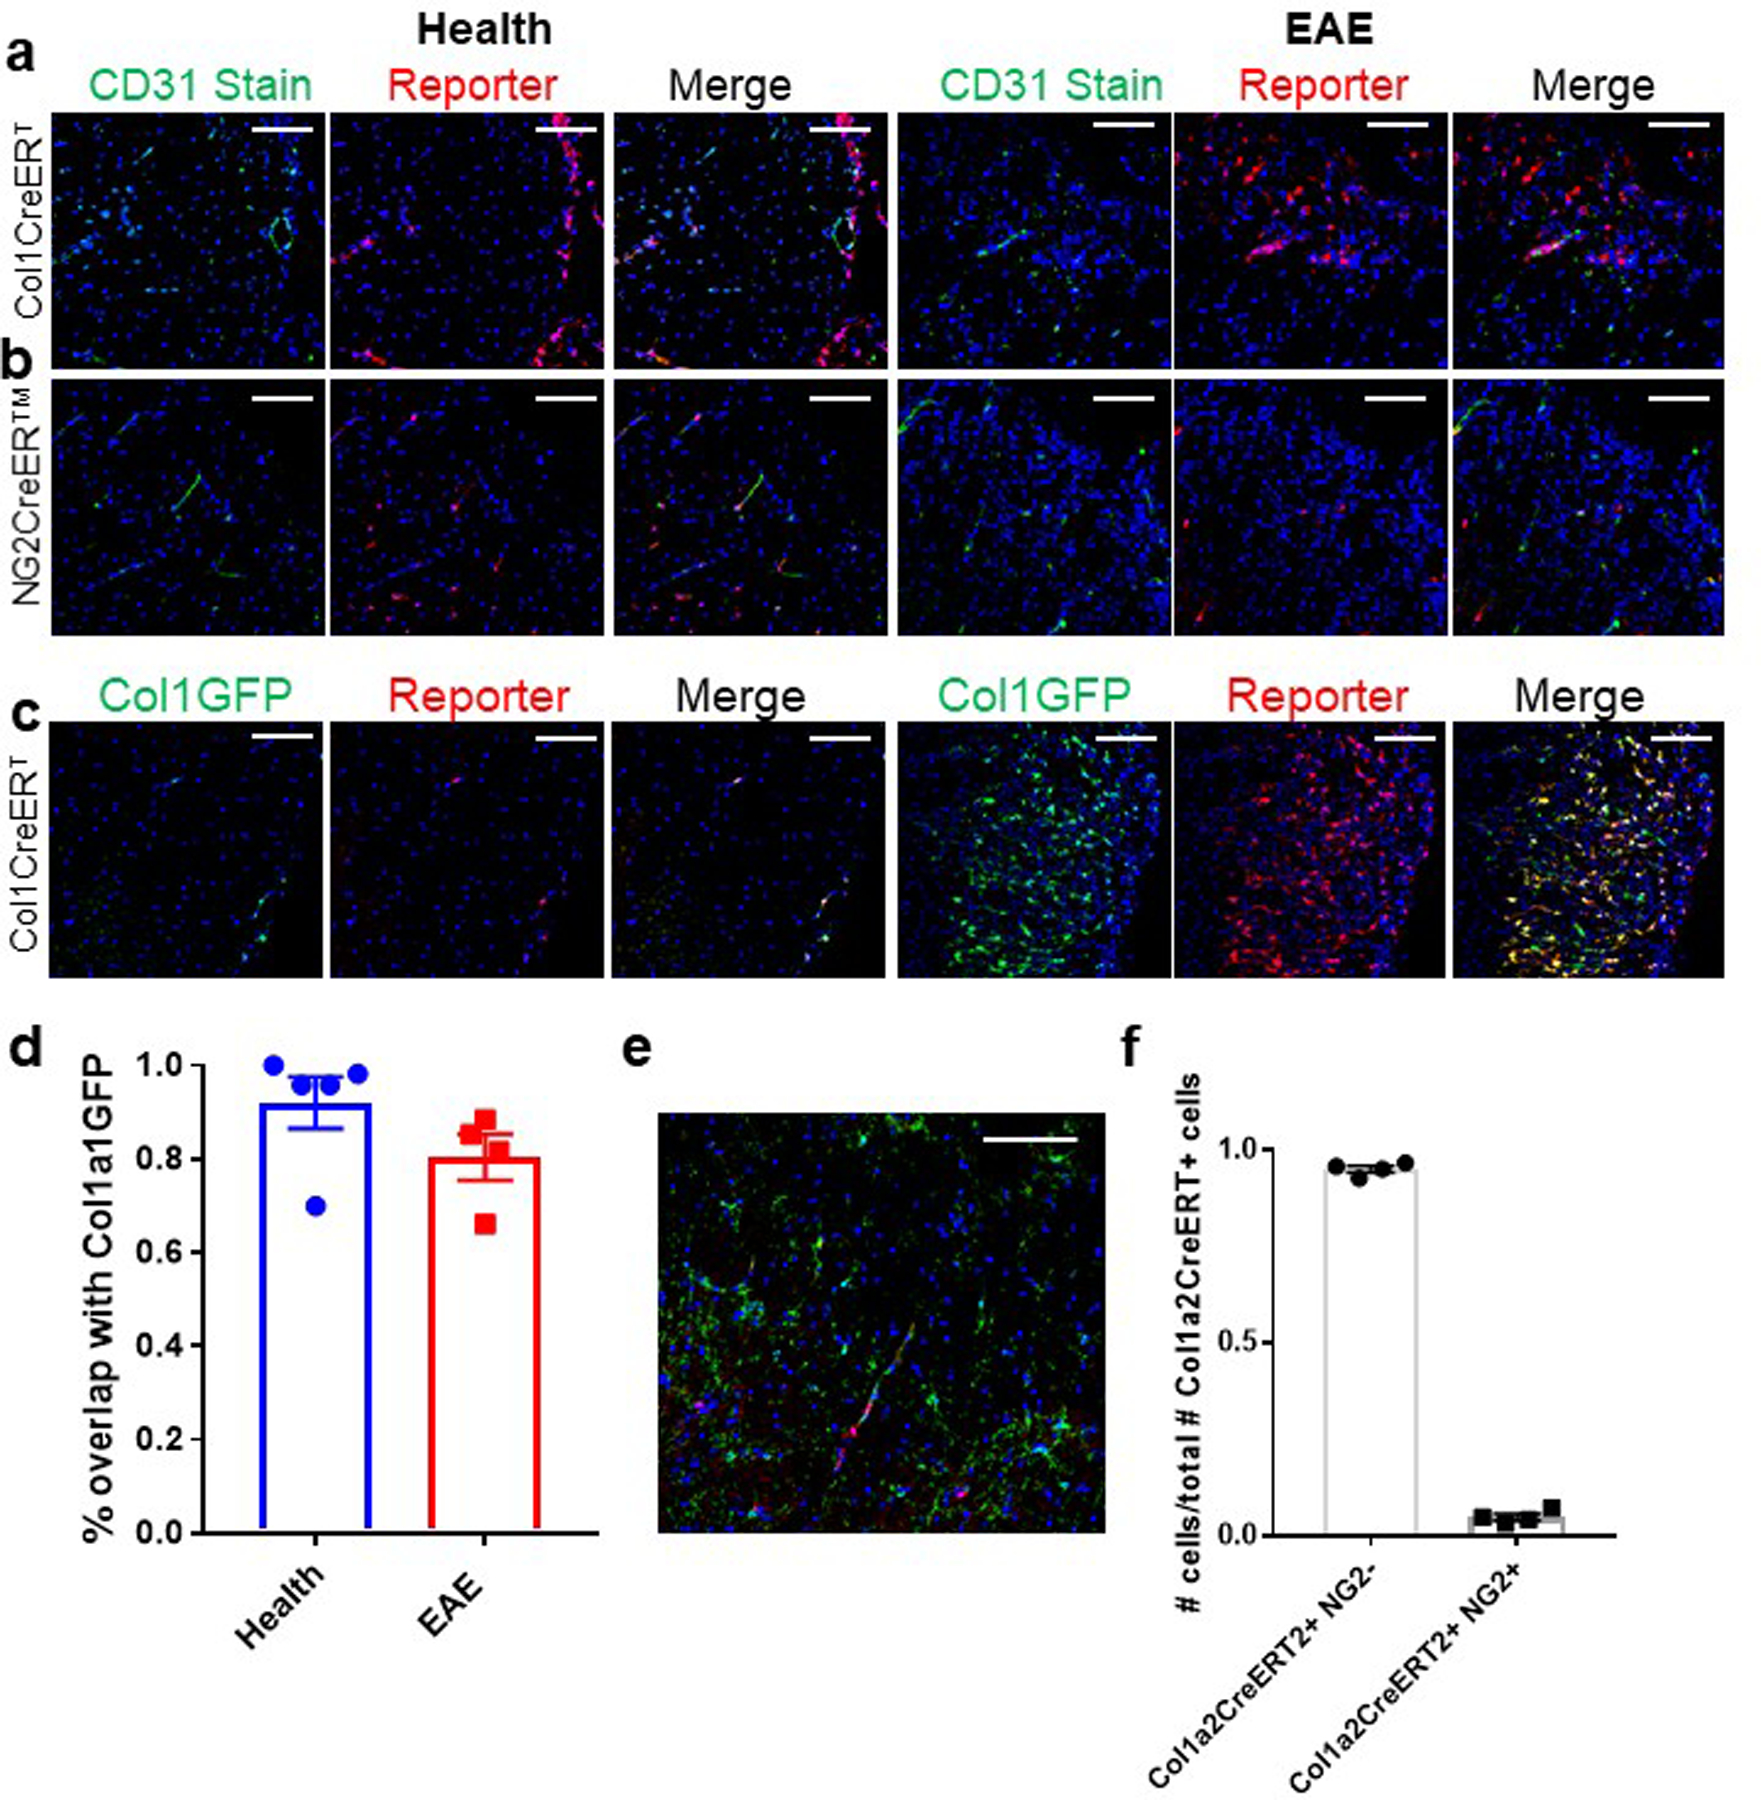
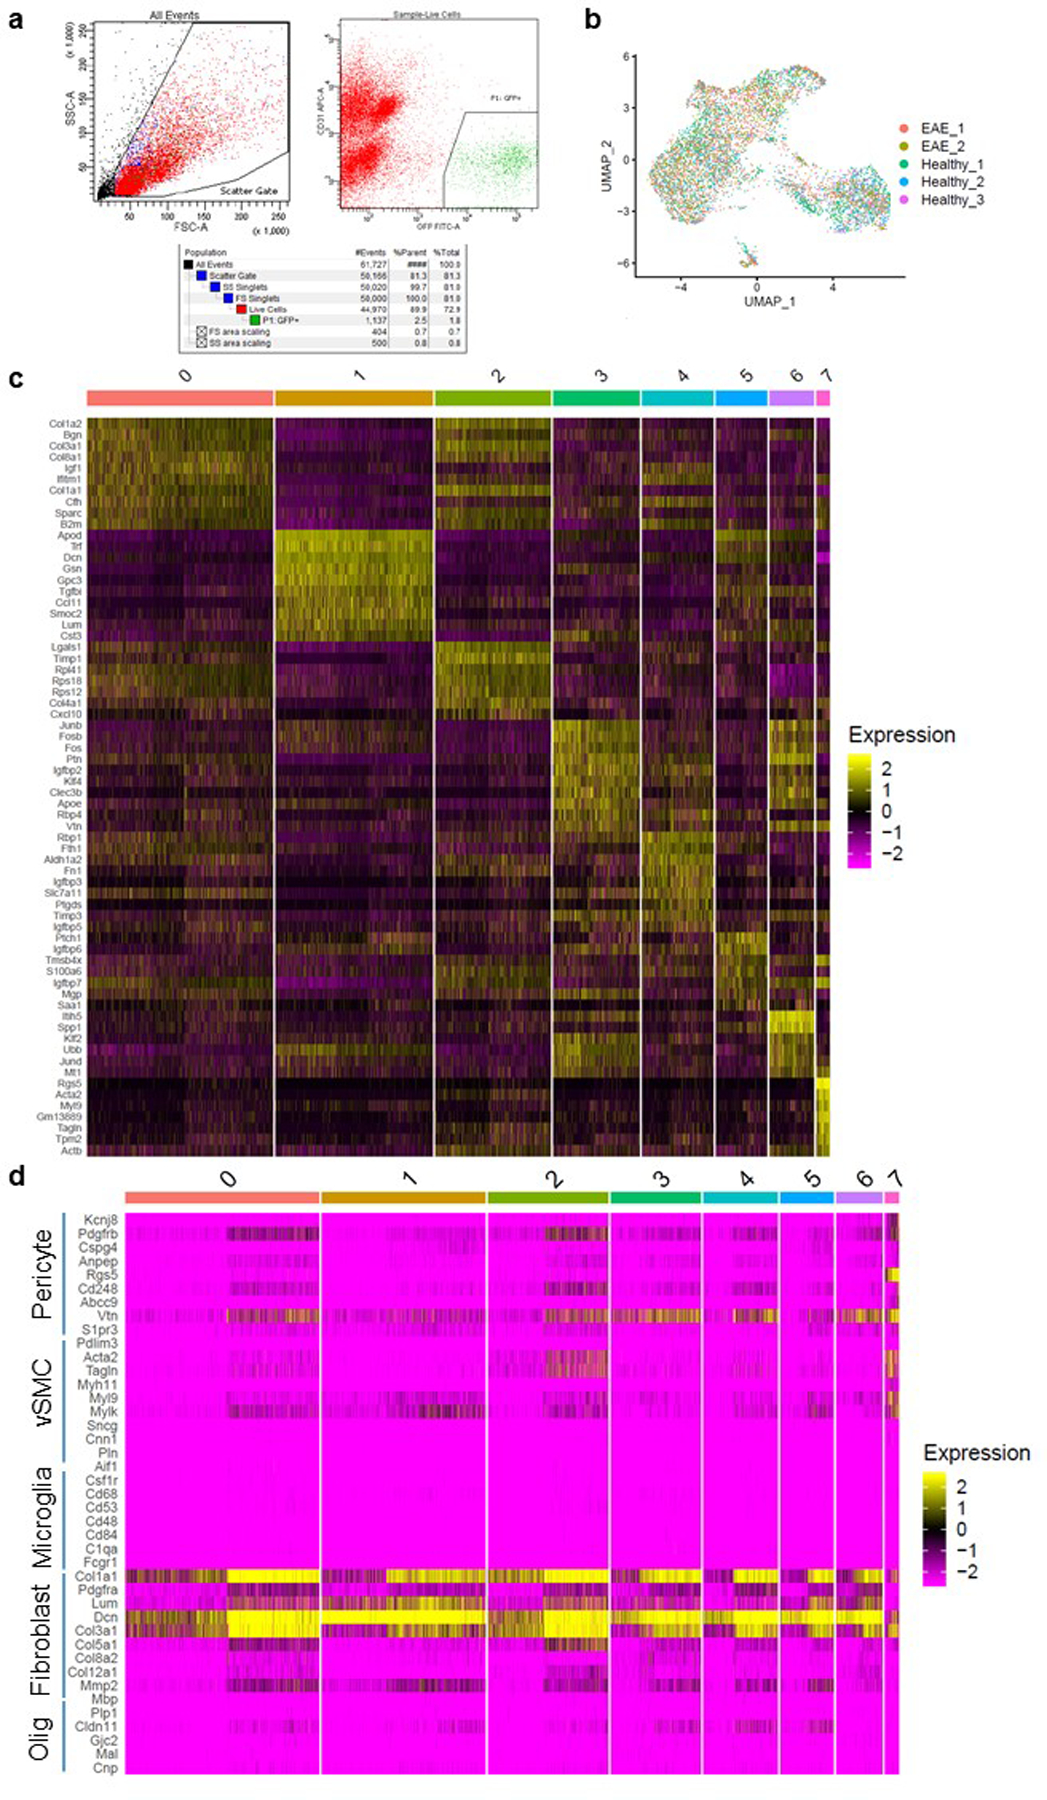
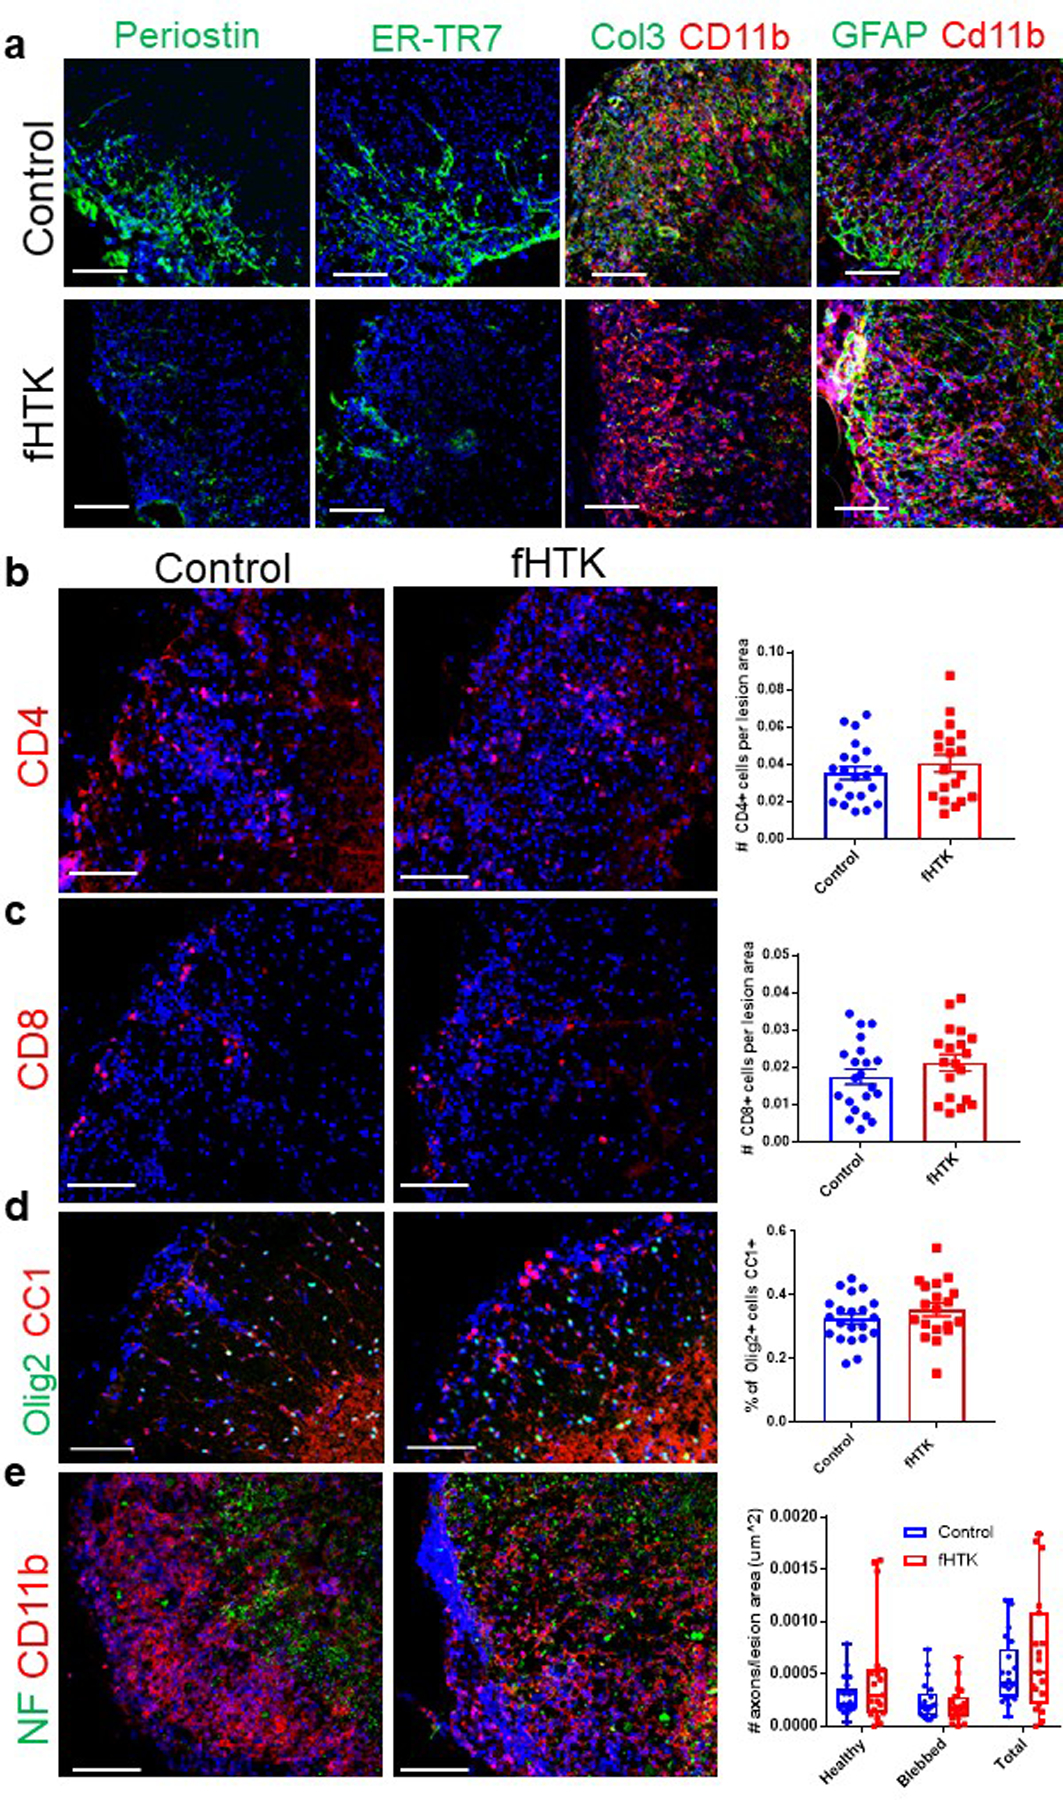
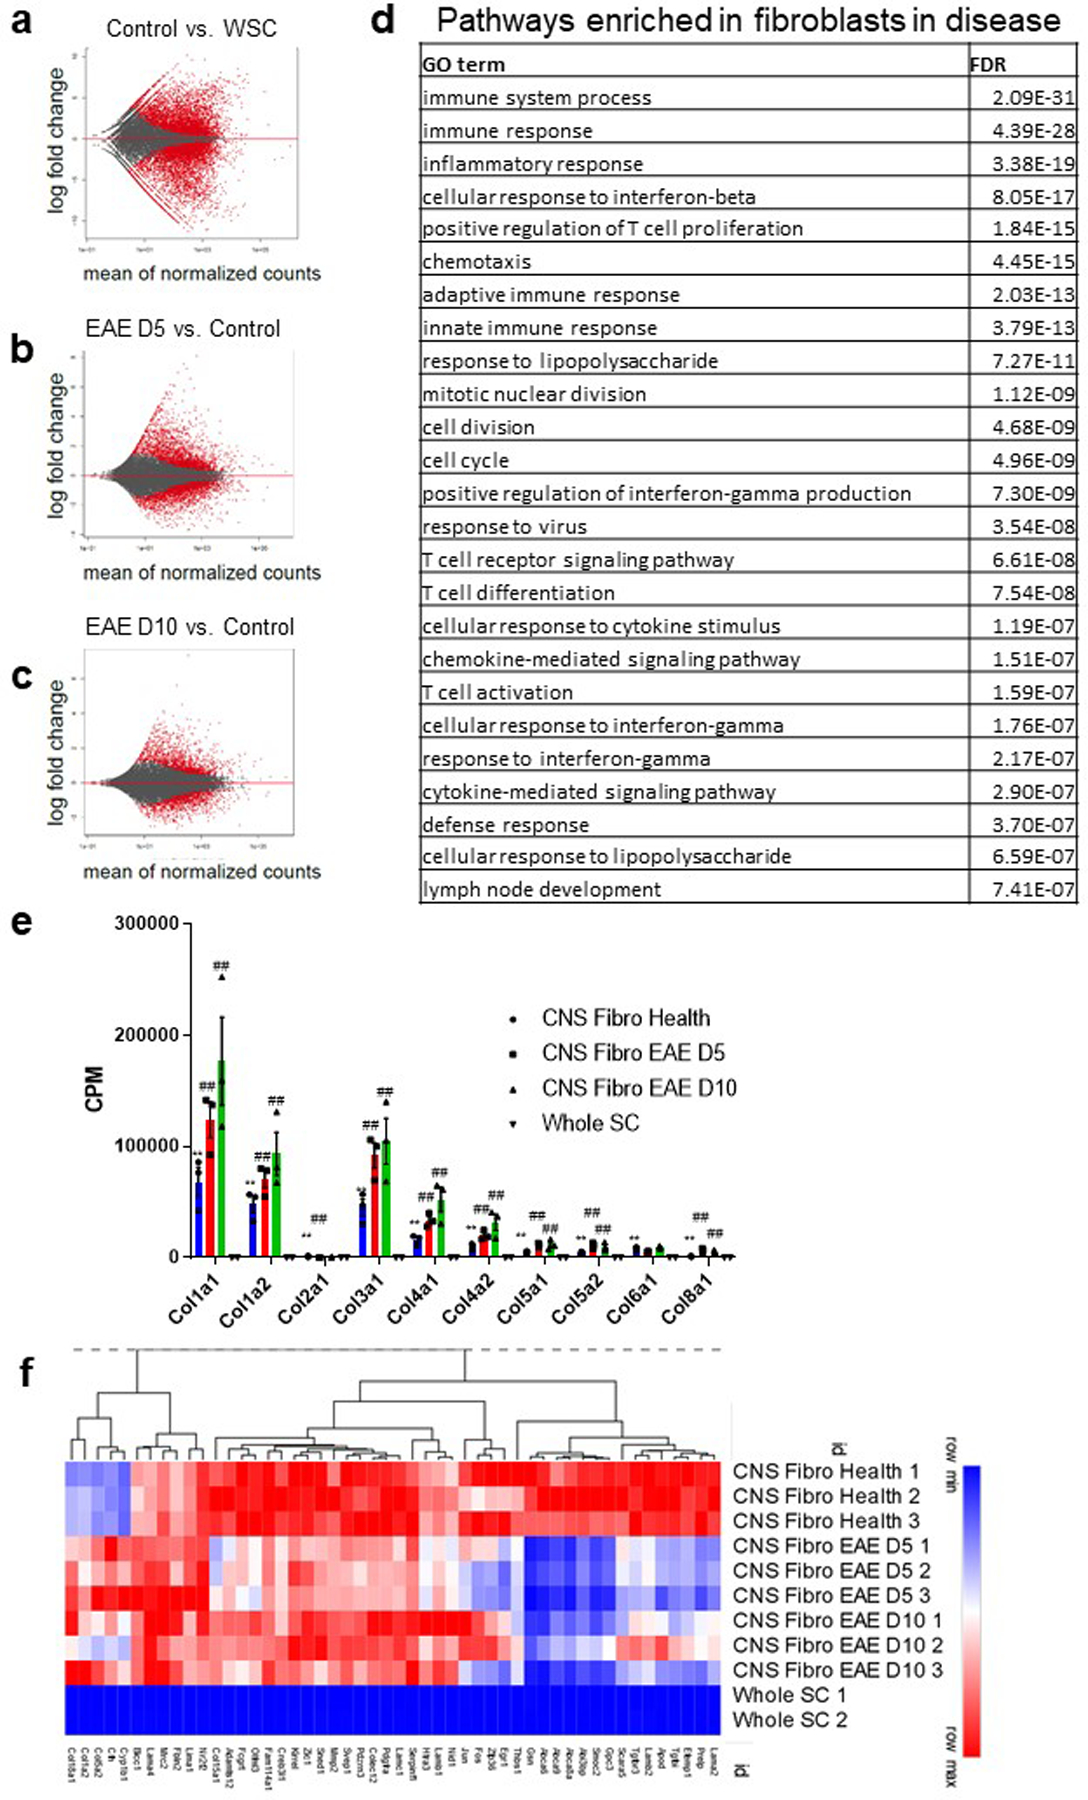
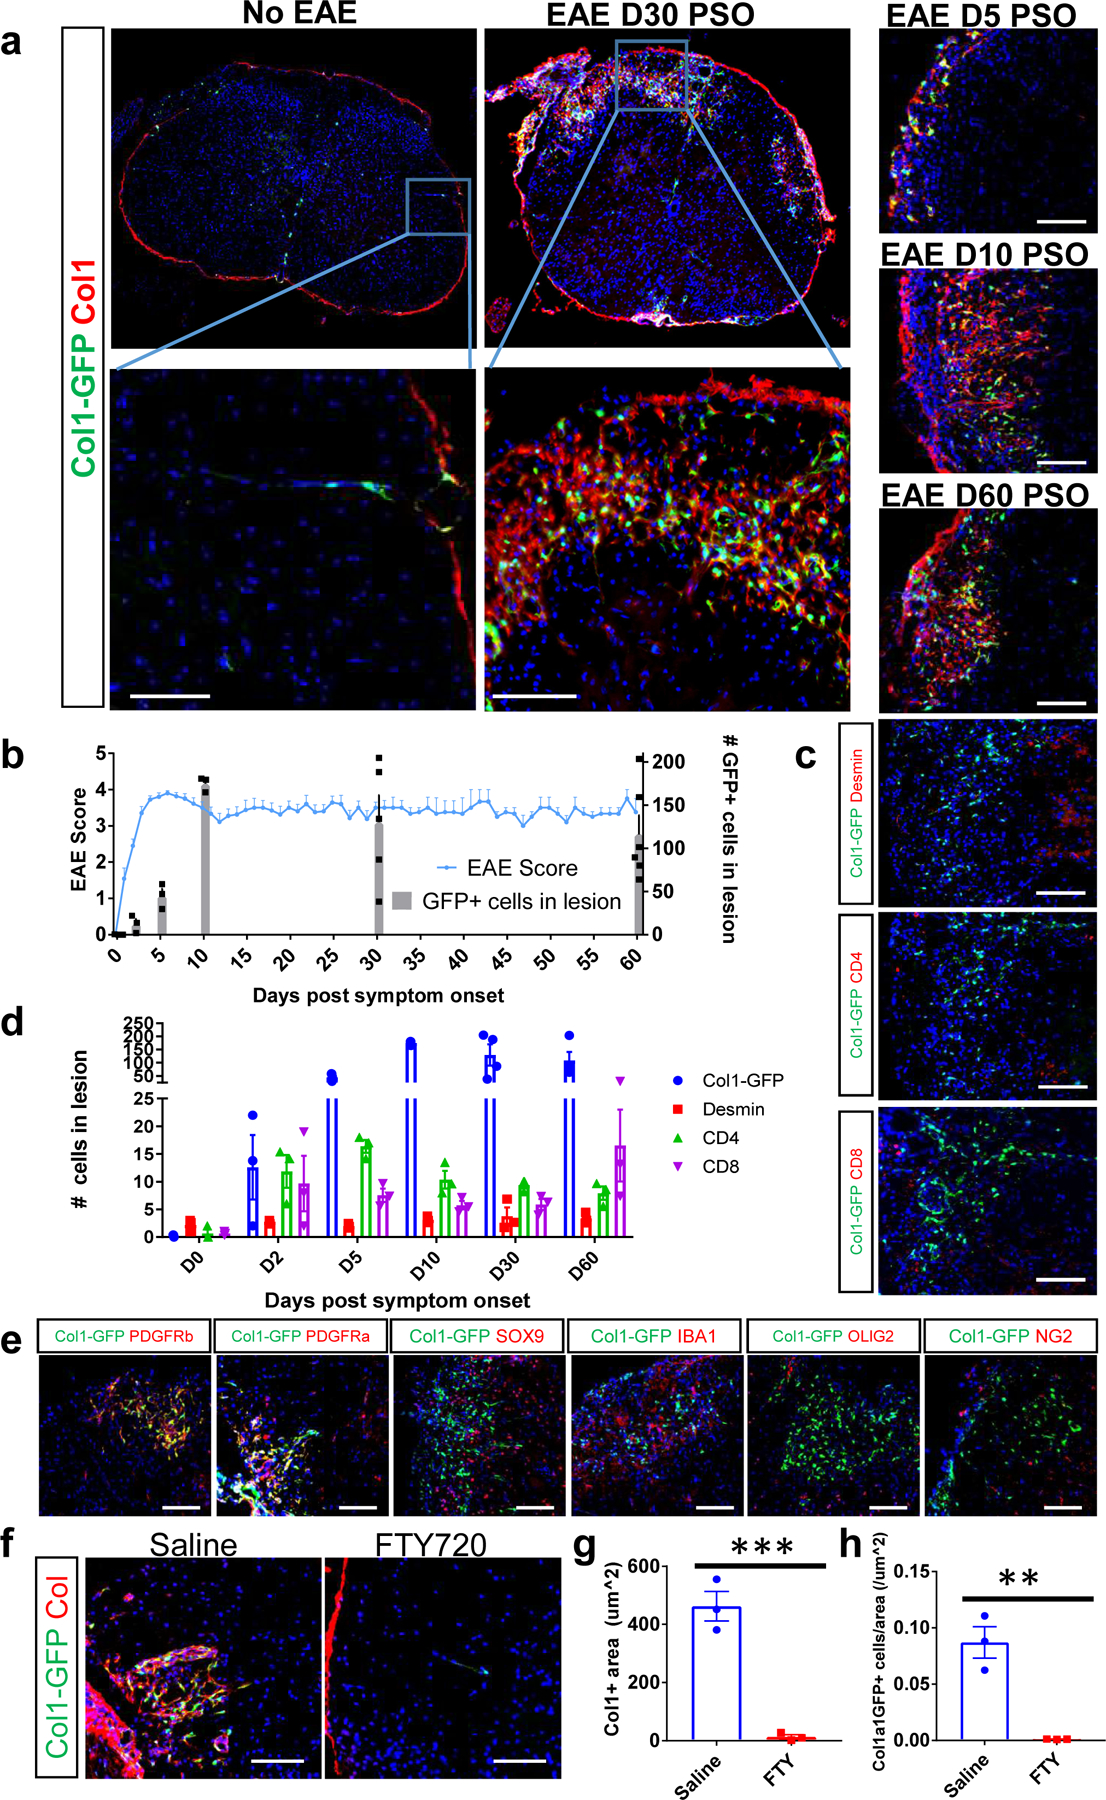
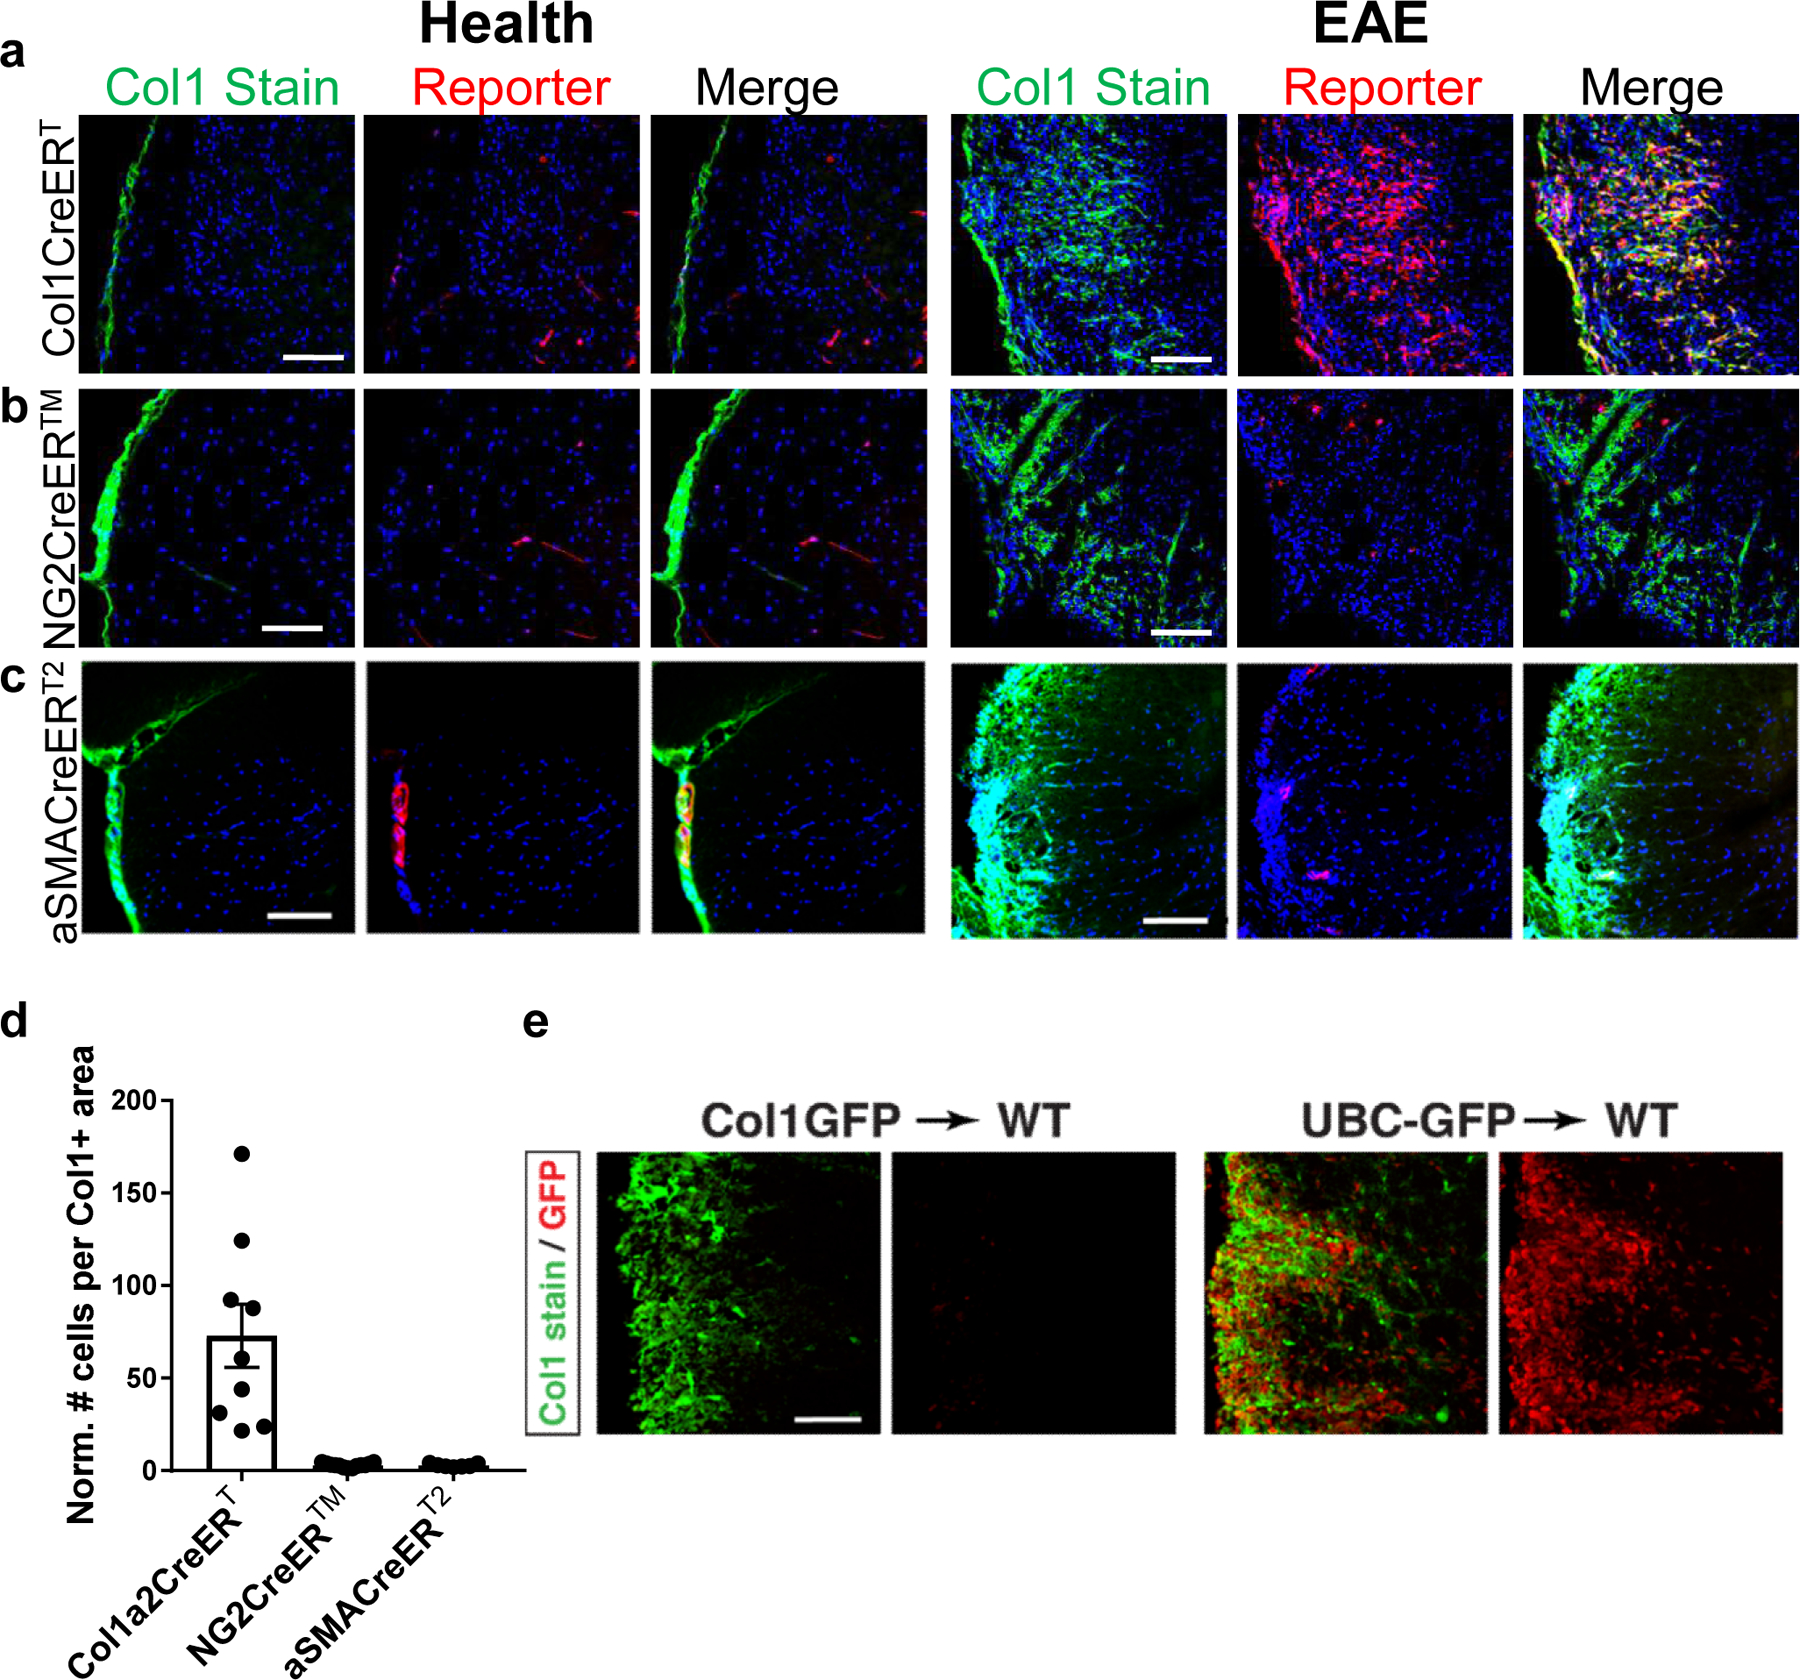
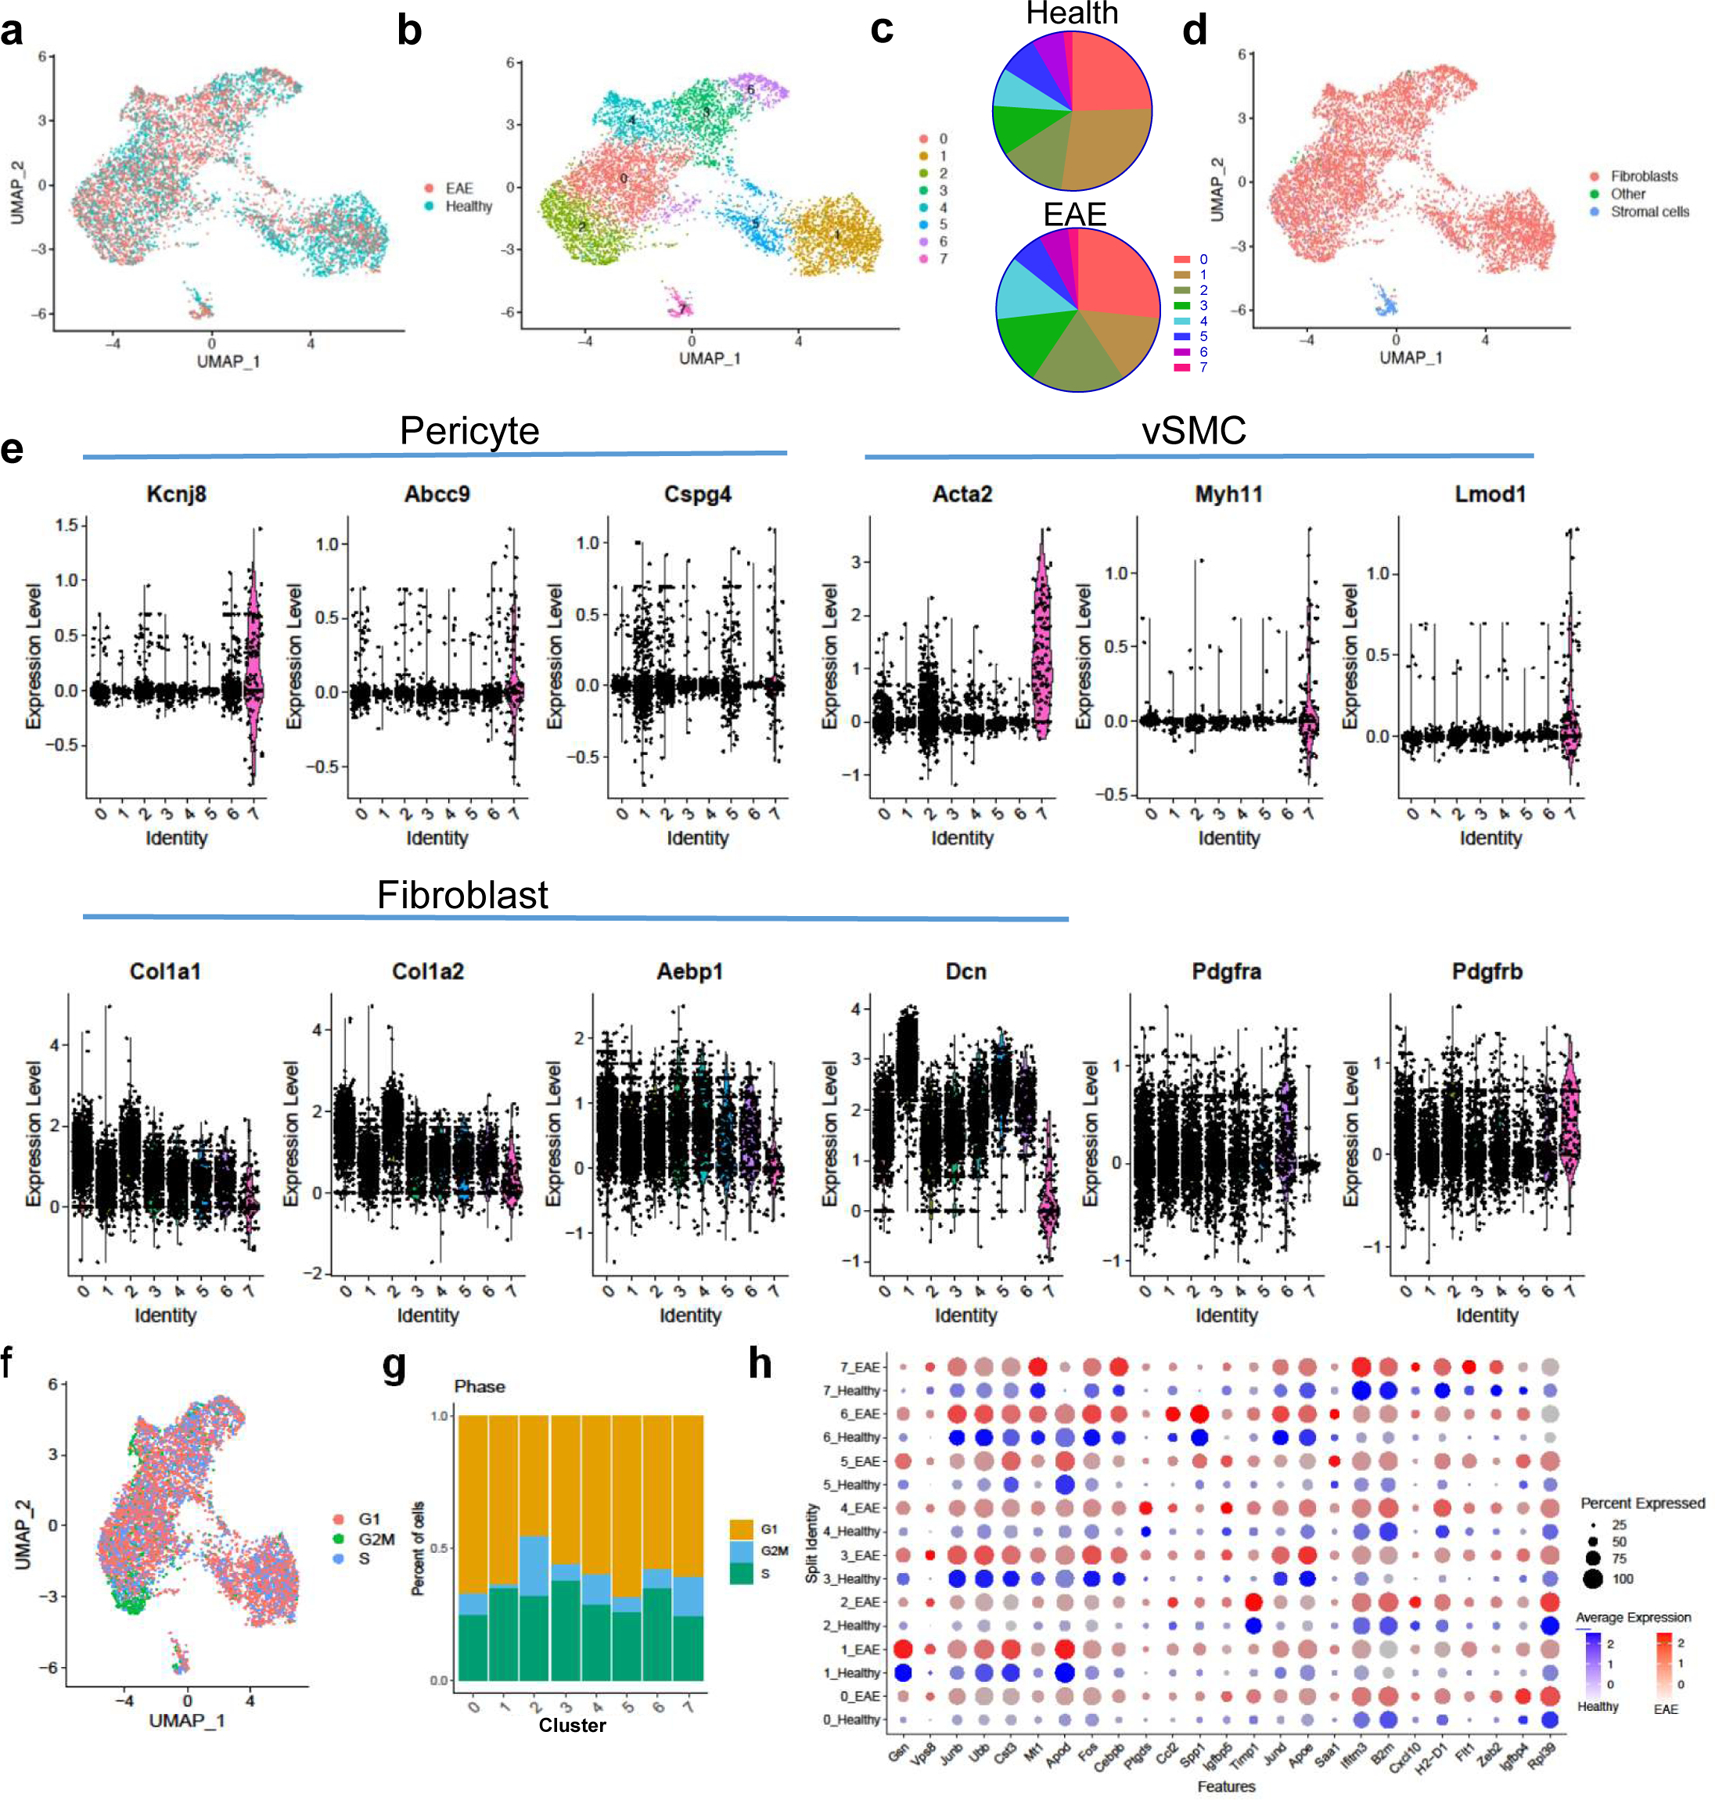
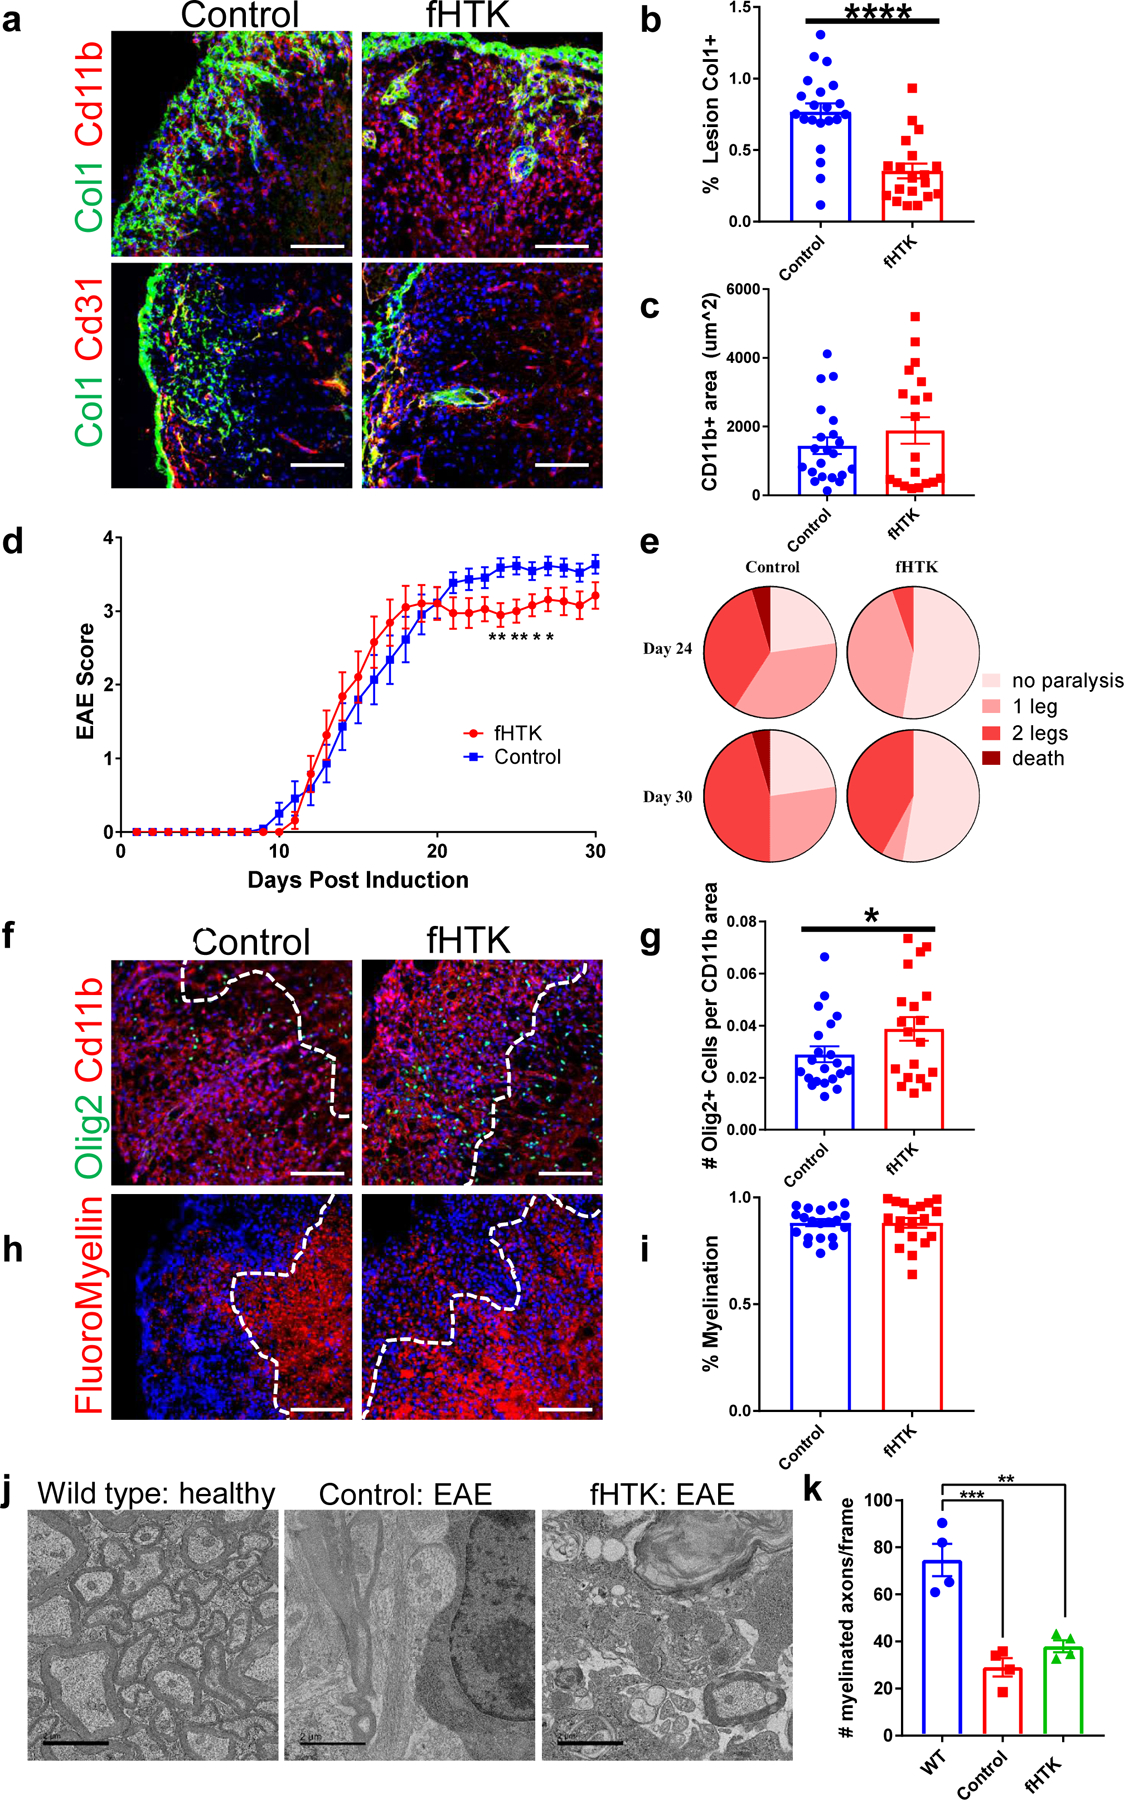
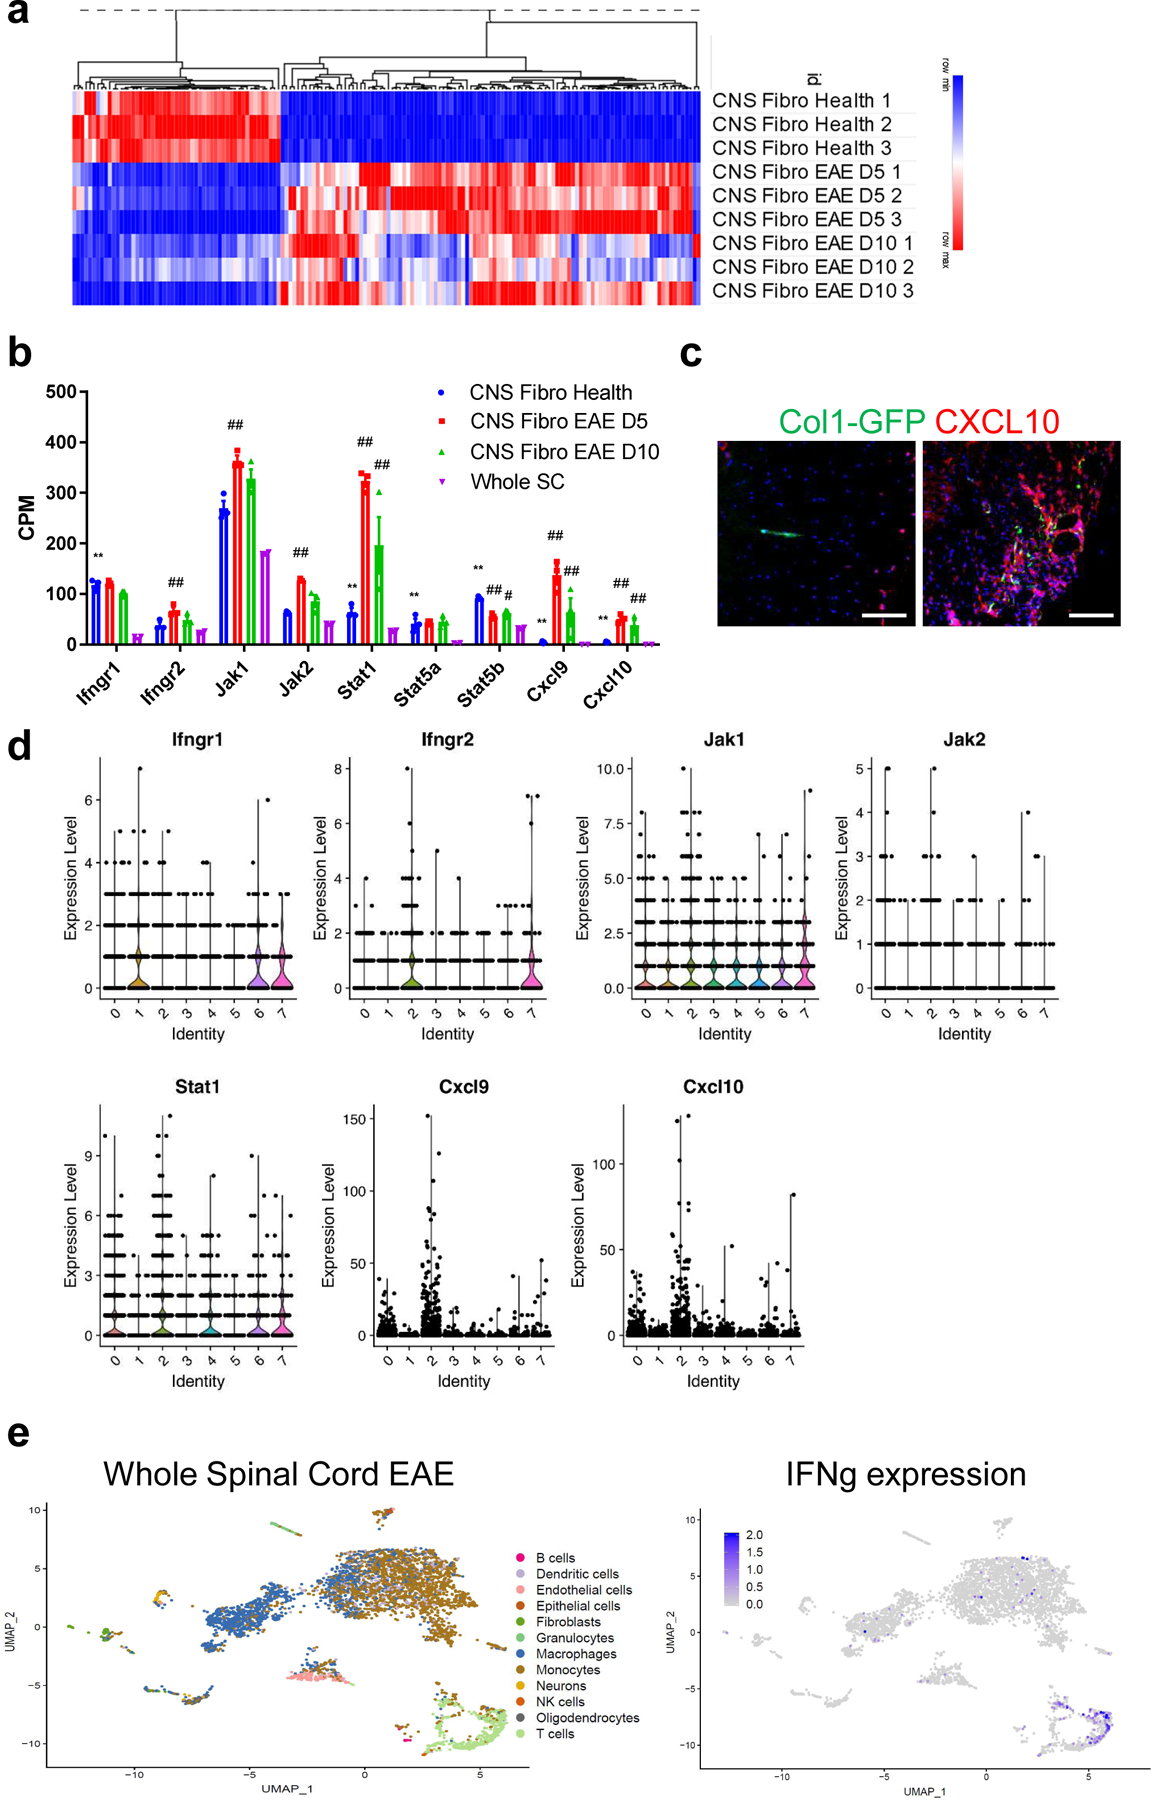
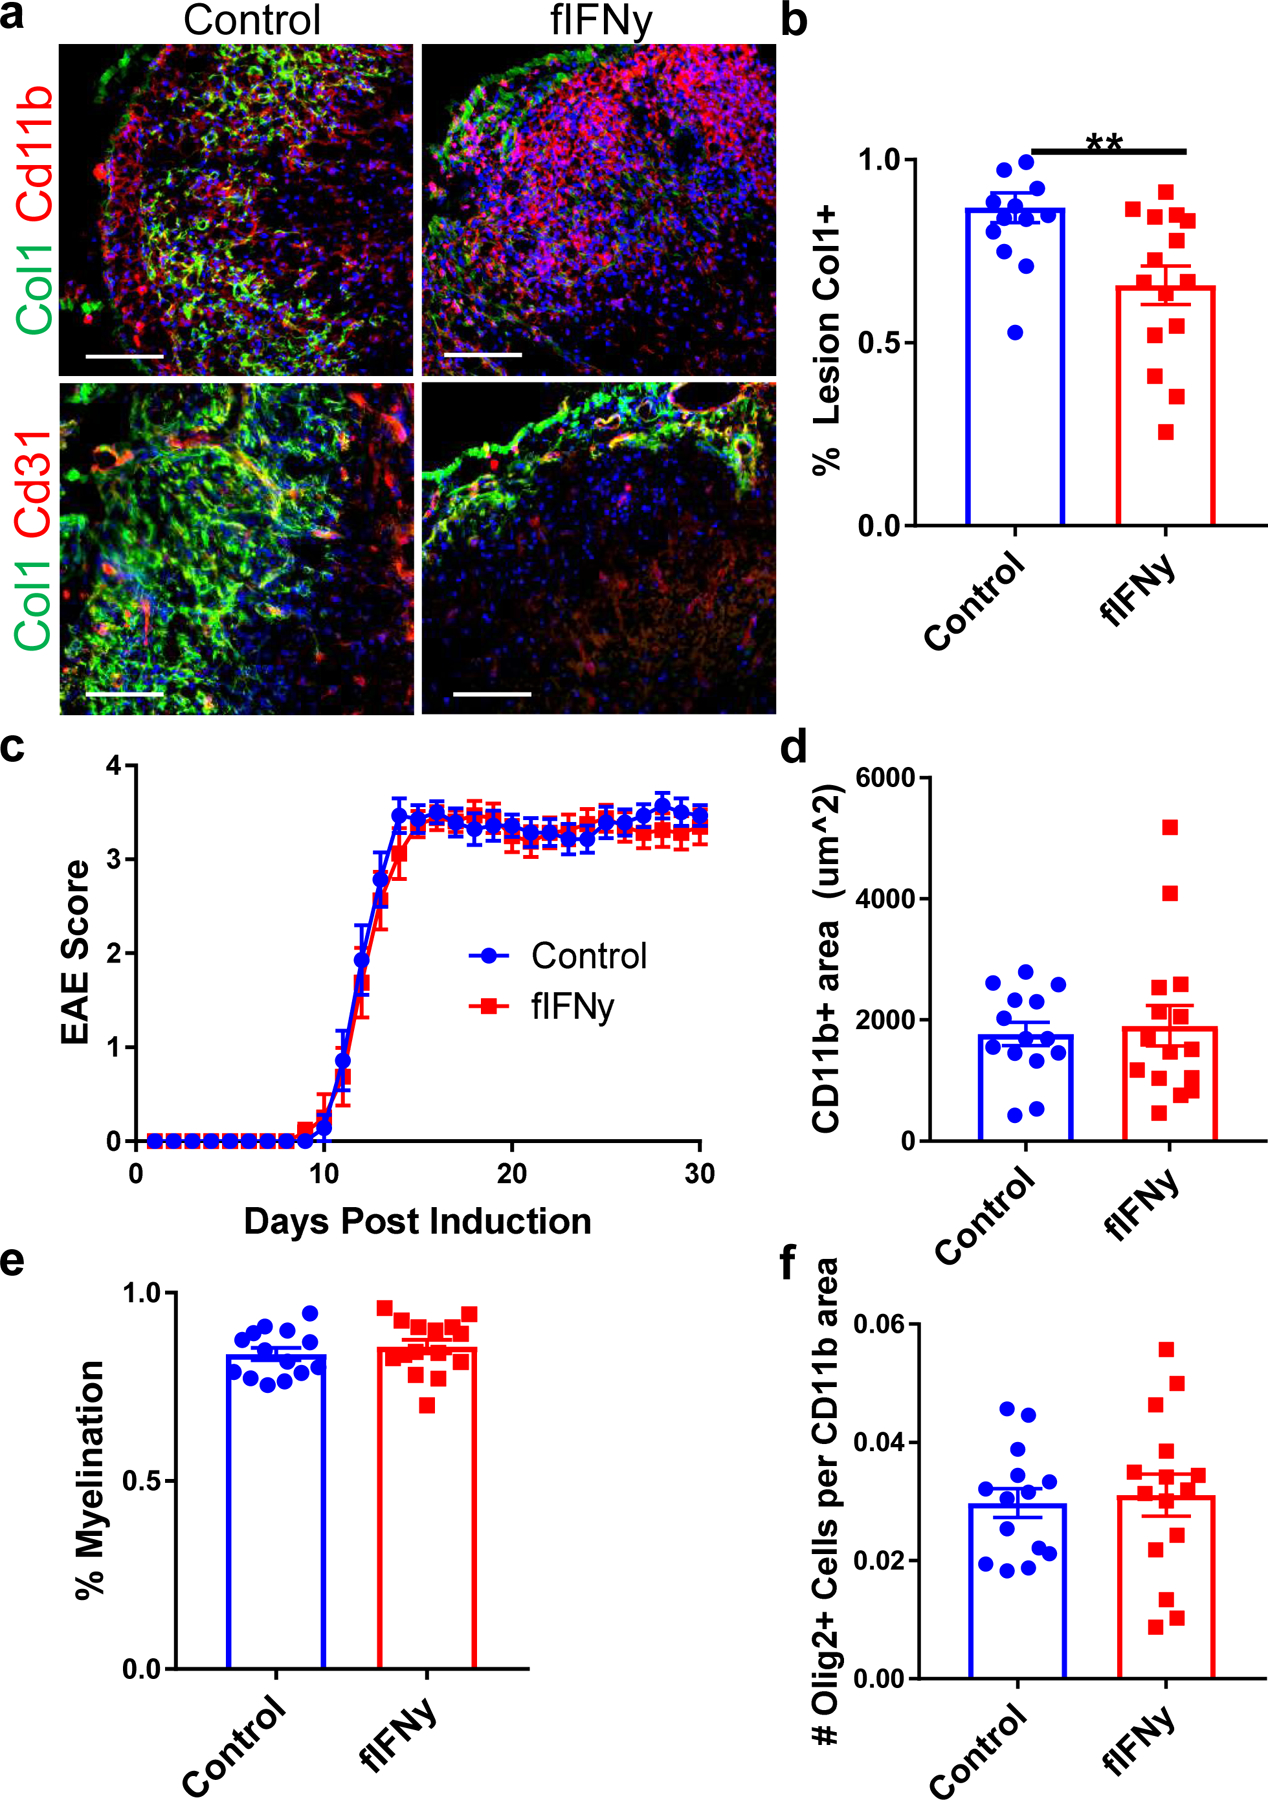
Fibrosis is a common pathological response to inflammation in many peripheral tissues and can prevent tissue regeneration and repair. Here, we identified persistent fibrotic scarring in the CNS following immune cell infiltration in the experimental autoimmune encephalomyelitis (EAE) mouse model of multiple sclerosis. Using lineage tracing and single-cell sequencing in EAE, we determined that the majority of the fibrotic scar is derived from proliferative CNS fibroblasts, not pericytes or infiltrating bone marrow-derived cells. Ablating proliferating fibrotic cells using cell-specific expression of herpes thymidine kinase led to an increase in oligodendrocyte lineage cells within the inflammatory lesions and a reduction in motor disability. We further identified that interferon-gamma pathway genes are enriched in CNS fibrotic cells, and the fibrotic cell-specific deletion of Ifngr1 resulted in reduced fibrotic scarring in EAE. These data delineate a framework for understanding the CNS fibrotic response.


Conflict of interest statement

Competing interests: The authors declare no competing interests.

Figures

Extended Data Figure 1.
Extended Data Figure 1.. Col1a1-GFP+ cell localization in health and following EAE.
a. Analysis of the number of Col1a1-GFP+ cells per total vascular length and smooth muscle actin (SMA)+ vascular length in different CNS regions in healthy adult mice. CP= choroid plexus, SC= spinal cord white or grey matter, ± s.e.m., n=4, Col1a1-GFP mice. b-d. Spinal cord sections from wild type mice in health or with EAE at 2, 5 or 10 days PSO were stained with Col1 (red), DAPI (blue) and CD11b (b, green), GFAP (c, green), or CD4 (d, green) Scale bars = 100 µm. e. Light sheet microscopy image of a Col1a1-GFP mouse in health (left) and one with EAE (right) 10 days PSO perfused with tomato lectin and optically cleared, scale bars = 200 µm. f. Confocal microscopy images of Col1a1-GFP spinal cords from health (left) and EAE (right) stained for CD31 in red, scale bars = 10 µm.
Extended Data Figure 2.
Extended Data Figure 2.. Fibrotic scarring is present in the LPC, but not cuprizone, model of demyelination.
a. Spinal cord sections from mice either 5, 7, or 14 days post LPC injection into the spinal cord stained for either Col1 (green) and FluoroMyelin (red) or myelin basic protein (MBP) (green) and Cd11b (red). b. Brain sections in the area of the corpus callosum from GFAP/tTA;TRE/IFN-γ mice following cuprizone administration. GFAP/tTA;TRE/IFN-γ mice received doxycycline starting from birth, and half of the mice were taken off of doxycycline at 6 weeks of age (- dox) to induce the expression of interferon gamma in the CNS. Both the +dox and -dox groups were divided into two groups. The first group (3 wk) was given cuprizone for 3 weeks and then analyzed at the end of the 3 week period. The second group (8 wk) was given cuprizone for 5 weeks and then analyzed 3 weeks after completion of the cuprizone administration. All brains were stained for either Col1 (green) and FluoroMyelin (red) or myelin basic protein (MBP) (red) and Cd11b (green).c. Quantification of the proportion of the demyelinated area that is Col1+ from mice 7 days post LPC injection (n=4) or mice 3 weeks post cuprizone administration with and without doxycycline (n=3 each), ± s.e.m.
Extended Data Figure 3.
Extended Data Figure 3.. Col1a2CreERT and NG2CreERTM reporter expression.
Spinal cords of Col1a2CreERT;Rosa-tdTomato (a) or NG2CreER™;Rosa-tdTomato (b) mice in health or EAE 10 d PSO were stained with CD31 in green and DAPI in blue. Scale bars = 100 µm. c. Spinal cords of Col1a2CreERT;Rosa-tdTomato;Col1a1-GFP mice in health or 10 days EAE PSO were imaged for both reporters. The percentage of Col1a1-GFP+ cells that were also positive for the tomato reporter in health and EAE is quantified in (d), ± s.e.m., n = 5 health, 4 EAE. e. Col1a2CreERT;Rosa-tdTomato mice were stained with NG2 in red, and the proportion of Col1a2CreERT+ cells that were NG2+ and NG2− were quantified in (f), ± s.e.m., n = 4. Scale bars = 100 µm
Extended Data Figure 4.
Extended Data Figure 4.. Single-cell sequencing: cell purification and cluster expression.
a. Sample FACS plots of the purification of Col1a1-GFP+ cells used for the single-cell sequencing analysis of Col1a1-GFP+ cells in health and EAE. b. UMAP plot of the single-cell RNA-seq dataset of Col1a1-GFP+ cells in health and EAE with the individual sample identity labeled for each cell. c. Heat map depicting the expression of the 10 most differentially expressed genes in each cluster based on the logFC of the dataset. d. Heat map depicting the expression levels of genes specific to the labeled cell types, Olig = oligodendrocyte.
Extended Data Figure 5.
Extended Data Figure 5.. Effects of reducing fibrotic scar formation on immune cell infiltration, oligodendrocyte lineage cell populations and axon numbers.
a. Spinal cord sections from fHTK mice and controls were stained for DAPI (blue) and periostin (green), ER-TR7 (green), Col3 (green) and CD11b (red), or GFAP (green) and Cd11b (red). b. Spinal cord sections from fHTK mice and controls were stained for CD4 (red, left) and DAPI (blue) and the number of CD4+ cells per lesion area was compared between groups (right), p = 0.38 by Student’s two-tailed t-test, ± s.e.m., n=21 control and 19 fHTK. c. Spinal cord sections from fHTK mice and controls were stained for CD8 (red, left) and DAPI (blue) and the number of CD8+ cells per lesion area was compared between groups (right), ± s.e.m., p = 0.22 by Student’s two-tailed t-test, n=21 control and 19 fHTK. d. Spinal cord sections from fHTK mice and controls were stained for OLIG2 in green and CC1 in red, and the percent of OLIG2+ cells that were also CC1+ was quantified, ± s.e.m., p = 0.26 by Student’s two-tailed t-test e. Spinal cord sections from fHTK mice and controls were stained for neurofilament heavy polypeptide (NF) in green and CD11b in red, and the number of healthy, blebbed and total axons was quantified, ± s.e.m.. Scale bars = 100 µm
Extended Data Figure 6.
Extended Data Figure 6.. Col1 reduces OPC migration, but not proliferation or differentiation, in vitro.
a. Representative images of OLIG2 (green) and PDGFRa (red) staining with EdU labeling (cyan) in rat OPC cultures on PLL, laminin, fibronectin, or collagen I after a 2 hour incubation in 10 uM EdU. b, Quantification of the percentage of EdU+ OPCs (OLIG2+PDGFRa+) for cultures represented in a., ± s.e.m., n = 9 replicates. c. Representative images of MBP (red) staining in rat OPC cultures on PLL, laminin, fibronectin, or collagen I three days after removal of PDGF-AA. Cell nuclei detected with DAPI (blue). d. Quantification of MBP+ cells over total cells (DAPI+) for cultures represented in c., ± s.e.m., n = 9 replicates. e. Representative images of PDGFRa (green) staining with DAPI in rat OPC cultures that had migrated through transwells coated with PLL, laminin, fibronectin, or collagen I following a 24 hour incubation. f, Quantification of PDGFRa+ cells on the underside of each transwell for the cultures represented in e., ± s.e.m., n = 9 replicates. Data displayed represent 3 replicates of 3 samples, each containing cells from three pooled postnatal day 7 rats. Comparisons were performed using one-way ANOVA with Sidak’s post hoc tests, ****p<0.0001, ***p<0.001, *p<0.05. Scale bars = 100 µm
Extended Data Figure 7.
Extended Data Figure 7.. RNA sequencing analysis of Col1a1-GFP+ cells from the spinal cord in health and EAE.
a–c. MA plots comparing the transcriptome of CNS fibroblasts in health with whole spinal cord tissue (a), CNS fibroblasts in health with CNS fibroblasts EAE D5 (b) or D10 (c) PSO with red dots signifying genes with FDR < 0.1. d. Pathway analysis using DAVID Bioinformatics Resources 6.8, NIAID/NIH, GOTERM_BP_DIRECT for genes with a log2 fold change greater than 2 for CNS fibroblasts EAE D5 PSO compared to CNS fibroblasts in health. e. CPM of collagen genes from the bulk sequencing of whole spinal cord tissue (Whole SC, n = 2), CNS fibroblasts from health (CNS Fibro Health, n = 3) CNS fibroblasts 5 days PSO (CNS Fibro EAE D5, n = 3) and 10 days PSO (CNS Fibro EAE D10, n = 3), ± s.e.m., *FDR < 0.05, **FDR < 0.01 to Whole SC, #FDR < 0.05, ##FDR < 0.01 to CNS Fibro Health. f. Heat map of the expression levels of the top genes differentially expressed in CNS Fibro Health (each expressed at least 1 CPM in each control sample) compared to the whole spinal cord by FDR.
Figure 1:
Figure 1:. Fibrotic scar formation occurs in EAE lesions.
a. Spinal cord sections from Col1a1-GFP mice in health or with EAE were stained for collagen I (red) to label the fibrotic scar, DAPI to label nuclei (blue) and visualized for the GFP reporter (green). Left: whole spinal cord cross sections (top) with specific area magnified (bottom) for Col1a1-GFP mice in health or 30 days EAE post symptom onset (PSO). Right: Magnified spinal cord cross section areas from Col1a1-GFP mice 5, 10 or 60 days PSO. b. Quantification of the number of Col1a1-GFP+ cells per lesion (bar graph) was compared with EAE motor symptoms (line graph) over the course of EAE, (± s.e.m.; n=3–6 per time point for cell quantification, 4–11 for EAE score). c. Spinal cord sections from Col1a1-GFP mice were stained with desmin, CD4 or CD8 (red) over the course of EAE, and the number of positive cells for each marker was quantified in (d), ± s.e.m., n= 3–4 mice per marker per time point. e. Spinal cords from Col1a1-GFP mice with EAE at 10 or 30 days PSO were stained with DAPI (blue) and molecular markers for various cell types (red). GFP+ cells are immune-reactive for both PDGFRα and PDGFRβ, but not for markers of astrocytes (SOX9), microglia/macrophages (IBA1), oligodendrocyte lineage cells (OLIG2) or mural cells (NG2). f. Spinal cord sections from Col1a1-GFP mice with EAE treated daily with either saline or 2 mg/kg FTY720 and collected when the mice administered saline reached 8–10 d PSO were stained with Col1 in red. The collagen area and number of Col1a1-GFP+ cells per area is quantified in g, h, ± s.e.m, n = 3 per condition, ***p = 0.0009, **p = 0.0035 by an unpaired, two-tailed t-test. Scale bars = 100 µm.
Figure 2:
Figure 2:. Scar-forming cells arise from cells that produce collagen at rest, and not mural cells.
a–d. Sections from spinal cords of Col1a2CreERT;Rosa-tdTomato (a), NG2CreER™;Rosa-tdTomato (b), or aSMACreERT2;Rosa-tdTomato (c) mice with EAE were stained for Col1 (green) and DAPI (blue) and visualized for tdTomato reporter (red). d. The number of reporter cells within the Col1+ area was normalized to the number of reporter cells in white matter in health (± s.e.m., n=7 health, 9 EAE for Col1a2CreERT, n=7 health, 8 EAE for NG2CreER™, n=4 health, 7 EAE for aSmaCreERT2, p<0.0001 using a one way ANOVA with multiple comparisons, p<0.0001 for Col1a2CreERT vs. NG2CreER™, p=0.0001 for Col1a2CreERT vs. aSMACreERT2 and p>0.9999 for NG2CreER™ vs aSMACreERT2). e. Spinal cord sections from mice with Col1a1-GFP donor bone marrow (left) or UBC-GFP donor bone marrow (right) with EAE at 10 days PSO were stained with Col1 (green), and the GFP was visualized in red (representative images for experiment with n=8 for Col1a1-GFP, n=5 for UBC-GFP). All scale bars = 100 µm.
Figure 3:
Figure 3:. Scar-forming cells have the transcriptional profile of fibroblasts at the single cell level.
a–d. Col1a1-GFP+ cells from spinal cords of healthy mice (n=3 samples with 2–3 spinal cords each) and mice with EAE 5–7 days PSO (n=2 samples, 2 spinal cords each) were transcriptionally profiled at the single cell level and clustered using Seurat v3. a. UMAP plot with the sample identity (Health vs. EAE) labeled for each cell. b. UMAP plot of the clustering analysis reveals 8 clusters that could be subdivided into three classes: Class 1 (clusters 0,2,3,4,6), Class 2 (clusters 1,5), and Class 3 (cluster 7). c. Pie charts showing the percentage of each cluster relative to the total number of cells in health or EAE. d. UMAP plot with each cell labeled with its cellular identity determined using SingleR and the Immgen reference dataset. e. Violin plots of the expression levels of pericyte, vSMC and fibroblast-specific genes per cluster. f. UMAP plot showing the transcriptional cell cycle identity per cell. g. Bar graph showing the percentage of transcriptional signatures of the different steps of the cell cycle in each cluster. h. Dot plot of selected genes that are expressed at greater levels in EAE than in health in at least one cluster.
Figure 4:
Figure 4:. Reducing fibrotic scar formation reduces disease severity in EAE.
a. Spinal cord sections from fibrotic cell-specific herpes thymidine kinase (fHTK) mice and littermate controls 30 days after EAE immunization were stained for Col1 (green), DAPI (blue) and CD11b (top, red) to label immune cells or CD31 (bottom, red) to label endothelial cells. b. Quantification of the percentage of the area of immune infiltration (denoted by CD11b) that is Col1+, ± s.e.m., **p <0.0001 by Student’s two-tailed t-test, n=21 control, 19 fHTK. c. Quantification of the total lesion size, denoted by Cd11b staining, ± s.e.m., n = 21 control, 19 fHTK, p = 0.33 by Student’s two-tailed t-test. d. EAE score for the fHTK mice and controls up to 30 days post EAE induction, ± s.e.m., **p<0.01, *p <0.05 by two-tailed Mann-Whitney test, n=22 control, 19 fHTK. e. Pie charts depicting the percentages of control and fHTK mice that were paralyzed at day 24 and day 30 post EAE induction. f. Spinal cords from control and fHTK mice were stained for OLIG2 (green), CD11b (red) and DAPI (blue) with the area of the CD11b+ lesion traced with a dotted white line. g. The number of OLIG2+ cells per CD11b+ lesion was quantified comparing the fHTK and control mice, ± s.e.m., n = 21 control, 19 fHTK, *p = 0.038 by Student’s one-tailed t-test. h. Spinal cord sections from fHTK mice and controls at 30 days post EAE induction were stained for FluoroMyelin (red) and DAPI (blue) with the area of the CD11b+ lesion traced with a dotted white line. i. Quantification of the percentage of the total white matter area that is FluoroMyelin positive, ± s.e.m., n = 21 control, 19 fHTK, p = 0.96 by Student’s two-tailed t-test. j. Electron microscopy images of spinal cord sections from healthy wild type mice, and fHTK mice and control mice both at 30 days post EAE induction. k. Quantification of the # of myelinated axons from the 3 groups per 3000x picture frame, n = 4 per group, ***p = 0.0002, **p = 0.0012, using a one-way ANOVA with multiple comparisons. Scale bars for immunofluorescence images = 100 µm, scale bars for EM images = 2 µm.
Figure 5:
Figure 5:. Fibrotic cells upregulate interferon gamma pathway genes in EAE.
a. Heat map of the expression levels of the top 100 differentially expressed genes by FDR in Col1a1-GFP+ cells from EAE 5 days PSO and 10 days PSO (CNS Fibro EAE D5, D10) compared to Col1a1-GFP+ cells from health (CNS Fibro Health). b. mRNA levels in counts per million (CPM) of interferon gamma pathway and target genes from the sequencing of whole spinal cord tissue (Whole SC, n = 2) and CNS Fibro Health, CNS Fibro EAE D5 and CNS Fibro EAE D10 (n = 3 each), ± s.e.m., *FDR < 0.05, **FDR < 0.01 to Whole SC, #FDR < 0.05, ##FDR < 0.01 to CNS Fibro Health. c. Spinal cord sections from Col1a1-GFP mice in health (left) and EAE (right) were stained with CXCL10 (red). d. Violin plots from the single-cell sequencing dataset of Col1a1-GFP+ cells described in Figure 3 depicting the total RNA counts for genes in the interferon gamma pathway. e. UMAP plot of individual cells sequenced from a whole spinal cord of a wild type mouse with EAE 4 days PSO with their assigned cell type identity using SingleR and the Immgen reference dataset. e. Interferon gamma expression is indicated in blue, and is found predominately in T cells in EAE. All scale bars = 100 µm.
Figure 6:
Figure 6:. Interferon gamma signaling regulates scar formation following neuroinflammation.
a. Spinal cord sections from fibrotic cell-specific IFNγ knockout mice (fIFNγ, IFNγfl/fl; Col1a2CreERT) and littermate controls (IFNγfl/fl) stained for Col1 (green), CD11b (red) or CD31 (red), and DAPI (blue). The amount of fibrotic scar covering the lesion was quantified in (b), ± s.e.m., **p = 0.0039 by Student’s two-tailed t-test, n=14 control, 15 fIFNγ. c. EAE score for the fIFNγ mice and controls up to 30 days post EAE induction (± s.e.m., n= 14 control, 15 fIFNγ). d. Quantification of the CD11b+ immune cell area in the control and fIFNγ groups 30 days post EAE immunization, ± s.e.m., p = 0.61 by Student’s two-tailed t-test, n= 14 control, 15 fIFNγ. e. Quantification of the percentage of the total white matter area that is FluoroMyelin positive for the control and fIFNγ groups, ± s.e.m., p = 0.44 by Student’s two-tailed t-test, n= 14 control, 15 fIFNγ. f. Quantification of OLIG2+ cells per CD11b+ lesion area between the control and fIFNγ groups, ± s.e.m., p = 0.76 by Student’s two-tailed t-test, n= 14 control, 15 fIFNγ.

Comment in

References

    1. Bataller R & Brenner DA Liver fibrosis. The Journal of clinical investigation 115, 209–218, doi:10.1172/JCI24282 (2005). - DOI - PMC - PubMed
    1. Lee SB & Kalluri R Mechanistic connection between inflammation and fibrosis. Kidney international. Supplement, S22–26, doi:10.1038/ki.2010.418 (2010). - DOI - PMC - PubMed
    1. Travers JG, Kamal FA, Robbins J, Yutzey KE & Blaxall BC Cardiac Fibrosis: The Fibroblast Awakens. Circulation research 118, 1021–1040, doi:10.1161/CIRCRESAHA.115.306565 (2016). - DOI - PMC - PubMed
    1. Lederer DJ & Martinez FJ Idiopathic Pulmonary Fibrosis. New England Journal of Medicine 378, 1811–1823, doi:10.1056/NEJMra1705751 (2018). - DOI - PubMed
    1. Mack M Inflammation and fibrosis. Matrix Biology 68–69, 106–121, doi:10.1016/J.MATBIO.2017.11.010 (2018). - DOI - PubMed

Method only References

    1. Wendling O, Bornert JM, Chambon P & Metzger D Efcient temporally controlled targeted mutagenesis in smooth muscle cells of the adult mouse. Genesis 47, 14–18 (2009). - PubMed
    1. Niu J et al. Aberrant oligodendroglial-vascular interactions disrupt the blood–brain barrier, triggering CNS infammation. Nat. Neurosci 22, 709–718 (2019). - PMC - PubMed
    1. Stuart T et al. Comprehensive integration of single-cell data. Cell 177, 1888–1902 (2019). - PMC - PubMed
    1. Hafemeister C & Satija R Normalization and variance stabilization of single-cell RNA-seq data using regularized negative binomial regression. Genome Biol 20, 296 (2019). - PMC - PubMed
    1. Heng TSP et al. Te Immunological Genome Project: networks of gene expression in immune cells. Nat. Immunol 9, 1091–1094 (2008). - PubMed

Publication types