. 2021 Feb;53(2):215-229.
doi: 10.1038/s41588-020-00770-2. Epub 2021 Feb 1.

Metabolic control of DNA methylation in naive pluripotent cells

Affiliations

Metabolic control of DNA methylation in naive pluripotent cells

Riccardo M Betto et al. Nat Genet. 2021 Feb.

Abstract

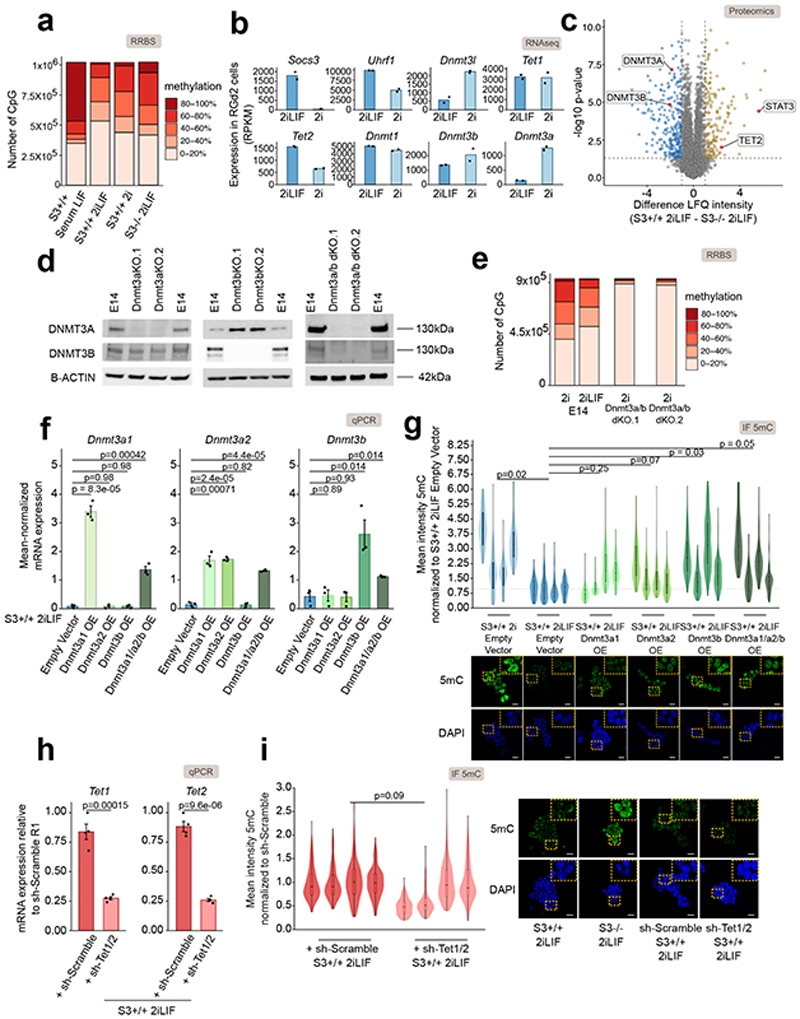
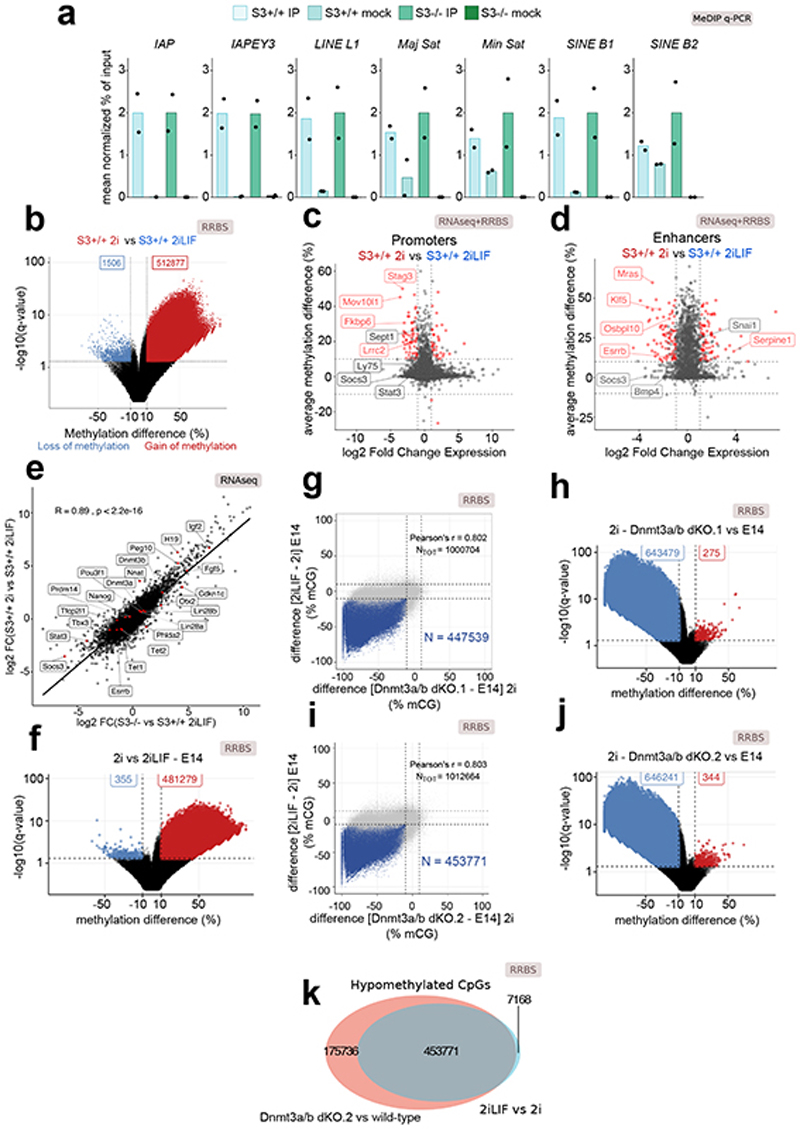
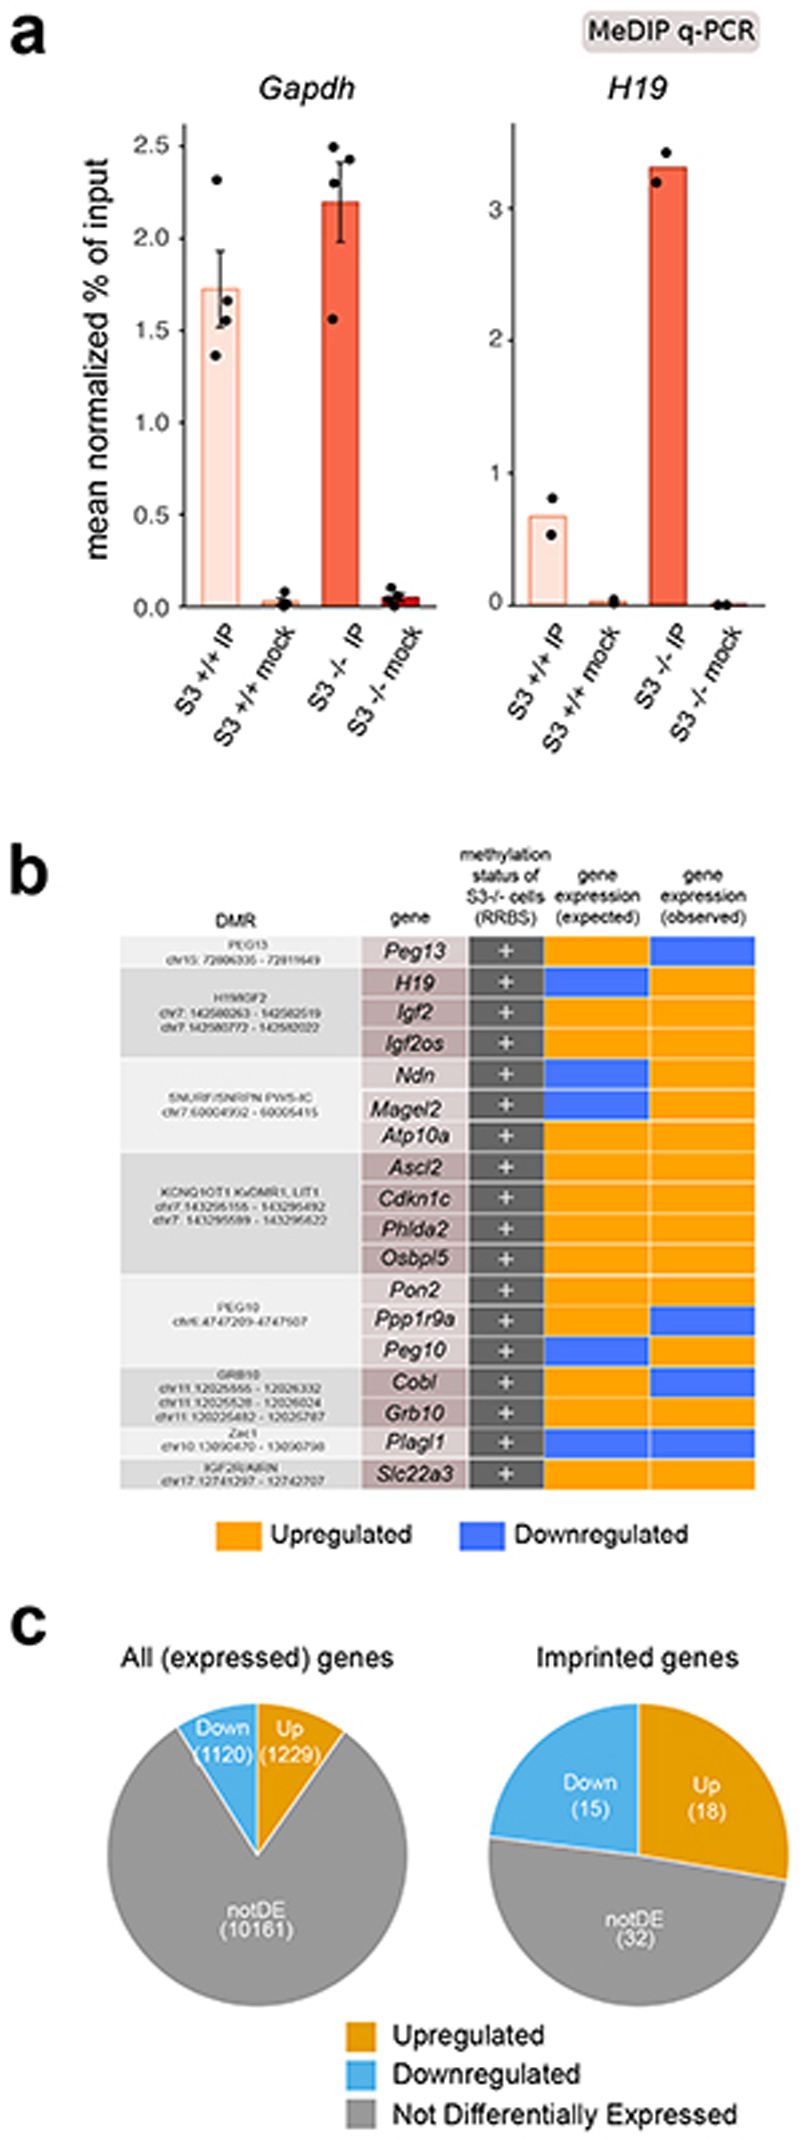
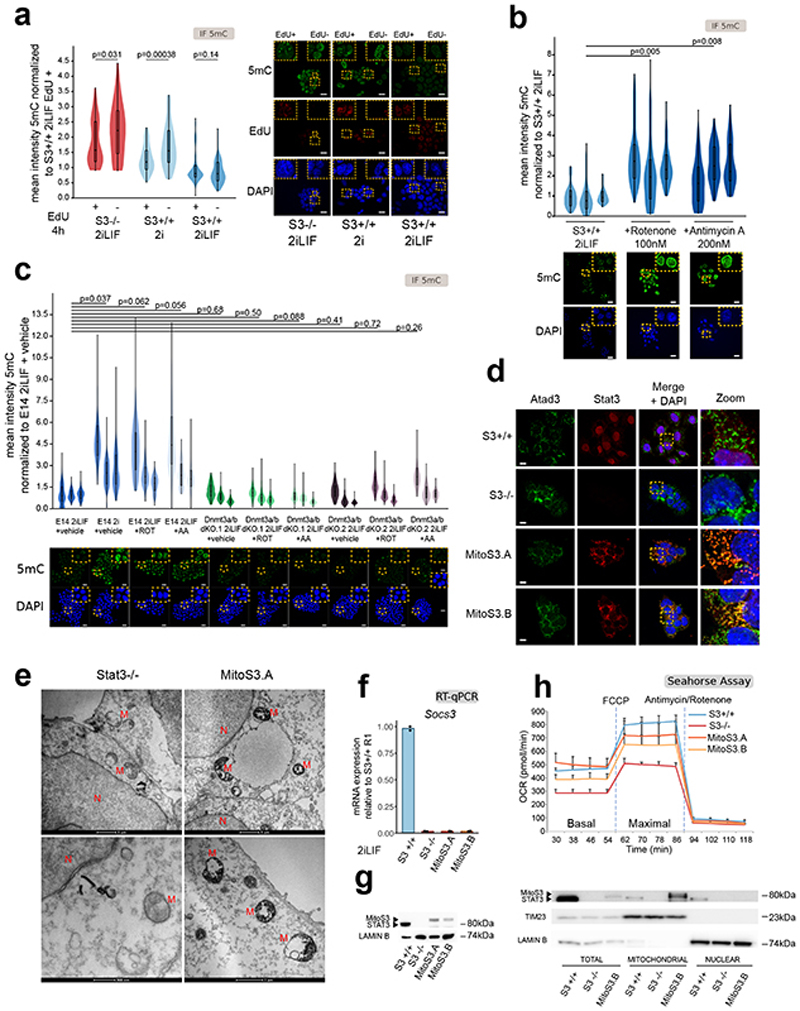
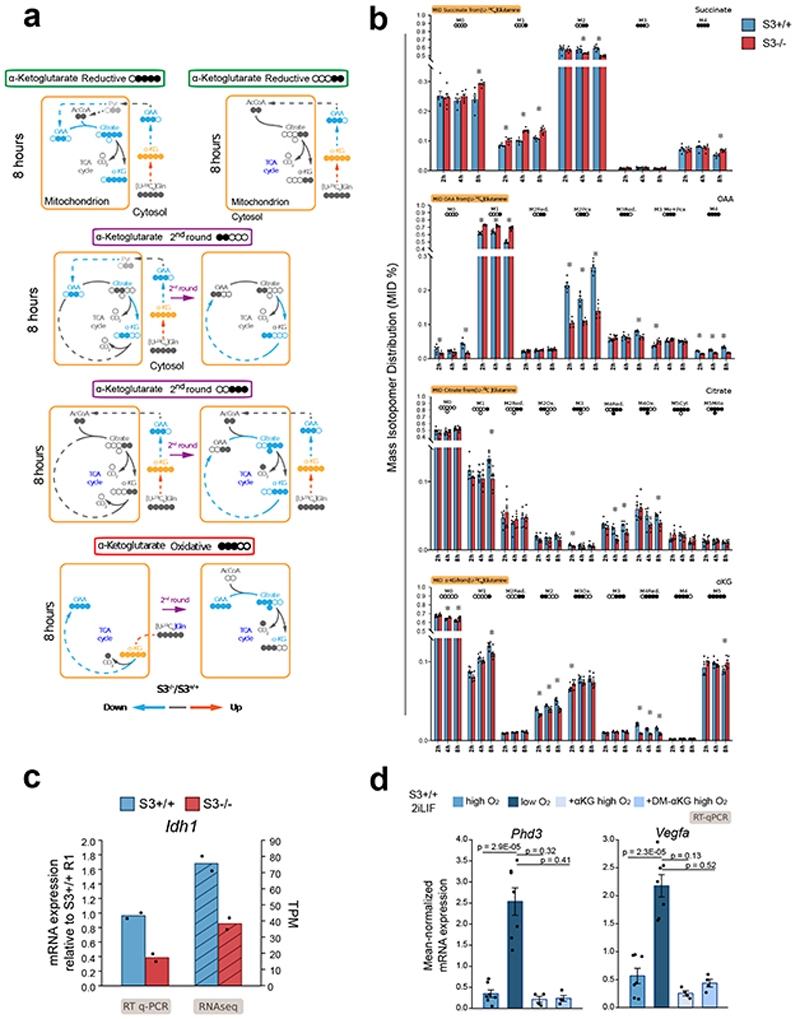
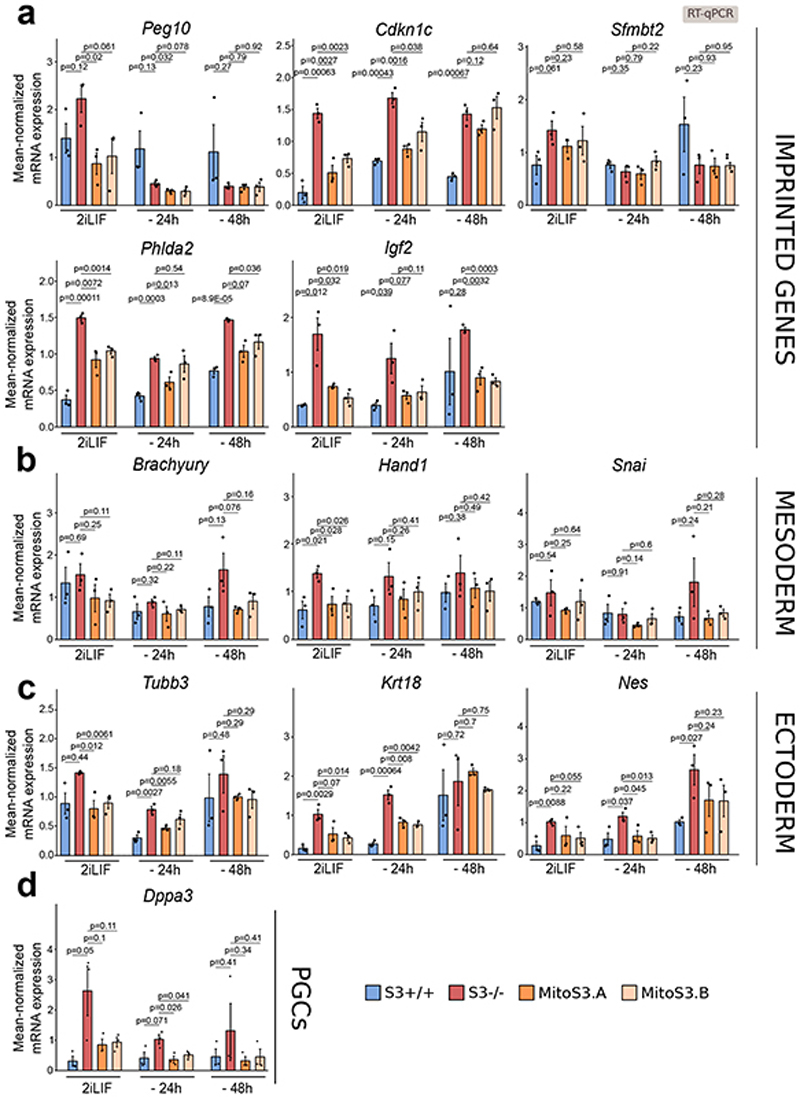
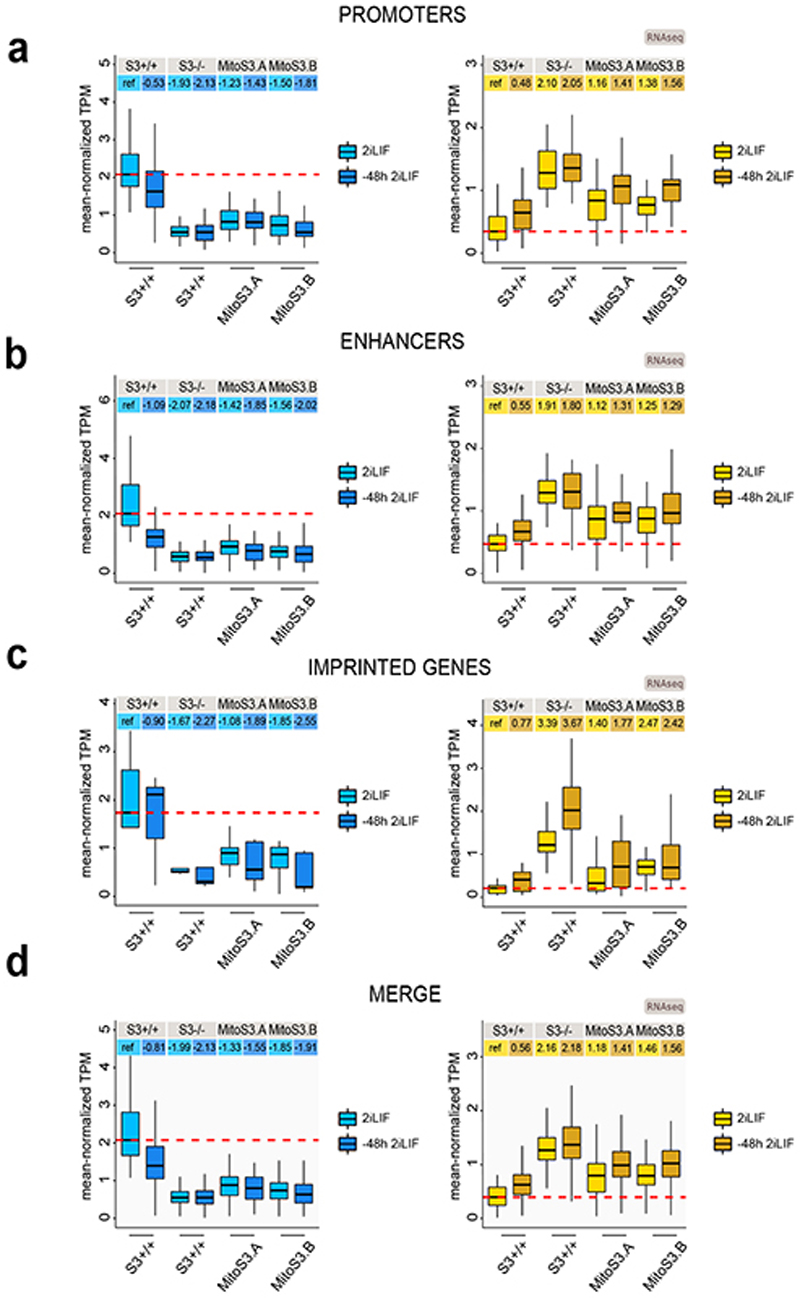
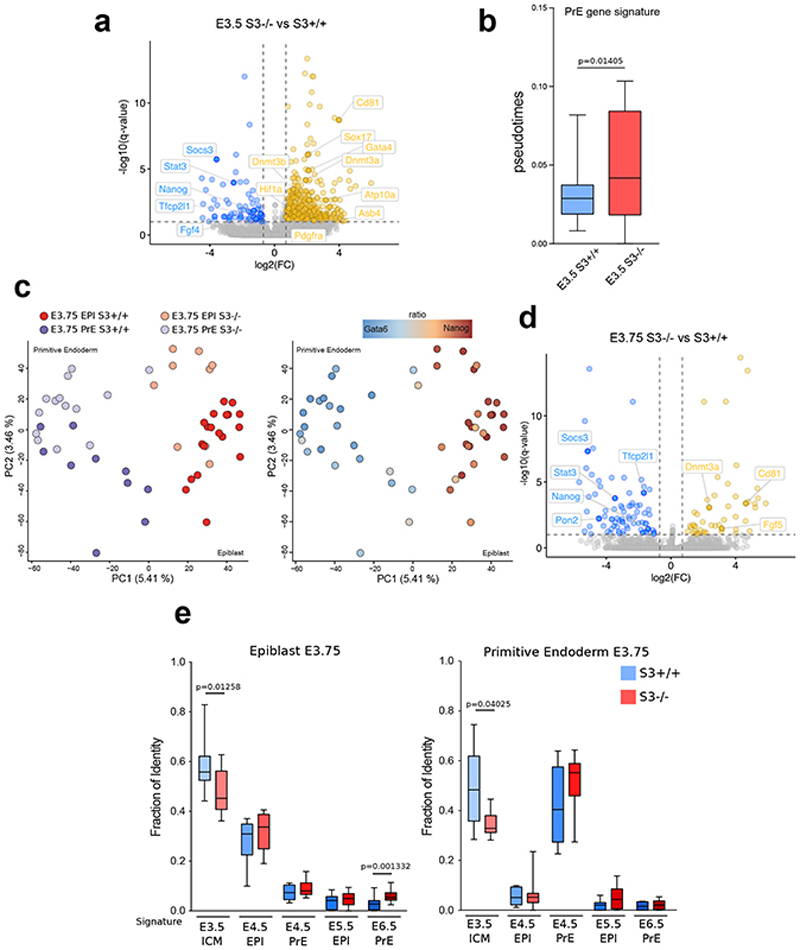
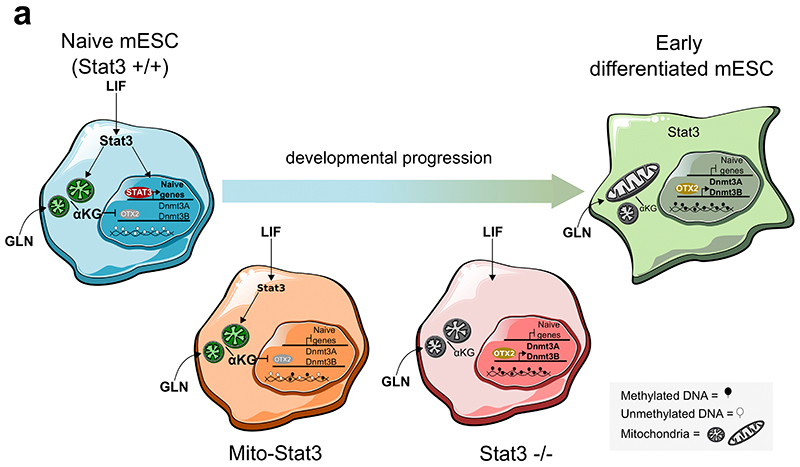
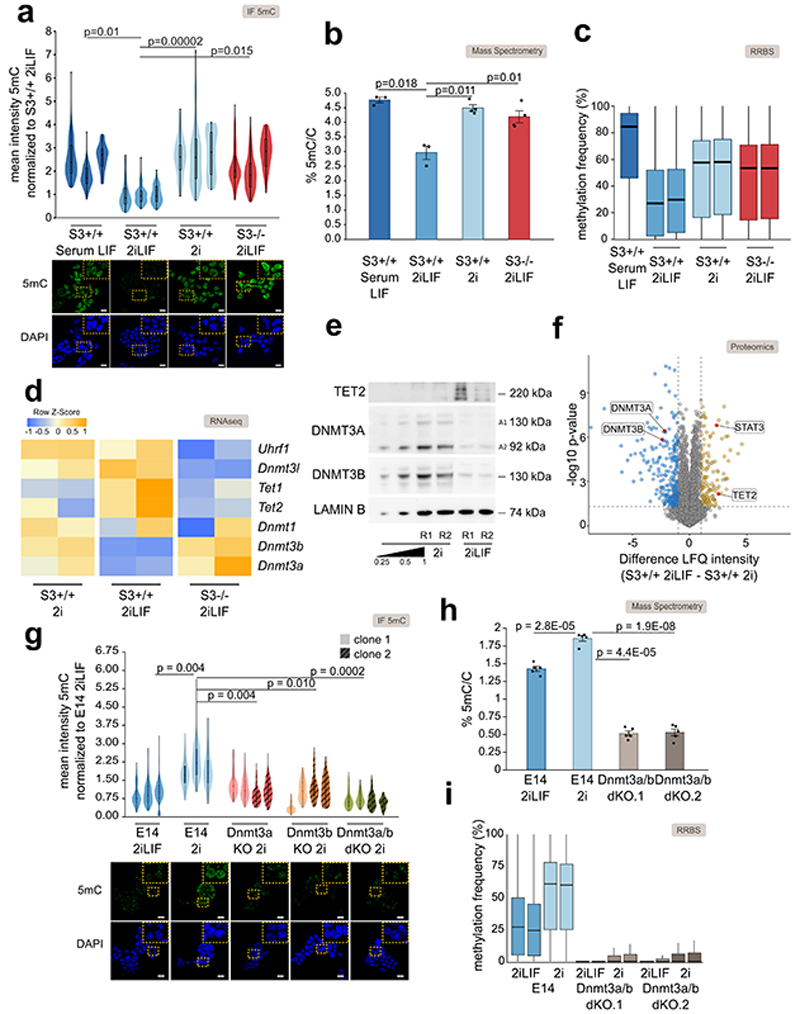
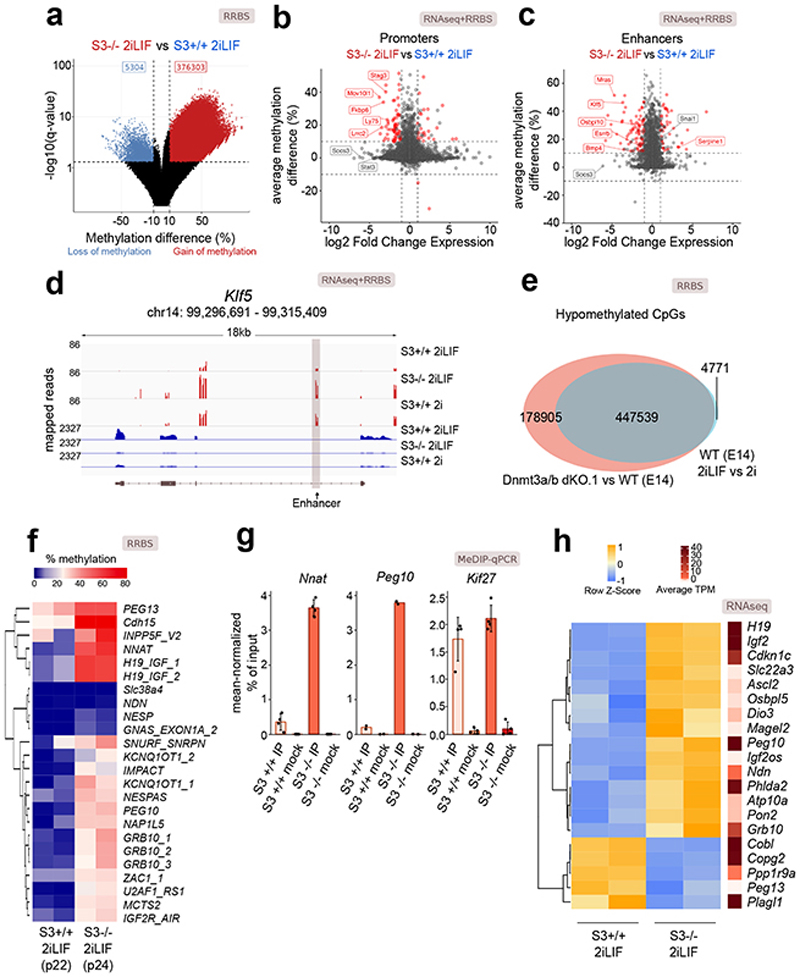
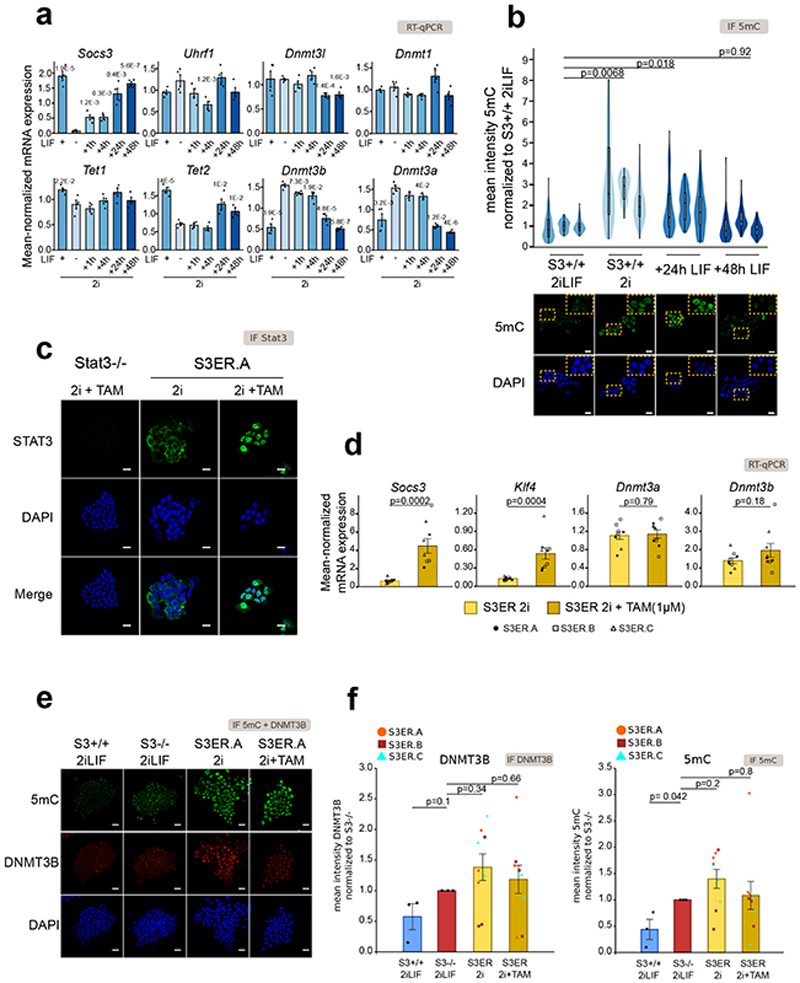
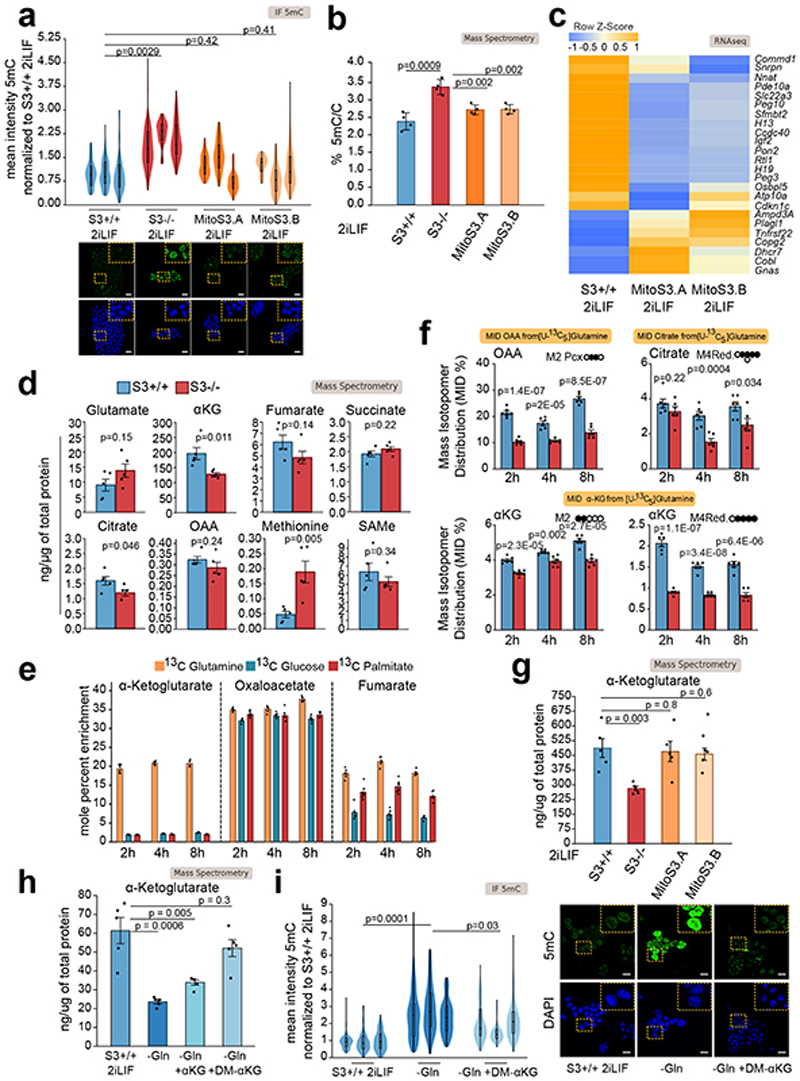
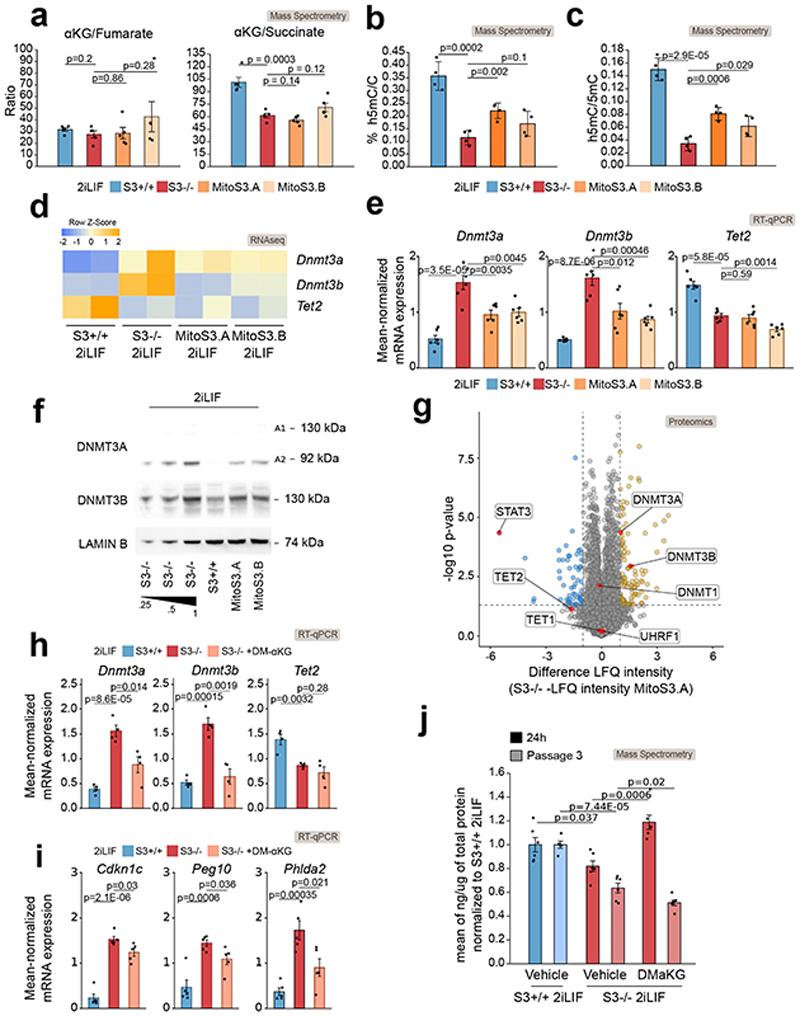
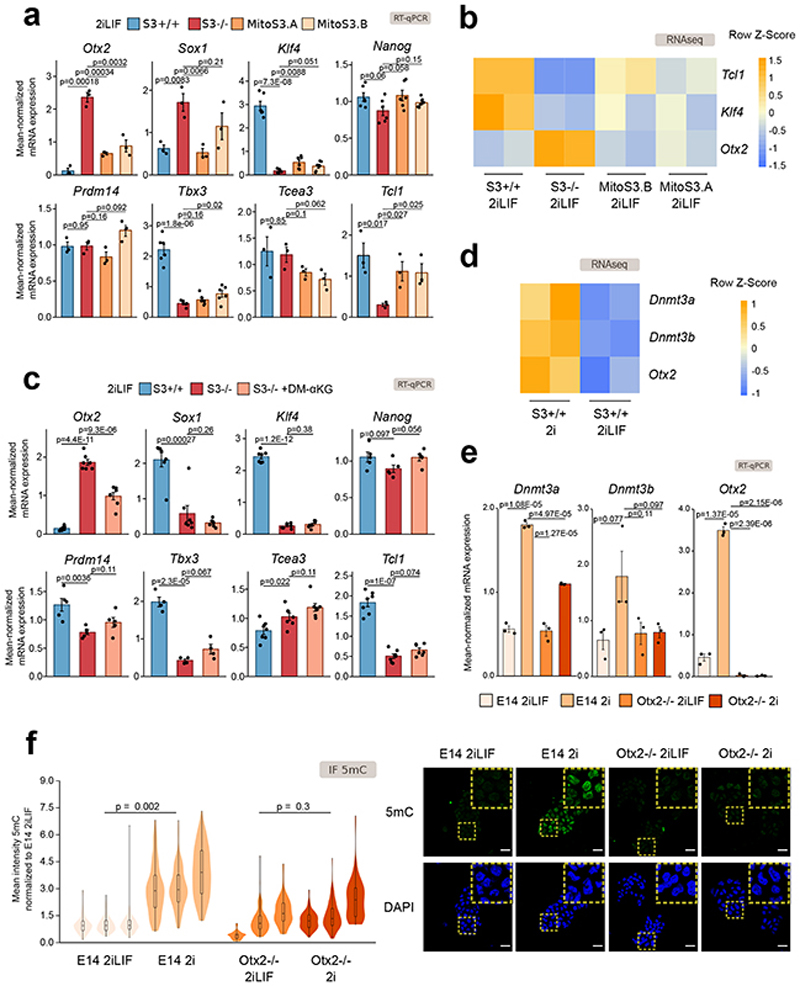
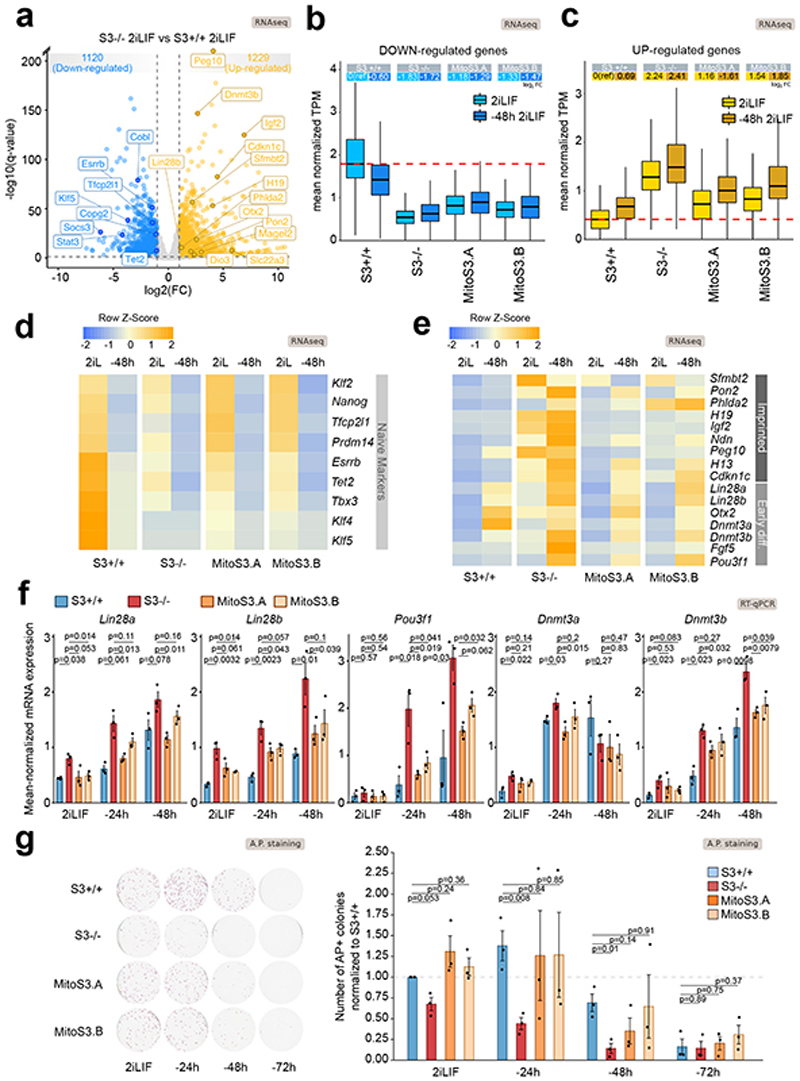
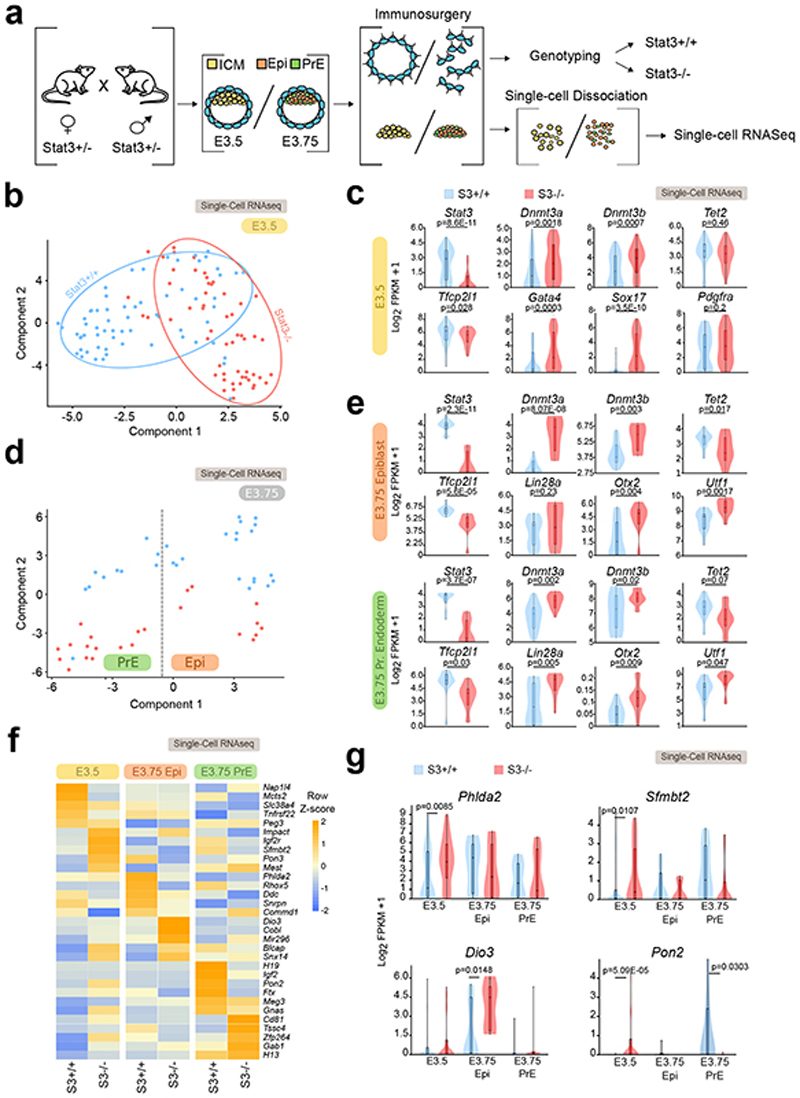
Naive epiblast and embryonic stem cells (ESCs) give rise to all cells of adults. Such developmental plasticity is associated with genome hypomethylation. Here, we show that LIF-Stat3 signaling induces genomic hypomethylation via metabolic reconfiguration. Stat3-/- ESCs show decreased α-ketoglutarate production from glutamine, leading to increased Dnmt3a and Dnmt3b expression and DNA methylation. Notably, genome methylation is dynamically controlled through modulation of α-ketoglutarate availability or Stat3 activation in mitochondria. Alpha-ketoglutarate links metabolism to the epigenome by reducing the expression of Otx2 and its targets Dnmt3a and Dnmt3b. Genetic inactivation of Otx2 or Dnmt3a and Dnmt3b results in genomic hypomethylation even in the absence of active LIF-Stat3. Stat3-/- ESCs show increased methylation at imprinting control regions and altered expression of cognate transcripts. Single-cell analyses of Stat3-/- embryos confirmed the dysregulated expression of Otx2, Dnmt3a and Dnmt3b as well as imprinted genes. Several cancers display Stat3 overactivation and abnormal DNA methylation; therefore, the molecular module that we describe might be exploited under pathological conditions.


Conflict of interest statement

Competing interests statement

The authors declare no competing interests.

Figures

Extended Data Fig. 1
Extended Data Fig. 1. Dnmt3a/b controls 5mC levels downstream of LIF/Stat3
a, Distribution of DNA methylation levels at CpG islands in S3+/+ cells cultured in Serum LIF, 2i or 2iLIF and S3-/- cells in 2iLIF. b, Gene expression analysis in RGd2 cells in 2i with or without LIF. Socs3 was used as a control of LIF/Stat3 activation. Bars: mean of n=2 biological replicates. c, Proteomics data from S3+/+ and S3-/- cells in 2iLIF. Yellow and blue dots indicate respectively proteins that are more or less abundant (difference > 1 or < -1, p-value < 0.05) in S3+/+ relative to S3-/-. n=5 biological replicates. d, Western blot of E14 mES cells and of Dnmt3a KO, Dnmt3b KO, and Dnmt3a/b double KO cells (two clones for each mutant genotype) in Serum LIF. Two E14 samples are loaded on the right and left for each KO cell line. B-ACTIN used as a loading control. Representative images of n=2 independent experiments. e, Distribution of DNA methylation levels at CpG islands in E14 mES cells in 2i or 2iLIF and two clones of Dnmt3a/b double KO mES cells in 2i. f, Gene expression analysis of S3+/+ cells cultured in 2iLIF transiently expressing an Empty Vector, Dnmt3a (two isoforms, Dnmt3a1 and Dnmt3a2 – as previously identified in), Dnmt3b, or the three genes simultaneously (Dnmt3a1/a2/b OE). Bars: mean ± s.e.m. of n=3 independent experiments, shown as dots. g, Anti-5mC immunofluorescence on S3+/+ in 2i and 2iLIF, and Dnmt3a1 OE, Dnmt3a2 OE, Dnmt3b OE, and Dnmt3a1/a2/b triple OE cells in 2iLIF. Violin plots of an average of 89 nuclei per sample. n=4 experiments. h, Gene expression analysis of S3+/+ cells in 2iLIF stably expressing shRNA to knock-down Tet1 and Tet2 simultaneously or a scrambled control shRNA. Bars: mean ±s.e.m. of n=4 experiments. i, Anti-5mC immunofluorescence on S3+/+ in 2iLIF transiently expressing a scrambled control shRNA and shRNA against Tet1/Tet2. Violin plots of an average of 78 nuclei per sample. n=4 experiments. All violin and boxplots indicate the 1st, 2nd and 3rd quartiles, with whiskers indicating minimum and maximum value. All p-values calculated by two-tailed unpaired T-test. Scale bars: 20μm.
Extended Data Fig. 2
Extended Data Fig. 2. Impact of LIF/Stat3 and Dnmt3a/b on genome methylation
a, MeDIP-qPCR of repetitive elements in S3+/+ and S3-/- cells. Mock immunoprecipitations with a non-specific IgG antibody served as negative controls. Mean of 2 experiments, shown as dots. b, Volcano plot showing the significant differentially methylated CpG sites (q-value < 0.01, difference > 10% or < 10%) between S3+/+ 2i and S3+/+ 2iLIF cells, out of 1,327,475 detected sites. c, d Scatter plot showing the mutual changes in expression and DNA methylation at active promoters (c) and enhancers (d) between S3+/+ 2i and S3+/+ 2iLIF cells. Red dots: genes for which both changes were statistically significant (q-value < 0.01). e, Scatter plot comparing effects on transcription of the absence of LIF (S3+/+ 2i) and the absence of Stat3 (S3-/- 2iLIF). Pearson’s correlation coefficient (R) and corresponding p-value are indicated in the panel. f, Volcano plot showing the significant differentially methylated CpG sites (q-value < 0.01, difference > 10% or < -10%) between E14 2i and E14 2iLIF cells, out of 1,084,350 detected sites. g, CpG methylation changes caused by LIF addition (y axis) or by Dnmt3a/b deletion (x axis, Dnmt3a/b dKO.1). Dots indicate all CpG sites covered (sequencing depth >10x) in at least one technical replicate of each sample; blue dots: hypomethylated sites (q-value < 0.01, difference < -10 %). h, Volcano plot showing the significant differentially methylated CpG sites between Dnmt3a/b dKO.1 and E14 cells cultivated in 2i. i, CpG methylation changes caused by LIF (y axis) or by Dnmt3a/b deletion (x axis, Dnmt3a/b dKO.2), as described in panel g. j, Volcano plot showing the significant differentially methylated CpG sites between Dnmt3a/b dKO.2 and E14 cells cultivated in 2i. k, Venn diagram of CpG sites whose methylation status is dependent on either LIF (light blue) or Dnmt3a/b (red) or on both (grey intersection), for an independent mutant Dnmt3a/b dKO clone (Dnmt3a/b dKO.2).
Extended Data Fig. 3
Extended Data Fig. 3. Effect of Stat3 inactivation on imprinted transcripts
a, MeDIP-qPCR of two control regions for DNA methylation change (Gapdh as negative and H19 as positive control). Mock immunoprecipitations with a non-specific IgG antibody served as negative controls. Mean ±s..e.m of 4 experiments for Gapdh and mean of 2 experiments for H19, shown as dots. b, Differentially Methylated Regions and associated imprinted genes. Table reports Differentially Methylated Regions (DMRs) analyzed by RRBS with associated coordinates (reference genome: mm10); information about these DMRs in mouse genome was collected from three different databases (WAMIDEX https://atlas.genetics.kcl.ac.uk/; MouseBook - Imprinting Locihttps://www.mousebook.org/; Geneimprint http://geneimprint.com/site/genes-by-species. Imprinted genes whose expression is controlled by the same DMR are grouped accordingly and indicated in the second column of the table. For each imprinted gene, fourth column reports the expected effect on gene expression - either upregulation or downregulation - caused by methylation deposition at the associated DMR (data from literature). The last column of the table shows observed expression levels (RNAseq data) of each imprinted gene in S3-/- cells, were hypermethylation was detected at the corresponding DMR (see Fig. 2f). c, Pie charts showing the number of up- and down-regulated genes (q-value < 0.01, Benjamini-Hochberg adjustment and log2 FC > 1 or < -1) in S3-/- cells with respect to S3+/+ cells among all expressed genes (left), or among all expressed imprinted genes (right).
Extended Data Fig. 4
Extended Data Fig. 4. Modulating mitochondrial activity affects 5mC levels
a, Anti-5mC immunofluorescence on S3+/+ cells in 2i or 2iLIF and S3-/- cells in 2iLIF treated with EdU for 4 h. Violin plots show the distribution of an average of 67 nuclei per sample; one representative experiment is shown for each condition. b, Anti-5mC immunofluorescence on S3+/+ cells treated with Rotenone or Antimycin A. Violin plots show the distribution of an average of 74 nuclei per sample. 3 independent experiments shown as individual violins. c, Anti-5mC immunofluorescence on E14 in 2iLIF and 2i, and on Dnmt3a/b double KO cells in 2iLIF, treated with Vehicle, Rotenone or Antimycin A. Violin plots show the distribution of an average of 183 nuclei per sample. 3 experiments shown as individual violins. d, Confocal images of S3+/+, S3-/- cells and MitoS3.A/B clones stained with anti-Stat3 and anti-Atad3 antibodies. Representative images of 3 independent experiments. e, Electron Microscopy images of STAT3 protein stained by Diaminobenzidine photooxidation method, in S3-/- and MitoS3.A cells. Representative images of 2 experiments. M, mitochondria; N, nucleus. f, Expression analysis of Socs3 in S3+/+, S3-/- cells and MitoS3.A/B clones in 2iLIF. Bars: mean of n=2 experiments, shown as dots. g, (Left) Western blot of S3+/+, S3-/- cells and MitoS3.A and MitoS3.B clones in 2iLIF. LAMIN B: loading control. (Right) Western blot of total lysates or mitochondrial and nuclear fractions. The nuclear protein LAMIN B and mitochondrial marker TIM23 confirmed successful nuclear and mitochondrial isolation. Representative images of 2 independent experiment. h, Oxygen consumption rate measured by Seahorse extracellular flux assay of S3+/+, S3-/- and MitoS3.A/B clones cultured in 2iLIF. Mean and S.D. of n=5 biological replicates is shown. All violin and boxplots indicate the 1st, 2nd and 3rd quartiles, with whiskers indicating minimum and maximum value. All p-values calculated by two-tailed unpaired T-test. Scale bars: 20μm.
Extended Data Fig. 5
Extended Data Fig. 5. Metabolic reconfiguration following Stat3 deletion
a, Diagram representing mass isotopomer distribution (MID) of OAA, Citrate and αKG in both oxidative and reductive Glutamine pathways; MID was analysed following 8h of metabolic tracing with [U-13C5]-Glutamine. Orange box: mitochondrion. Full circles: 13C-labeled carbons. Color scale outlines the comparison between MID profile in S3-/- relative to S3+/+ for n=6 biological replicates; blue: isotopomers (or biochemical pathways) under-represented is S3-/- cells; red: isotopomers or pathways over-represented in S3-/- cells. Each isotopomer is corrected for natural isotope abundances. b, Metabolic tracing analysis of different isotopomers of TCA cycle intermediates (Succinate, Oxaloacetate, Citrate and αKG) using [U-13C5]-Glutamine. Barplot represents mass isotopomer distribution (MID %) at 3 different time points (2h, 4h, 8h). Black circles: 13C‐labeled carbons. Bars: mean ±s.e.m of n=6 biological replicates. * p-value<0.05, two-tailed unpaired T-test. Each isotopomer is corrected for natural isotope abundances. c, Expression of IDH1, measured by RT q-PCR and RNAseq in S3+/+ and S3-/- cells. Bars: mean of n=2 biological replicates. d, Gene expression analysis of two Hif1a targets in S3+/+ cells cultured in 2iLIF in normoxia (high O2 – 21%), in hypoxia (low O2, 21%), or in normoxia with the addition of αKG or DM-αKG. Bars: indicate mean ±s.e.m. of n=7 experiments for high O2 and low O2, and n=4 for treatments with αKG and DM-αKG, shown as dots.
Extended Data Fig. 6
Extended Data Fig. 6. Mitochondrial Stat3 slows down ESC differentiation
Gene expression analysis by RT–qPCR of S3+/+, S3-/- and MitoS3.A/B clones cultured with 2iLIF or without 2iLIF for 24h or 48h. Data show expression of Imprinted genes a, Mesoderm b, Ectoderm c, and PGCs d, markers that are more readily induced in S3-/- and MitoS3.A/B clones rescues this effect. Beta-actin served as an internal control. Bars indicate mean ±s.e.m. of n=3 independent experiments, shown as dots. Two-tailed unpaired T-test relative to S3-/- for each time point.
Extended Data Fig. 7
Extended Data Fig. 7. Stat3 regulates transcripts associated to differentially methylated genomic features.
a, Left: boxplot reporting expression levels of genes down-regulated in S3-/- cells relative to S3+/+ cells (Fig. 7a, blue dots) and differentially methylated at promoter regions (Fig. 2b). Right: boxplot reporting expression levels of genes up-regulated in S3-/- cells with respect to S3+/+ cells (Fig. 7a, yellow dots) and with differential methylation at promoter regions (Fig. 2b). Each boxplot shows 1st, 2nd and 3rd quartile. Whiskers shows minimum and maximum values. Y axis represents mean-normalized TPM values for S3+/+, S3-/- and MitoS3.A and MitoS3.B) in two different conditions: following stable culturing of cells in 2iLIF (light color) and after 48h of 2iLIF withdrawal from culture medium (dark color). b, Boxplot reporting expression levels of genes down-regulated (left) or up-regulated (right) in S3-/- cells relative to S3+/+ cells and differentially methylated at enhancer regions (Fig. 2c), as described above. c, Boxplot reporting expression levels of genes down-regulated (left) or up-regulated (right) in S3-/- cells relative to S3+/+ cells and differentially methylated at the associated DMR (Fig. 2f), as described above. d, Merge of genes contained in boxplots shown in Extended Data Fig. 7a,b,c.
Extended Data Fig. 8
Extended Data Fig. 8. Accelerated progression of Stat3 null embryos
a, Volcano plot of genes differentially expressed between S3-/- and S3+/+ cells at E3.5. Red and blue dots indicate respectively transcripts that are upregulated or downregulated (log2 FC > 0.7 or FC < -0.7 respectively, q-value < 0.1) in S3-/- cells relative to S3+/+ cells. b, Diffusion pseudotime of E3.5 cells and the PrE gene signature computed with R package “destiny “ (http://bioinformatics.oxfordjournals.org/content/32/8/1241) using all the expressed genes as input list. P-value calculated with two-tailed Mann-Whitney test. c, PCA plot computed with all the expressed genes. Colors represent different lineages/genotypes (left panel) or ratio between Gata6 and Nanog expression (right panel). d, Volcano plot of genes differentially expressed between S3-/- and S3+/+ cells at E3.75. Red and blue dots indicate respectively transcripts that are upregulated or downregulated (log2 FC > 0.7 or FC < - 0.7 respectively, q-value < 0.1) in S3-/- cells relative to S3+/+ cells. e, Fraction of identity between E3.75 EPI(left panel)/PrE(right panel) and E3.5 ICM, E4.5 EPI, E4.5 PrE, E5.5 EPI and E6.5 EPI stages computed with all the expressed genes. P-value calculated with two-tailed Mann-Whitney test. All boxplot shows 1st, 2nd and 3rd quartile. Whiskers show minimum and maximum values.
Extended Data Fig. 9
Extended Data Fig. 9. Diagram summarizing how mitochondrial Stat3 affects nuclear transcription.
Fig. 1
Fig. 1. LIF/Stat3 induces hypomethylation in ESCs via Dnmt3a/b regulation
a, Anti-5mC immunofluorescence on S3+/+ cells in Serum LIF, 2i or 2iLIF and S3-/- cells in 2iLIF. Representative images and violin plots showing the distribution of fluorescence intensity of an average of 63 nuclei per sample. n = 3 experiments shown as individual violins. Two-tailed unpaired t-test was performed on median intensity values of each sample. b, Percentage of 5mC quantified by mass spectrometry. Mean and s.e.m. of n = 3 for S3+/+ Serum LIF and 2iLIF and n = 4 for S3+/+ 2i and 2iLIF biological replicates shown as dots. c, DNA methylation at CpG islands measured by RRBS. d, Heatmap of transcriptomic data; n= 2 biological replicates. Z-score of scaled expression values. e, Western blot of S3+/+ cells in 2i or 2iLIF. Two biological replicates (R1/2). Two isoforms of Dnmt3a were detected. Lamin B: loading control. Representative images of n = 2 independent experiment. f, Proteomic data from S3+/+ cells in 2iLIF or 2i. Yellow and blue dots indicate proteins that are less or more abundant (difference > 1 or < -1, P value < 0.05) in 2iLIF relative to 2i. n = 5 biological replicates. See Supplementary Table 3. g, Anti-5mC immunofluorescence of E14 cells in 2iLIF and 2i, and Dnmt3a KO, Dnmt3b KO, and Dnmt3a/b dKO in 2i. Violin plots of an average of 82 nuclei per sample. Independent experiments shown as violins. h, Percentage of 5mC of E14 cells cultured in 2iLIF and 2i, and two Dnmt3a/b dKO clones. Mean and s.e.m. of 5 biological replicates shown as dots. i, RRBS on the indicated samples. n = 2 biological replicates. All violin and boxplots indicate the 1st, 2nd and 3rd quartiles, with whiskers indicating minimum and maximum value. All P values calculated by two-tailed unpaired t-test. Scale bars: 20 μm.
Fig. 2
Fig. 2. Impact of Stat3 on DNA methylation and transcription
a, Volcano plot showing the significant differentially methylated CpG sites (q-value < 0.01, difference > 10% or < -10%) between S3-/- and S3+/+ cells. b and c, Scatter plot showing changes in expression and DNA methylation at active promoters (b) or enhancers (c) between S3+/+ and S3-/- cells. Red dots: genes for which both changes were statistically significant (q-value < 0.01). See Supplementary Table 2. d, Gene tracks showing RRBS and RNA-seq data for S3+/+ 2iLIF, S3+/+ 2i and S3-/- 2iLIF cells over the Klf5 genomic region. One representative biological replicate out of two is shown. e, Venn diagram of CpG sites whose methylation status is dependent on either LIF (light blue) or on Dnmt3a/b (red) or on both (gray intersection). f, Percentage of DNA methylation at imprinted DMRs. n = 2 biological replicates for each sample. See Supplementary Table 2. g, MeDIP-qPCR of DMRs and a control region (Kif27). Mock immunoprecipitations with a non-specific IgG antibody served as negative controls. Mean ±S.D. of n = 4 (Nnat, Kif27) or mean of n = 2 (Peg10) experiments, shown as dots. h, Heatmap showing relative and absolute expression of imprinted genes associated to known DMRs (Fig. 2f) and differentially expressed between S3-/- and S3+/+ cells. Relative expression shown as z-scores of scaled values; absolute expression indicated on the right as average transcripts per million (TPM) values. n = 2 biological replicates for each sample. All P values calculated by two-tailed unpaired t-test.
Fig. 3
Fig. 3. Nuclear Stat3 does not regulate Dnmt3a/b and 5mC
a, Gene expression analysis of S3+/+ cells stably cultured in 2iLIF, in 2i or acutely stimulated with LIF or for 1 h, 4 h, 24 h or 48 h. Bars: mean ±s.e.m. of 4 experiments, shown as dots. P values relative to 2i are shown only when <0.05. b, Anti-5mC immunofluorescence of S3+/+ cells cultured stably in 2iLIF or in 2i, and after LIF addition for 24 or 48 hours. Violin plots show the distribution of fluorescence intensity of an average of 86 nuclei per sample. Boxplots show 1st, 2nd and 3rd quartile. Whiskers indicate minimum and maximum values. n = 3 experiments. P values calculated on median values. c, Anti-Stat3 immunofluorescence of S3-/- cells in 2i+TAM and one representative clone of S3ER cells in 2i or 2i+TAM. Representatives images of n = 3 independent experiments. d, Gene expression analysis of three S3ER clones grown in 2i with or without Tamoxifen. Bars: mean ±s.e.m. of 3 experiments, shown as dots, squares or triangles. e, Representative confocal images of n = 3 independent experiments are shown for S3+/+ and S3-/- cells in 2iLIF and one representative clone of S3ER cells cultured either in 2i or 2i+TAM, stained with anti-5mC and anti-Dnmt3b antibodies. f, Quantification of anti-Dnmt3b (left) and anti-5mC (right) immunofluorescence of S3+/+ 2iLIF, S3-/- 2iLIF, and three S3ER clones in 2i with or without Tamoxifen. Bars: mean ±s.e.m. of n = 3 experiments for each S3ER clone, shown as dots, squares or triangles. Scale bars: 20 μm. All P values calculated by two-tailed unpaired t-test.
Fig. 4
Fig. 4. Stat3 controls DNA methylation via metabolic regulation
a, Anti-5mC immunofluorescence on S3+/+, S3-/- cells and MitoS3.A/B clones (see Extended Data Fig. 4d-h). Violin plots of an average of 55 nuclei per sample. n = 3 experiments. b, Percentages of 5mC in the DNA of S3+/+, S3-/- cells and MitoS3.A/B clones in 2iLIF. Bars: mean ±S.D. of n = 4 biological replicates, shown as dots. c, Imprinted transcripts differentially expressed (q-value < 0.1) between S3-/- cells and both MitoS3.A/B clones. Mean of 2 biological replicates were scaled and represented as z-score. d, Quantification of metabolite abundance by LC-MS/MS; bars: mean ±s.e.m. of n = 5 biological replicates, shown as dots. e, Metabolic tracing analysis of αKG, oxaloacetate (OAA) and fumarate. Barplots represent the percentage of marked carbon after provision of 13C glucose, glutamine or palmitate for 2 h, 4 h and 8 h. Bars: mean ±s.e.m. of 6 biological replicates. f, Metabolic tracing analysis of OAA, citrate and αKG. Barplots show the percentage of labeled isotopomer 2 h, 4 h and 8 h after exposure to [U-13C5]-glutamine. Black circles 13C5-labeled carbons. Bars: mean ±s.e.m. of 6 biological replicates. g-h, Quantification of αKG abundance measured by mass spectrometry; bars: mean ±s.e.m. of 5 biological replicates, shown as dots. In h S3+/+ cells cultured in 2iLIF with glutamine, without glutamine or without glutamine and supplemented with 2 mM αKG or 2 mM DM-αKG 2 mM for 9 days. i, Anti-5mC immunofluorescence of S3+/+ cells cultured with glutamine, without glutamine or without glutamine and supplemented with 2 mM DM-αKG for 9 days. Violin plots of fluorescence intensity of an average of 96 nuclei per sample. n = 3 experiments. All violin and boxplots indicate the 1st, 2nd and 3rd quartiles, with whiskers indicating minimum and maximum value. All P values calculated by two-tailed unpaired t-test. Scale bars: 20 μm.
Fig. 5
Fig. 5. Alpha-ketoglutarate regulates 5mC mainly via control of Dnmt3a/b levels
a-g, S3+/+, S3-/- cells and two MitoS3.A/B clones, cultured in 2iLIF, were analyzed. a, αKG/fumarate and αKG/succinate ratios measured by mass spectrometry. Bars: mean ±s.e.m. of 5 biological replicates, shown as dots. b, Percentages of h5mC. Bars: mean ±s.e.m. of 4 biological replicates, shown as dots. c, h5mC/5mC ratio. Bars: mean ±s.e.m. of 5 biological replicates, shown as dots. d-e, Expression analysis of enzymes controlling DNA methylation by RNA-seq (d) and qPCR (e). d, Heatmap shows z-scores from scaled RNA-seq expression values. n= 2 biological replicates. e, Bars: mean ±s.e.m. of n = 6 experiments, shown as dots. f, Western blot for Dnmt3a, Dnmt3b and Lamin B, used as a loading control. Representative images of n = 2 independent experiments. g, Proteomic analysis. Yellow and blue dots indicate proteins that are more or less abundant (difference > 1 or < -1 respectively, P value < 0.05) in S3-/- relative to MitoS3.A cells. n = 5 biological replicates. Source data in Supplementary Table 3. h-i, Gene expression analysis of epigenetic modifiers (h) and imprinted genes (i) in S3+/+, S3-/- and S3-/- cells cultured in 2iLIF and treated with 2 mM DM-αKG for 4 passages. Bars: mean ±s.e.m. of n = 4 experiments, shown as dots. j, Quantification of intracellular αKG abundance in S3+/+ cells and in S3-/- cells treated with vehicle or 2 mM DM- αKG for 24 h (dark bars) or for 3 passages (light bars). Bars: mean ±s.e.m. of n = 6 biological replicates, shown as dots. All P values calculated using two-tailed unpaired t-test.
Fig. 6
Fig. 6. Otx2 links α KG to Dnmt3a/b expression
a-b, Expression analysis of S3+/+, S3-/-and MitoS3.A/B clones cultured in 2iLIF for potential Dnmt3a/b regulators. a, RT-qPCR. Bars: mean ±s.e.m. of n = 3 for Otx2, Sox1, Prdm14, Tcea3, Tcl1; n = 6 for Klf4, Nanog, Tbx3 experiments, shown as dots. b, Heatmap of RNA-seq data; n = 2 biological replicates. Z-scores of scaled expression values. c, RT–qPCR of S3+/+, S3-/- and S3-/- cells cultured in 2iLIF and treated with 2 mM DM-αKG for 3 passages. Bars: mean ±s.e.m. of n = 7 for Otx2, Sox1, Klf4, Tcea3, Tcl1; n = 5 for Nanog, Prdm14; n = 4 for Tbx3 experiments, shown as dots. d, Heatmap reporting expression of Dnmt3a, Dnmt3b and Otx2 in S3+/+ cultured in 2i with or without LIF; n = 2 biological replicates. Expression levels were scaled and represented as z-score. e, RT–qPCR of E14 and Otx2-/- cells stably cultured in 2iLIF or 2i. Bars: mean ±s.e.m. of n = 3 experiments, shown as dots. f, Anti-5mC immunofluorescence on E14 and Otx2-/- cells stably cultured in 2iLIF or 2i. Representative images and violin plots of fluorescence intensity of an average of 111 nuclei per sample. Boxplots show 1st, 2nd and 3rd quartile; Whiskers indicate minimum and maximum values. n = 3 experiments. All P values calculated using two-tailed unpaired t-test. Scale bar: 20 μm.
Fig. 7
Fig. 7. Mitochondrial Stat3 regulates ESC differentiation.
a, Volcano plot showing differentially expressed genes (log2 FC > 1 or < -1, q-value < 0.01, Benjamini-Hochberg adjustment) between S3+/+ and S3-/- cells. n = 2 biological replicates. b-c, Boxplot reporting expression levels of downregulated (b) or upregulated (c) genes in S3-/- cells relative to S3+/+ cells. Each boxplot shows 1st, 2nd and 3rd quartile. Whiskers show minimum and maximum values. Cells were either analyzed in 2iLIF (light blue) and after 48 h of 2iLIF withdrawal (”-48h“). Upper table shows mean log2 FC relative to S3+/+ 2iLIF. d-e, Heatmap of makers of naive pluripotency, early differentiation and imprinted genes. Expression levels were scaled and represented as z-score. n = 2 biological replicates. f, Gene expression analysis by RT–qPCR of S3+/+ (blue), S3-/- (red) and two MitoS3.A/B (orange) clones cultured in 2iLIF or without 2iLIF for 24 h or 48 h (“-24h “ or “-48h “). Bars: mean ±s.e.m. of n = 3 experiments, shown as dots. P values calculated using two-tailed unpaired t-test relative to S3-/-. See Extended Data Figure 6. g, Alkaline phosphatase (AP) staining in S3+/+, S3-/- and MitoS3.A/B clones cultured with 2iLIF or without 2iLIF for 24 h, 48 h or 72 h. Representative images and quantification of AP-positive colonies, relative to S3+/+ cells in 2iLIF. Mean ±s.e.m. of n = 3 experiments is shown. P values calculated using two-tailed unpaired t-test.
Fig. 8
Fig. 8. Stat3 regulates Dnmts and imprinted transcripts in early mouse blastocysts.
a, Outline of the strategy for isolation and profiling of single pluripotent cells. A total of 171 cells from 18 embryos were analyzed. See Supplementary Table 4. b, t-SNE based on whole transcriptome of wild-type (S3+/+) and mutant (S3-/-) ICM cells collected at E3.5; each dot represents a single cell. c, Violin plots showing the distribution of expression levels for selected markers. d, t-SNE based on genome-wide expression of S3+/+ and S3-/- mouse cells collected at embryonic day E3.75; each dot represents a single cell. e, Violin plots showing the distribution of gene expression levels of the indicated markers. f, Heatmap reporting average expression levels of imprinted transcripts in three different embryonic populations (E3.5 ICM, E3.75 Epi, E3.5 PrE) from S3+/+ and S3-/- embryos. Expression values were scaled and represented as z-score. Only expressed imprinted genes (average FPKM >1) were analyzed. g, Violin plots showing the distribution of expression of imprinted genes. In all violin plots the boxplots show 1st, 2nd and 3rd quartile, while whiskers indicate minimum and maximum values. P values calculated with two-tailed unpaired t-test.

References

    1. Ito S, et al. Role of Tet proteins in 5mC to 5hmC conversion, ES-cell self-renewal and inner cell mass specification. Nature. 2010;466:1129–1133. - PMC - PubMed
    1. Ito S, et al. Tet proteins can convert 5-methylcytosine to 5-formylcytosine and 5-carboxylcytosine. Science. 2011;333:1300–1303. - PMC - PubMed
    1. Messerschmidt DM, Knowles BB, Solter D. DNA methylation dynamics during epigenetic reprogramming in the germline and preimplantation embryos. Genes Dev. 2014;28:812–828. - PMC - PubMed
    1. Monk M, Boubelik M, Lehnert S. Temporal and regional changes in DNA methylation in the embryonic, extraembryonic and germ cell lineages during mouse embryo development. Dev Camb Engl. 1987;99:371–382. - PubMed
    1. Smith ZD, et al. A unique regulatory phase of DNA methylation in the early mammalian embryo. Nature. 2012;484:339–344. - PMC - PubMed

Publication types

MeSH terms