

Virological Characterization of the First 2 COVID-19 Patients Diagnosed in Italy: Phylogenetic Analysis, Virus Shedding Profile From Different Body Sites, and Antibody Response Kinetics
- PMID: 33527081
- PMCID: PMC7499768
- DOI: 10.1093/ofid/ofaa403
Virological Characterization of the First 2 COVID-19 Patients Diagnosed in Italy: Phylogenetic Analysis, Virus Shedding Profile From Different Body Sites, and Antibody Response Kinetics
Abstract
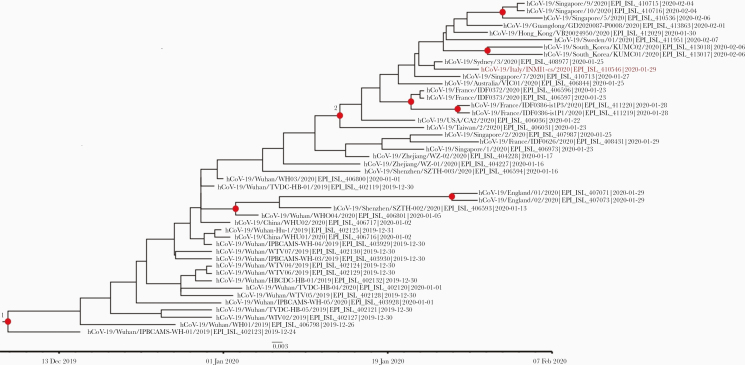
Background: The pathogenesis of severe acute respiratory syndrome coronavirus 2 (SARS-CoV-2) infection remains unclear. We report the detection of viral RNA from different anatomical districts and the antibody profile in the first 2 COVID-19 cases diagnosed in Italy.
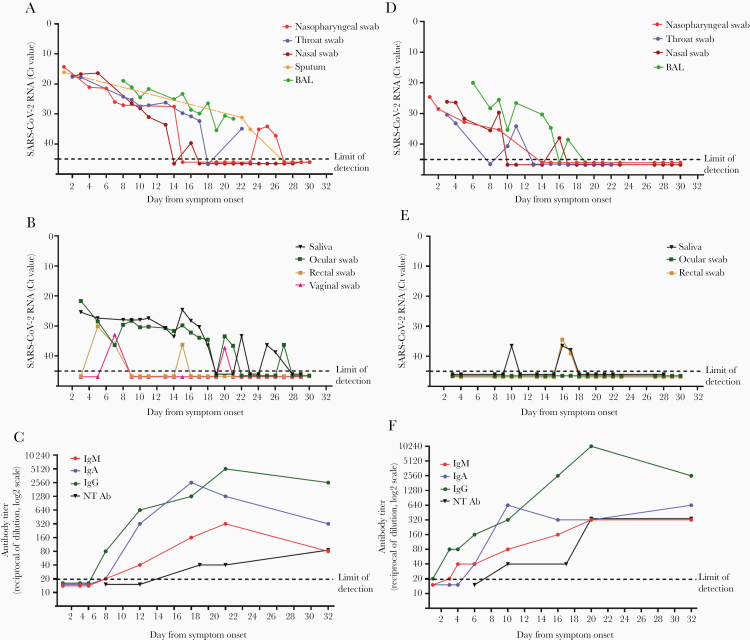
Methods: We tested for SARS-CoV-2 RNA clinical samples, either respiratory and nonrespiratory (ie, saliva, serum, urine, vomit, rectal, ocular, cutaneous, and cervico-vaginal swabs), longitudinally collected from both patients throughout the hospitalization. Serological analysis was carried out on serial serum samples to evaluate IgM, IgA, IgG, and neutralizing antibody levels.
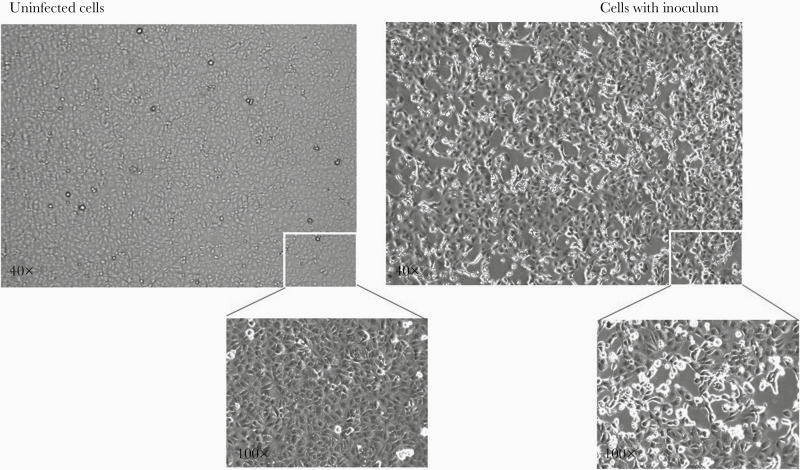
Results: SARS-CoV-2 RNA was detected since the early phase of illness, lasting over 2 weeks in both upper and lower respiratory tract samples. Virus isolate was obtained from acute respiratory samples, while no infectious virus was rescued from late respiratory samples with low viral RNA load, collected when serum antibodies had been developed. Several other specimens came back positive, including saliva, vomit, rectal, cutaneous, cervico-vaginal, and ocular swabs. IgM, IgA, and IgG were detected within the first week of diagnosis, with IgG appearing earlier and at higher titers. Neutralizing antibodies developed during the second week, reaching high titers 32 days after diagnosis.
Conclusions: Our longitudinal analysis showed that SARS-CoV-2 RNA can be detected in different body samples, which may be associated with broad tropism and different spectra of clinical manifestations and modes of transmission. Profiling antibody response and neutralizing activity can assist in laboratory diagnosis and surveillance actions.
Keywords: COVID-19; Italy; SARS-CoV-2; antibody response; phylogenesis; viral culture; virus shedding.
© The Author(s) 2020. Published by Oxford University Press on behalf of Infectious Diseases Society of America.
Figures
References
-
- European Centre for Disease Control and Prevention. Geographical distribution of 2019-nCov cases Available at: https://www.ecdc.europa.eu/en/geographical-distribution-2019-ncov-cases. Accessed 17 April 2020.
LinkOut - more resources
Full Text Sources
Miscellaneous
