

T cell counts and IL-6 concentration in blood of North African COVID-19 patients are two independent prognostic factors for severe disease and death
- PMID: 33527487
- PMCID: PMC8014881
- DOI: 10.1002/JLB.4COVA1020-703R
T cell counts and IL-6 concentration in blood of North African COVID-19 patients are two independent prognostic factors for severe disease and death
Abstract
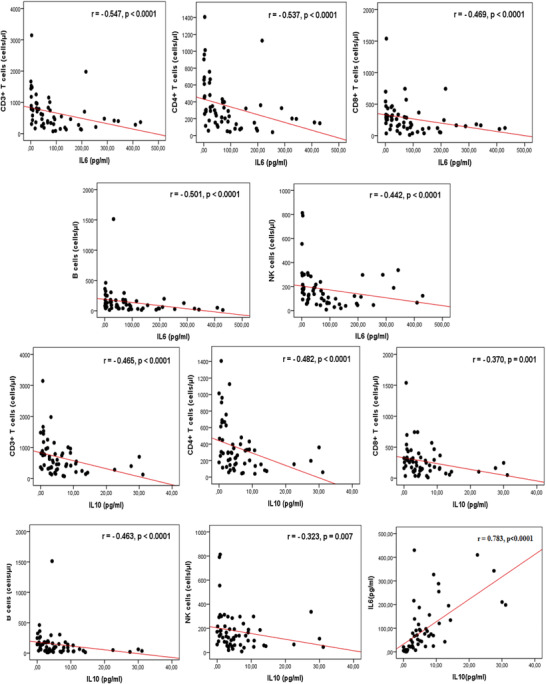
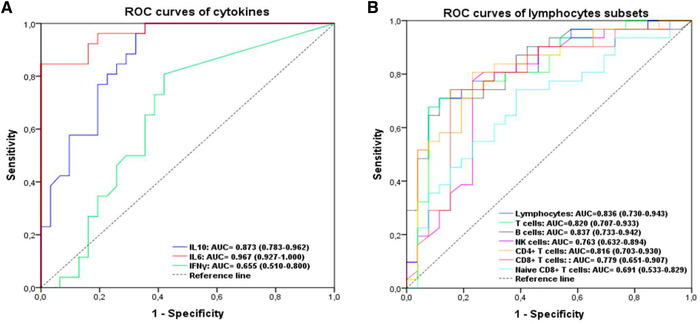
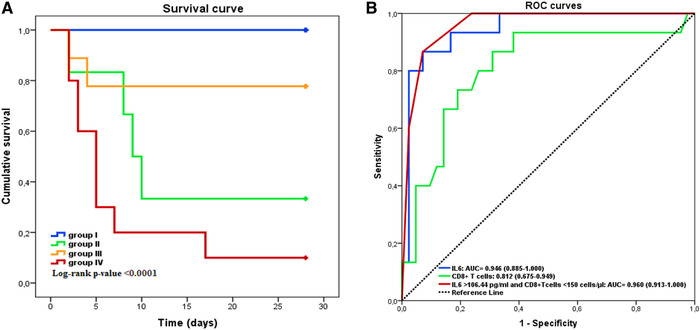
The immune system plays a crucial role in the response against severe acute respiratory syndrome coronavirus 2 with significant differences among patients. The study investigated the relationships between lymphocyte subsets, cytokines, and disease outcomes in patients with coronavirus disease 2019 (COVID-19). The measurements of peripheral blood lymphocytes subsets and cytokine levels were performed by flow cytometry for 57 COVID-19 patients. Patients were categorized into two groups according to the severity of the disease (nonsevere vs. severe). Total lymphocytes, T cells, CD4+ T cells, CD8+ T cells, B cells, and natural killer cells were decreased in COVID-19 patients and statistical differences were found among different severity of illness and survival states (P ˂ 0.01). The levels of IL-6 and IL-10 were significantly higher in severe and death groups and negatively correlated with lymphocyte subsets counts. The percentages of Th17 in the peripheral blood of patients were higher than those of healthy controls whereas the percentages of Th2 were lower. For the severe cases, the area under receiver operating characteristic (ROC) curve of IL-6 was the largest among all the immune parameters (0.964; 95% confidence interval: 0.927-1.000, P < 0.0001). In addition, the preoperative IL-6 concentration of 77.38 pg/ml was the optimal cutoff value (sensitivity: 84.6%, specificity: 100%). Using multivariate logistic regression analysis and ROC curves, IL-6 > 106.44 pg/ml and CD8+ T cell counts <150 cells/μl were found to be associated with mortality. Measuring the immune parameters and defining a risk threshold can segregate patients who develop a severe disease from those with a mild pathology. The identification of these parameters may help clinicians to predict the outcome of the patients with high risk of unfavorable progress of the disease.
Keywords: COVID-19; SARS-CoV2; cytokines; flow cytometry; lymphocytes; prognosis.
©2021 Society for Leukocyte Biology.
Figures

Comment in
-
Circulating IL-6 but not neutrophil extracellular traps levels can predict anakinra effectiveness in patients with severe COVID-19.J Leukoc Biol. 2022 Dec;112(6):1365-1367. doi: 10.1002/JLB.4LT0122-018RR. Epub 2022 Jun 15. J Leukoc Biol. 2022. PMID: 35704508 Free PMC article.
References
-
- WHO . COVID‐19 weekly epidemiological update. 2020;1;4. Available from: https://www.who.int/publications/m/item/weekly-epidemiological-update-29...
-
- Aylward B, Liang W. Report of the WHO‐China Joint Mission on Coronavirus Disease 2019 (COVID‐19). WHO‐China Jt Mission Coronavirus Dis 2019. 2020;2019:16‐24.
MeSH terms
Substances
LinkOut - more resources
Full Text Sources
Other Literature Sources
Medical
Research Materials
Miscellaneous
