. 2021 Apr 1;27(19):5906-5912.
doi: 10.1002/chem.202100387. Epub 2021 Mar 3.

Probing the Local Reaction Environment During High Turnover Carbon Dioxide Reduction with Ag-Based Gas Diffusion Electrodes

Affiliations

Probing the Local Reaction Environment During High Turnover Carbon Dioxide Reduction with Ag-Based Gas Diffusion Electrodes

Stefan Dieckhöfer et al. Chemistry. .

Abstract

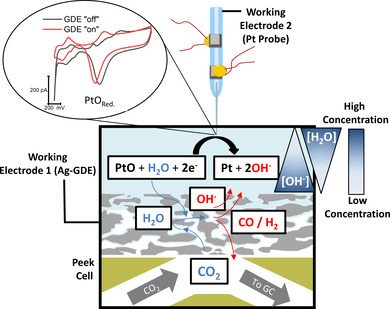
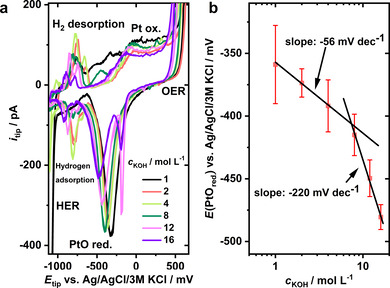
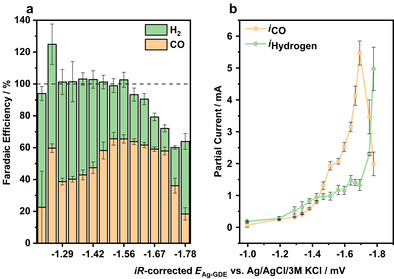
Discerning the influence of electrochemical reactions on the electrode microenvironment is an unavoidable topic for electrochemical reactions that involve the production of OH- and the consumption of water. That is particularly true for the carbon dioxide reduction reaction (CO2 RR), which together with the competing hydrogen evolution reaction (HER) exert changes in the local OH- and H2 O activity that in turn can possibly affect activity, stability, and selectivity of the CO2 RR. We determine the local OH- and H2 O activity in close proximity to a CO2 -converting Ag-based gas diffusion electrode (GDE) with product analysis using gas chromatography. A Pt nanosensor is positioned in the vicinity of the working GDE using shear-force-based scanning electrochemical microscopy (SECM) approach curves, which allows monitoring changes invoked by reactions proceeding within an otherwise inaccessible porous GDE by potentiodynamic measurements at the Pt-tip nanosensor. We show that high turnover HER/CO2 RR at a GDE lead to modulations of the alkalinity of the local electrolyte, that resemble a 16 m KOH solution, variations that are in turn linked to the reaction selectivity.

Keywords: carbon dioxide reduction; electrocatalysis; gas diffusion electrodes; local pH gradient; silver.


Figures

Figure 1
Figure 1
Local H2O and OH activities modulated by the competing HER and CO2RR are monitored using a precisely positioned Pt nanoelectrode. The PtO reduction peak potential changes with the different ion activities established inside the three‐phase boundary of the GDE at varying reaction rates.
Figure 2
Figure 2
a) pH‐dependent CVs obtained using a Pt nanoelectrode (ø=700 nm) in KOH solutions with concentrations from 1 m up to 16 m. CVs (scan rate: 200 mV s−1) were acquired between +600 and −1100 mV vs. Ag/AgCl/3 m KCl. b) Calibration curves derived from the PtOred. peak position (E PtOred. ) as a function of the KOH concentration. Linear fits (black lines) with different slopes (displayed in mV dec−1) suggest distinct concentration dependencies between 1 and 4 mol L−1 and between 8 and 16 mol L−1 as suggested by the slopes of −56 mV dec−1 and −220 mV dec−1, respectively. Peak positions are averaged over 3 different calibration measurements as indicated by the red error bars.
Figure 3
Figure 3
a) Pt‐tip voltammograms in the potential range between −0.8 and 0.8 V vs. Ag/AgCl/3 m KCl at a scan rate of 200 mV s−1 in 1 m KOH. The Pt‐sensor is approached to a distance of approximately 100 nm over the Ag‐GDE, which is polarized to potentials between −0.1 and −1.57 V vs. Ag/AgCl/3 m KCl invoking CO2RR and HER. b) Zoom‐in to the voltammograms displayed in (a), highlighting the shift of E PtOred. in dependence of an increased cathodic potential applied to the Ag‐GDE. c) Peak potentials of E PtOred. from the voltammograms in (a) as a function of applied E Ag‐GDE. Stars refer to measurements at −0.1 V vs. Ag/AgCl/3 m KCl, the lower one directly after the measurement at −1.69 V and the higher one after further biasing the GDE for 15 min to −0.1 V.
Figure 4
Figure 4
a) E Ag‐GDE‐dependent FE displaying the formation of CO (orange) and H2 (green) in dependence on the applied GDE potential. The individual measurements were averaged over 2 GC measurements per potential. b) Partial currents for H2 (green) and CO (orange) formation at Ag‐GDE (0.2 cm2 size) potentials between −1.0 and −1.8 V vs. Ag/AgCl/3 m KCl in 1 m KOH.

References

    1. Monteiro M. C. O., Jacobse L., Touzalin T., Koper M. T. M., Anal. Chem. 2020, 92, 2237–2243. - PMC - PubMed
    1. Botz A., Clausmeyer J., Öhl D., Tarnev T., Franzen D., Turek T., Schuhmann W., Angew. Chem. Int. Ed. 2018, 57, 12285–12289; - PubMed
    2. Angew. Chem. 2018, 130, 12465–12469.
    1. Ryu J., Wuttig A., Surendranath Y., Angew. Chem. Int. Ed. 2018, 57, 9300–9304; - PubMed
    2. Angew. Chem. 2018, 130, 9444–9448.
    1. None
    1. Schouten K. J. P., Pérez Gallent E., Koper M. T. M., J. Electroanal. Chem. 2014, 716, 53–57;

LinkOut - more resources