. 2021 May 6;28(5):938-954.e9.
doi: 10.1016/j.stem.2020.12.016. Epub 2021 Feb 1.

Pathogenic LMNA variants disrupt cardiac lamina-chromatin interactions and de-repress alternative fate genes

Affiliations

Pathogenic LMNA variants disrupt cardiac lamina-chromatin interactions and de-repress alternative fate genes

Parisha P Shah et al. Cell Stem Cell. .

Abstract

Pathogenic mutations in LAMIN A/C (LMNA) cause abnormal nuclear structure and laminopathies. These diseases have myriad tissue-specific phenotypes, including dilated cardiomyopathy (DCM), but how LMNA mutations result in tissue-restricted disease phenotypes remains unclear. We introduced LMNA mutations from individuals with DCM into human induced pluripotent stem cells (hiPSCs) and found that hiPSC-derived cardiomyocytes, in contrast to hepatocytes or adipocytes, exhibit aberrant nuclear morphology and specific disruptions in peripheral chromatin. Disrupted regions were enriched for transcriptionally active genes and regions with lower LAMIN B1 contact frequency. The lamina-chromatin interactions disrupted in mutant cardiomyocytes were enriched for genes associated with non-myocyte lineages and correlated with higher expression of those genes. Myocardium from individuals with LMNA variants similarly showed aberrant expression of non-myocyte pathways. We propose that the lamina network safeguards cellular identity and that pathogenic LMNA variants disrupt peripheral chromatin with specific epigenetic and molecular characteristics, causing misexpression of genes normally expressed in other cell types.

Keywords: genome organization; hiPSC; laminopathy; peripheral heterochromatin.


Conflict of interest statement

Declaration of interests K.M. is an advisor to and holds equity in Variant Bio and Verve Therapeutics.

Figures
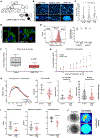
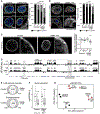
Figure 1:
Figure 1:. Establishment of a LMNA T10I model of hiPSC-CMs that mimics patient abnormalities.
(A) Pedigree of family with LMNA c29>T (T10I; proband indicated by arrow). Multiple family members experienced sudden cardiac death and/or heart failure. Filled shapes are tested individuals (proband: clinical testing, father: research testing). (B) DAPI staining of myocardium from patient at time of orthotopic heart transplantation compared to nonfailing control and idiopathic dilated cardiomyopathy. Scale bars: 5 μm (top), 50 μm (bottom). (C) Quantification of cardiomyocyte nuclei size (mean ± SEM; n>500 nuclei; nonfailing and idiopathic controls are from 4 and 3 patients, respectively; One-way ANOVA Kruskal-Wallis test with Dunn’s multiple comparison, **** indicates p<0.0001). Box represents interquartile range (25–75 percentile) and thick line is median. (D) TNNT2 immunostaining of hiPSC-CMs at day 25 (d25). Scale bars: 25 μm. (E) Representative flow cytometry profiles of d25 control (dark gray) and T10I (red) hiPSC-CM cultures stained with anti-TNNT2 (unstained, light gray). Quantification of TNNT2 and MLC2v expressing cells showed no significant difference in control and LMNA T10I (independent differentiation per dot, Mean ± 1 SD shown). (F) Atomic force microscopy (AFM) of control and LMNA T10I hiPSC-CMs with indentation frequency of 1 μm/sec. (Mean: small square box, error bars: 1 SD; large box: median and interquartile range; two-sample two-sided t-test, with post-hoc Bonferroni correction for multiple comparisons). (G) AFM performed across a range of stimulation rates from single hiPSC-CMs. Significant decrease in Young’s Modulus in T10I. Data represented as mean ± 1 SD (control: n=11; LMNA T10I: n=23). (H) Transient calcium reporter assays. Recording average on left and median and interquartile ranges of individual measurement panels on right. For both (G) and (H): Two-sample two-sided t-test, with post-hoc Bonferroni correction for multiple comparisons. (I) Cardiac contractile studies from single hiPSC-CMs (median and interquartile range; two-tailed t-test). For (F)-(I): Gray: control and Red: T10I. (J) Representative bright field images and corresponding time-averaged motion heat maps from motion capture analysis of beating 3D micropatterned cardiomyocyte cultures. Scale bars: 100 μm.
Figure 2:
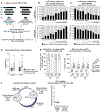
Figure 2:. Loss of genome organization at the nuclear lamina in LMNA T10I and R541C human hiPSC-CMs.
(A-B) Immunofluorescence of control and LMNA T10I hiPSC-CMs at days 25 (d25, A) and 45 (d45, B) stained for LB (red), TNNT2 (gray), H3K9me2 (red) with accompanying scoring of morphology (n>30 cells per condition; d25: 3×2 χ2 single nuclei to single nuclei=44.66 with 2 degrees of freedom, 3×2 χ2 multi-nuclei to multi-nuclei = 13.11 with 2 degrees of freedom; d45: 3×2 χ2 multi-nuclei to multi-nuclei=18.53 with 2 degrees of freedom; *** indicates p<0.001). Scale bars: 5 μm (A), 10 μm (B). (C) Immunofluorescence of indicated hiPSC-CMs (d45) show decreased proportion of H3K9me2 (gray) at lamina in mutants (Scale bars: 5 μm; One-way ANOVA Kruskal-Wallis test with Dunn’s multiple comparison; p=0.0004, 0.0004, <0.0001 of last bar compared to three adjacent bars, respectively; boxes indicate median and interquartile range with Tukey whiskers). (D) LB1 ChIP-seq of control and T10I hiPSC-CMs (d25, Chromosome 2, ~135MB-195MB); gray boxes show LADs in control-only or T10I-only. Black bars: EDD-defined LADs. (E) Genome coverage (top) and Ensembl feature representation (bottom) in control and LMNA T10I LADs (d25). (F) Expression of protein coding genes within and outside of LADs. Box plot indicates median and interquartile range with upper and lower hinges represent 25th and 75th percentiles, respectively; whiskers denote 1.5 X interquartile range (Kruskal-Wallis rank summed test; **** denotes p<0.0001 compared to respective non-LAD). (G) PCA of LB1 (circle) and H3K9me2 (square) occupancy across control (black), LMNA T10I (red) and LMNA R541C (pink) hiPSC-CMs. PC1=genotype; PC2=ChIP condition.
Figure 3:
Figure 3:. Changes in peripheral chromatin induced by LMNA variants are specific to hiPSC-CMs.
(A) Immunostaining of day 23 control and mutant hiPSC-heps with indicated antibodies. Scale bars: 5 μm. (B) Double-blind quantification of nuclear morphology of indicated hiPSC-heps. (T10I vs. control: 3×2 χ2=0.4485, p=0.799098. R541C vs. control: 3×2 χ2=0.5211, p=0.770646, n>500 cells per genotype). (C) 3-way Venn diagram showing LAD genome coverage overlap between control (white) and T10I and R541C (blue) hiPSC-heps. (D) Comparison of LB1 genome occupancy across a 50Mb region of Chromosome 2 in hiPSC-heps (top) and hiPSC-CMs (bottom). (E) Immunostaining of control and mutant hiPSC-adips with indicated antibodies. Scale bars: 10 μm. On right, double-blind quantification of nuclear morphology in control and mutant hiPSC-adips. n>300 cells per genotype. (T10I vs. control: 3×2 χ2=29.3092, p<0.0001. R541C vs. control: 3×2 χ2=6.1111, p=0.047097). (F) PCA of LB1 datasets across all three cell types. Independent of genotype, LADs from different cell types show distinct clustering. Control and mutant hiPSC-heps (blue) and -adips (green) cluster together. Mutant hiPSC-CMs are distinctly clustered from control (orange). (G) Comparison of LADs from control hiPSC-CMs (orange) to control hiPSC-heps (blue) and control hiPSC-CMs to control hiPSC-adips (green). Genes relevant to alternative cellular identities are enriched in cell type-specific LADs: gene ontology shows enrichment of genes/categories relevant to the opposite cell type per pairwise comparison; selected categories shown.
Figure 4:
Figure 4:. A specific subset of lamina-associated chromatin is affected by LMNA T10I hiPSC-CMs.
(A) Schema of gene density and LB1 contact frequency calculations in control hiPSC-CM LADs. (B-C). LB1 contact frequency (B) and gene density index (C) of shared LADs (black) and control-only LADs (gray) separated into deciles of increasing LB1frequency or gene density across increasing control day 25 (d25; top) and day 45 (d45; bottom). Dotted lines indicate percentage of LADs shared in each analysis. In (B), n=1201 and 1333 total LAD regions for d25 and d45, respectively. In (C), gene density analysis includes LADs with at least one gene; n=640 and 753 LAD regions for d25 and d45, respectively. Control-only LADs are significantly enriched for lower LB1 contact frequency and higher gene density. In (B): 2×10 χ2=72.462 and 195.958 with 9 degrees of freedom, top and bottom, respectively. In (C): 2×10 χ2=37.610 and 34.439 with 9 degrees of freedom, top and bottom, respectively. (D) Expression of genes in shared versus control-only LADs in control hiPSC-CMs (left). Expression of genes in shared versus T10I-only LAD regions in T10I hiPSC-CMs (right, Kruskal-Wallis rank summed test with Conover test; **** denotes p<0.0001 to respective shared LAD regions). (E) Measure of genomic distance for control-only (gray) and T10I-only (white) LADs to nearest shared LAD (left). The majority of control-only and T10I-only LADs are within 50kb (open squares) of the end of a shared LAD. Size of control-only and T10I-only LADs near shared LADs versus control-only and T10I-only LADs greater than 50kb away (cross hatched squares) from shared LADs (right). Box plots in (D, E) indicate median and interquartile range (upper and lower hinges represent 25th and 75th percentiles, respectively) and whiskers denote 1.5 X interquartile range. (F) Genome occupancy of LADs in control (dark blue) and T10I (light blue) hiPSC-heps, and control-only and T10I-only LADs from d25 hiPSC-CMs; shared overlap shown in white. Control-only hiPSC-CM LADs are mostly unique to hiPSC-CMs, while T10I-only CM LADs overlap with hiPSC-hep LADs. Box plot shows significantly lower overlap of 1000 shuffled “test” LAD regions (same number/size of each T10I-only LAD) with control hiPSC-hep LADs compared to observed overlap (two-tailed one sample t-test).
Figure 5:
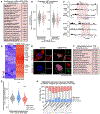
Figure 5:. Loss of in lamina-bound chromatin in T10I hiPSC-CMs results in non-myocyte gene expression.
(A) GREAT analysis of lamina-associated regions found only in control (defined across biological replicates). (B) LB1 occupancy of LADs with non-neuronal (left) and neuronal-related (right) genes in control (gray) and LMNA T10I (pink) hiPSC-CMs (non-neuronal: Wilcoxon signed rank test with continuity correction; neuronal: Paired t-test, p<0.01 for non-neuronal, and p<0.05 for neuronal). Δ indicatesmMedian-to-median change in LB1 occupancy (neuronal Δ nearly 2X non-neuronal Δ). LAD genes defined by TSS within 50 kb of EDD-defined LAD. (C) LB1 ChIP-seq at PAX6. (D) Heatmap of top 100 upregulated genes by fold change (FDR<0.05) in T10I d25 hiPSC-CMs compared to control. (E) Immunostaining of control and T10I d25 hiPSC-CMs for indicated antibodies. Scale bars: 10 μm. (F) Gene ontology analysis of upregulated genes in T10I hiPSC-CMs compared to control. Selected categories shown for (A) and (F). (G) Difference in length normalized LB1 occupancy (T10I minus control) of differentially expressed genes in d25 T10I hiPSC-CMs (no change, gray; downregulated genes, blue; upregulated genes, red). Differentially expressed genes defined between T10I and control hiPSC-CMs, d25. (Kruskal-Wallis rank sum test, **** denotes p<0.0001 compared to no change, Box plot in (B) and (G) indicates median and interquartile range with upper and lower hinges represent 25th and 75th percentiles). (H) Expression status of genes in each GREAT grouping in T10I compared to control hiPSC-CMs. The left-most column indicates the overall proportion of up- and down-regulated genes.
Figure 6:
Figure 6:. Human LMNA DCM myocardium signature shows LB1 loss in hiPSC-CMs.
(A) Overlap of upregulated genes in idiopathic DCM compared to LMNA DCM from published datasets [each compared to respective/linked non-failing controls; LMNA DCM:non-failing control (Cheedipudi et al., 2019), idiopathic DCM:non-failing control (Tan et al., 2020)]. 1882 genes are uniquely upregulated in LMNA-linked disease; gene ontology analysis shows enrichment for neuronal genes (adj. p-values shown in the right column, selected categories shown). Genes from categories were combined to define a LMNA myocardium non-myocyte gene signature, n= 727 genes after expression filtering. (B) Differential expression of human myocardium genes in T10I hiPSC-CMs (left column: T10I compared to control hiPSC-CMs, middle column LMNA myocardium upregulated genes, right column: LMNA myocardium non-myocyte signature; for middle and right columns only genes represented in hiPSC-CM RNA-seq dataset included) (3×3 χ2 =185.22 with 4 degrees of freedom, p<0.0001). (C) LB1 occupancy in control and T10I hiPSC-CMs (d25) of genes in LMNA myocardium non-myocyte signature. Δ indicates median-to-median change in LB1 occupancy. Adjacent boxes show the LB1 occupancy in control and T10I hiPSC-CMs of the subset of genes which were not changed (gray box), downregulated (blue box), and upregulated (red box). Wilcoxon signed rank test with continuity correction, ****p<0.0001, **p<0.01, Box plot indicates median and interquartile range with upper and lower hinges represent 25th and 75th percentiles.
Figure 7:
Figure 7:. Model.
Cells have tissue-specific LAD maps. LADs with genes and lower LB1 contact frequency specifically lose LB1 association in mutant hiPSC-CMs. Genes relevant to alternative lineages lose LB1 contact and are expressed in mutant hiPSC-CMs. Mutant hiPSC-hep or -adip LADs are minimally different from control hiPSC-heps or -adips.

References

    1. Benjamini Y, and Hochberg Y (1995). Controlling the False Discovery Rate: A Practical and Powerful Approach to Multiple Testing. Journal of the Royal Statistical Society Series B (Methodological) 57, 289–300.
    1. Bertero A, Fields PA, Smith AST, Leonard A, Beussman K, Sniadecki NJ, Kim D-H, Tse H-F, Pabon L, Shendure J, et al. (2019). Chromatin compartment dynamics in a haploinsufficient model of cardiac laminopathy. The Journal of Cell Biology. - PMC - PubMed
    1. Bintu B, Mateo LJ, Su JH, Sinnott-Armstrong NA, Parker M, Kinrot S, Yamaya K, Boettiger AN, and Zhuang X (2018). Super-resolution chromatin tracing reveals domains and cooperative interactions in single cells. Science 362. - PMC - PubMed
    1. Brady GF, Kwan R, Bragazzi Cunha J, Elenbaas JS, and Omary MB (2018). Lamins and Lamin-Associated Proteins in Gastrointestinal Health and Disease. Gastroenterology 154, 1602–1619 e1601. - PMC - PubMed
    1. Briand N, and Collas P (2020). Lamina-associated domains: peripheral matters and internal affairs. Genome Biol 21, 85. - PMC - PubMed

Publication types