. 2021 Mar 17;109(6):997-1012.e9.
doi: 10.1016/j.neuron.2021.01.003. Epub 2021 Feb 1.

Alternating sources of perisomatic inhibition during behavior

Affiliations

Alternating sources of perisomatic inhibition during behavior

Barna Dudok et al. Neuron. .

Abstract

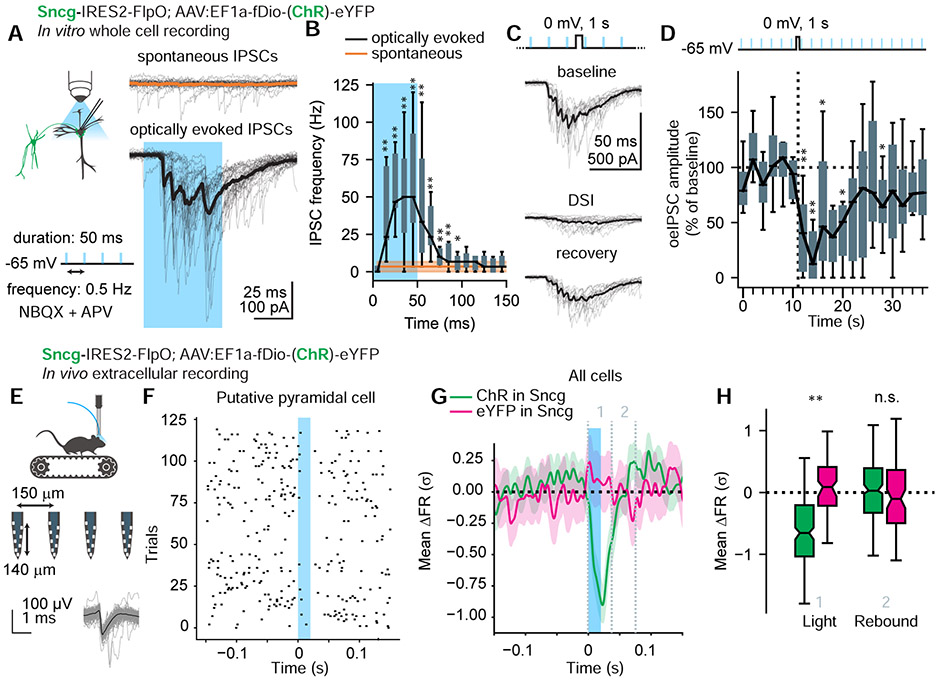
Interneurons expressing cholecystokinin (CCK) and parvalbumin (PV) constitute two key GABAergic controllers of hippocampal pyramidal cell output. Although the temporally precise and millisecond-scale inhibitory regulation of neuronal ensembles delivered by PV interneurons is well established, the in vivo recruitment patterns of CCK-expressing basket cell (BC) populations has remained unknown. We show in the CA1 of the mouse hippocampus that the activity of CCK BCs inversely scales with both PV and pyramidal cell activity at the behaviorally relevant timescales of seconds. Intervention experiments indicated that the inverse coupling of CCK and PV GABAergic systems arises through a mechanism involving powerful inhibitory control of CCK BCs by PV cells. The tightly coupled complementarity of two key microcircuit regulatory modules demonstrates a novel form of brain-state-specific segregation of inhibition during spontaneous behavior.

Keywords: CA1; CB1 receptor; GABA; Sncg; brain state; cholecystokinin; hippocampus; inhibition; interneuron; locomotion; parvalbumin.


Conflict of interest statement

Declaration of interests The authors declare no competing interests.

Figures

Figure 1.
Figure 1.. Sncg-Flp transgenic mice allow genetic targeting of CCK/CB1 expressing BCs
A. eYFP was expressed under the control of Sncg-Flp, with AAV vector injected in the CA1. Confocal micrograph (maximum intensity projection of a 60 μm coronal slice). White arrows show colocalization between eYFP and proCCK immunostaining. B. Somatic colocalization of proCCK (75 ± 15%, n = 244 cells, 6 mice, 2 females, 4 males) and PV (2 ± 2%, n = 177 cells, 4 male mice, Fig. S1). Markers show animals, box plots show median ± confidence interval (CI) and range. C. Labeled axons were specific to the pyramidal and proximal radiatum layers, and were immunopositive for CB1 receptor (colocalization appears white). D. High powered confocal micrograph (maximum intensity projection) showing CB1 immunopositive axonal varicosities in the str. pyramidale. E. Scatterplot of voxel intensities showing elevated CB1 intensities in eYFP-positive voxels. White lines show thresholds and the regression line. F. eYFP and CB1 colocalization exceeded chance (n = 3 male mice, t(2) = 4.42, p = .048, paired t-test). G. Whole cell patch clamp recordings of Sncg cells in acute hippocampal slices revealed regular spiking, adapting firing patterns during ±75 pA current steps. See also Fig. S1. H. Representative biocytin filled cell with axons in the str. pyramidale (axonal varicosities from a single 60 μm slice shown in light grey) and dendrites extending from the str. oriens to the lacunosum-moleculare (dark blue). I. The soma from panel h was proCCK immunopositive. J. The axon from panel h was CB1 immunopositive. K. Schematic of the targeted Patch-seq approach. L. Dendrogram of the sequenced cells mapped onto a consensus transcriptomic taxonomy. Dark shades identify three “subclasses”. Light shades identify “supertypes” and end branches show “clusters” (Yao et al., 2020, also see Methods). M. Expression of common IN marker genes in individual Sncg cells (sorted by supertype). N. Laminar distribution of cell bodies by transcriptomic supertype. Colored markers show the location of the cell body normalized to the thickness of the pyramidale layer (grey shading). Cell type had no effect on soma location. Kruskal-Wallis test, H(7) = 6.47, p = .486, n = 102 cells.
Figure 2.
Figure 2.. Sncg INs inhibit PCs.
A. Sncg INs channelrhodopsin (ChR) expression produced PC oeIPSCs in response to light pulses (50 ms, 0.5 Hz). Individual sweeps shown in grey, average in black or orange. B. Asynchronous IPSCs persisted following light pulses. One-sided Wilcoxon signed rank test, n = 12 cells. Box plots show median, IQR and range. Asterisks show bins with IPSC rate greater than baseline (*: p < .05; **: p < .01). C. Brief PC depolarization (to 0 mV for 1 s) resulted in depolarization-induced suppression of inhibition (DSI), evident in reduced oeIPSC amplitude. D. oeIPSC amplitude across consecutive sweeps, normalized to baseline. Depolarization was delivered between sweeps 6 and 7. Maximal DSI was observed at sweep 8, Wilcoxon signed rank test, W = 1, p = .004, n = 11 cells from 3 animals, 1 male and 2 females, pooled after no significant difference between animals was revealed by Kruskal-Wallis test (p > .05). Asterisks show sweeps that were significantly different from baseline. E. Schematic of the experiment design. Spike waveforms of an example unit (putative pyramidal cell) are shown. See also Fig. S2. F. Raster plot of spikes from the same unit across all trials (20 ms light pulses at 2 Hz), aligned on stimulus onset. Note the suppression of spiking persisting beyond the light pulse. G. Average z-scored firing rate (gaussian filtered) from all units ± CI. Vertical dashed lines indicate the time windows averaged for statistical analysis. H. Light pulses suppressed firing rates in ChR mice compared to controls by −0.68 ± 0.08 σ between 0 to 40 ms, χ2(1) = 7.55, p = .006, likelihood ratio test, n = 289 units, 6 mice, 4 ChR and 2 YFP, 2 hemispheres per mice). Sex had no effect on response in ChR mice (χ2(1) = 0.5, p = .49, likelihood ratio test, n = 194 units, 2 females, 2 males. There was no significant rebound effect (40 to 80 ms, χ2(1) = 0, p = 1, likelihood ratio test).
Figure 3.
Figure 3.. Recruitment of Sncg INs during spontaneous behavior
A. Schematic of the experimental design for in vivo calcium imaging of Sncg IN activity with correlated detection of SWRs. Asterisk shows the same event on panels A and B. Voltage traces are shown in black, filtered trace in blue, envelope in orange, horizontal lines depict thresholds (3 and 5 SD, see Methods). T = 0 (dashed line) is where the envelope crosses the first threshold. B. Example trace of in vivo calcium imaging of a single representative Sncg IN. Vertical lines show the onset of SWR events detected in the contralateral CA1. C. Event-triggered average activity of individual Sncg INs aligned on Run – Stop and SWR events. Cells are sorted by response magnitude. All recordings were made in awake mice, SWRs were analyzed during rest. Note the different time scale and dynamic range for the two plots. T = 0 is the time of run-stop (treadmill speed drops to zero, top) or SWR onset (bottom). D. The run- and SWR response scores of Sncg INs. Data was pooled from both experiments shown on this figure and Fig. 4. No effect of experimental group or sex was detected on the run response (likelihood ratio test, p(group) = 0.91, p(sex) = .054, n = 141 cells, 28 sessions, 8 animals, 5 females and 3 males) or the SWR response (p(group) = .11, p(sex) = .20).
Figure 4.
Figure 4.. Divergent recruitment of Sncg and PV INs during brain state transitions in vivo
A. PV × Sncg double transgenic mice targeted distinct genetically encoded reporters to INs. B. Fluorescent intensity (FI) in IN somata (log scale). Markers show individual cells, colored by FI ratio. N = 373 cells from 6 mice, 1 male, 5 females. Pearson’s R, p < .001. C. Experimental strategy. D. Example traces of a single Sncg and a PV IN. See also Fig. S3. E. Event triggered average traces of Sncg and PV INs aligned to the start of running, along with the pupil diameter, running speed and face movement attributes. Traces show mean ± SEM values across all recorded cells. F. PV IN responses to running (post-pre; pre = −10 to 0 s, post = 0 to 5 s) were greater than Sncg IN responses by 46 ± 2% DF/F, likelihood ratio test, χ2 = 294, p < .001, n = 469 cells from 3 male mice. G. Response of Sncg and PV INs during run – stop events. H. Sncg IN stop responses (post-pre; pre = −10 to 0 s, post = 0 to 5 s) were greater than in PV INs by 43 ± 2% DF/F, likelihood ratio test, χ2 = 372, p < .001, n = 469 cells from 3 male mice. See also Fig. S3. I. Response of Sncg and PV INs during SWRs. J. The SWR response of PV INs (post-pre; pre = −1 to 0 s, post = 0 to 128 ms) was greater than the response of Sncg INs by 6 ± 0.7% DF/F, likelihood ratio test, χ2 = 57, p < .001, n = 262 cells from 2 male mice. K. Response of Sncg and PV INs to face movements. The events shown here were detected in the absence of running. Note that the value of the face movement attribute was also high during running (panels e, g, different y axis scale). L. The response of PV INs to face movement events (post-pre; pre = −10 to 0 s, post = 0 to 1 s) was greater than the response of Sncg INs by 15 ± 1% DF/F, likelihood ratio test, χ2 = 245, p < .001, n = 469 cells from 3 male mice. Box plots show median ± IQR, whiskers show range, notches represent CI.
Figure 5.
Figure 5.. Sncg IN activity is suppressed by PV INs
A. Example dual calcium imaging of Sncg and PV IN populations (top), with simultaneous recordings of treadmill movement, pupil diameter and face movements (bottom). The dotted line shows a linear model fit of Sncg IN activity using PV IN activity and the displayed behavioral attributes as input features (R2 = 0.87 ± 0.06, n = 16 sessions, 3 male mice). B. Prediction scores of models assessing the effect of removing certain features from the inputs. During run-rest transitions (green bars), delay (effect size = 0.24 ± 0.02, χ2 = 112, p < .001, n = 16 sessions, 3 animals, likelihood ratio test) and PV (0.25 ± 0.02, χ2 = 68, p < .001) were significant factors, while behavior was not (χ2 = 1, p = .46). Similarly, during immobility, delay (0.2 ± 0.02, χ2 = 89 p < .001) and PV (0.28 ± 0.02, χ2 = 104 p < .001) are significant factors, while behavior is not (χ2 = 4, p = .06). ***: PV IN activity allowed more accurate prediction than behavioral parameters (p < .001, n = 16, Wilcoxon signed rank test on paired sample). Box plots show median ± IQR, whiskers show range, notches represent CI. See also Fig. S4. C. ChR-associated mCherry expression in PV INs and GCaMP in Sncg INs. The Sncg IN somata were surrounded by the mCherry-expressing axons (white arrows) of PV INs. D. Appositions of PV IN axons with the somata and proximal dendrites of Sncg IN. N = 37 cells from 6 mice, 1 male, 5 females. Colored markers show cells, black markers show animals, error bar shows median ± IQR. E. Opsin (C1V1) expression in PV INs resulted in oeIPSCs in Sncg INs in response to light pulses (200 ms, 0.5 Hz). Individual sweeps shown in grey, average in blue. The maximal response during the stimulus window was averaged across sweeps. N = 6 Sncg INs from 3 mice. F. During calcium imaging, trains of light pulses (3 s total, 15 ms each at 15.6 Hz) were delivered in a closed loop system, triggered at 50% probability 1 s after running ceased. No light trials did not alter the run - stop response in Sncg INs. The baseline (before run - stop) is subtracted from these traces. G. The run - stop response of Sncg INs was suppressed by light in mice expressing ChR in PV INs. H. Closed loop driving of PV INs suppressed Sncg INs during the stop response (effect of ChR with light compared to all controls: −33 ± 11% DF/F, χ2(1) = 10, p = .0017, likelihood ratio test, n = 128 cells * stimulus type, 16 sessions, 6 animals, 5 males, 1 female). **: Wilcoxon rank sum test for effect of light between Sncg cells from ChR and control mice, W = 247, p = .002, n =61, effect size r = 0.38. n.s.: no light trials, W = 443, p = .32.
Figure 6.
Figure 6.. Sncg IN activity scales inversely with network activity during spontaneous behavior, while PV IN activity scales positively.
A. Labeling strategy for the simultaneous recording of the activity of Sncg INs and all neurons. B. Example average time projection from a cropped region of a calcium movie. The arrow highlights an Sncg IN (cyan) among other neurons (red). C. Example calcium traces (average of 5 Sncg cells and 1677 unidentified neurons). Note the coordinated inverse changes in fluorescence of Sncg INs and all neurons during running (shaded areas) and immobility (arrows highlight the run-stop response and fluctuations of activity during immobility). D. DF/F traces were averaged in 1 s time bins, and the bins were sorted based on the intensity value of all neurons. The average running speed in each bin is also shown. E. Normalized activity of Sncg INs and all neurons after averaging the traces into 25 equally sized bins according to rank by DF/F of all neurons (n = 13 sessions, 5 male mice). The curves and shaded areas show mean ± SEM. F. Maximal absolute correlation was negative at 1.0 s resolution and zero offset, black dashed lines show the location of the maximum. See Fig. S6 and Methods for the description of the correlation metric. G. Labeling strategy for the simultaneous recording of the activity of PV INs and all neurons. H. Example image as in B. Arrows highlight PV cells coexpressing GCaMP (green) and mCherry (orange). I. Example calcium traces (average of 21 PV cells and 951 unidentified neurons). Note the coordinated increase of activity during running (shaded areas). Arrows highlight coordinated fluctuations of activity during immobility. J. Averaged and sorted 1 s time bins reveal strong correlation between PV IN and overall average neuronal activity. K. Normalized activity of PV INs as a function of rank by DF/F of all neurons (n = 4 sessions, 4 male mice). L. Maximal absolute correlation was positive at 0.78 s resolution and zero offset.
Figure 7.
Figure 7.. Sncg IN activity is inversely scaled to the activity of place cells and PV INs.
A. The activity of identified place cells in an example recording session are shown in frames when the animal was running (n = 884 units, sorted by preferred location). B. The position of the mouse was accurately decoded from the activity of spatially selective cells (R = 0.83 ± 0.12 on held out laps, n = 8 sessions from 5 male mice). C. Example trace showing average in-field place cell activity (see Methods). D. Activity of in-field place cells sorted by Sncg IN activity. E. Negative correlation between the activity of in-field place cells and Sncg INs. See also Fig. S6. F. Maximal absolute correlation was negative at 0.8 s resolution and 0.2 s offset. G. Relative activity of PV INs is plotted as a function of relative Sncg IN activity. H. Maximal absolute correlation was negative at 1.0 s resolution and 0.5 s offset, n = 21 sessions, 3 animals, from the same set of experiments as on Fig. 4C-L. See also Fig. S7.

Comment in

References

    1. Acsády L, Katona I, Martínez-Guijarro FJ, Buzsáki G, and Freund TF (2000). Unusual target selectivity of perisomatic inhibitory cells in the hilar region of the rat hippocampus. J. Neurosci 20, 6907–6919. - PMC - PubMed
    1. Ahmed MS, Priestley JB, Castro A, Stefanini F, Solis Canales AS, Balough EM, Lavoie E, Mazzucato L, Fusi S, and Losonczy A (2020). Hippocampal Network Reorganization Underlies the Formation of a Temporal Association Memory. Neuron 107, 283–291.e6. - PMC - PubMed
    1. Amilhon B, Huh CYL, Manseau F, Ducharme G, Nichol H, Adamantidis A, and Williams S (2015). Parvalbumin Interneurons of Hippocampus Tune Population Activity at Theta Frequency. Neuron 86, 1277–1289. - PubMed
    1. Armstrong C, and Soltesz I (2012). Basket cell dichotomy in microcircuit function. J. Physiol 590, 683–694. - PMC - PubMed
    1. Arriaga M, and Han EB (2017). Dedicated hippocampal inhibitory networks for locomotion and immobility. J. Neurosci 37, 1076–17. - PMC - PubMed

Publication types