Clinical Trial
. 2021 Feb:64:103230.
doi: 10.1016/j.ebiom.2021.103230. Epub 2021 Jan 30.

SARS-CoV-2 persistence is associated with antigen-specific CD8 T-cell responses

Affiliations
Clinical Trial

SARS-CoV-2 persistence is associated with antigen-specific CD8 T-cell responses

Line K Vibholm et al. EBioMedicine. 2021 Feb.

Abstract

Background: Upon SARS-CoV-2 infection, most individuals develop neutralizing antibodies and T-cell immunity. However, some individuals reportedly remain SARS-CoV-2 PCR positive by pharyngeal swabs weeks after recovery. Whether viral RNA in these persistent carriers is contagious and stimulates SARS-CoV-2-specific immune responses is unknown.

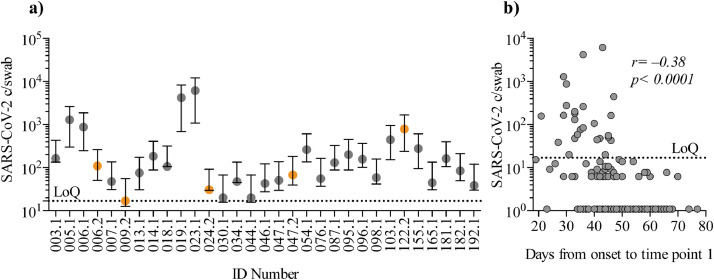
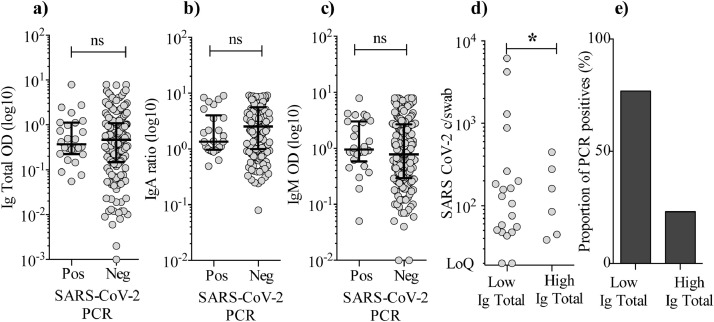
Methods: This cohort study was conducted between April 3rd-July 9th 2020, recruiting COVID-19 recovered individuals that were symptom-free for at least 14 days. We collected serum for SARS-CoV-2-specific total Ig, IgA and IgM detection by ELISA, pharyngeal swabs (two time points) for ddPCR and PBMCs for anti-SARS-CoV-2 CD8 T-cell dextramer analyses.

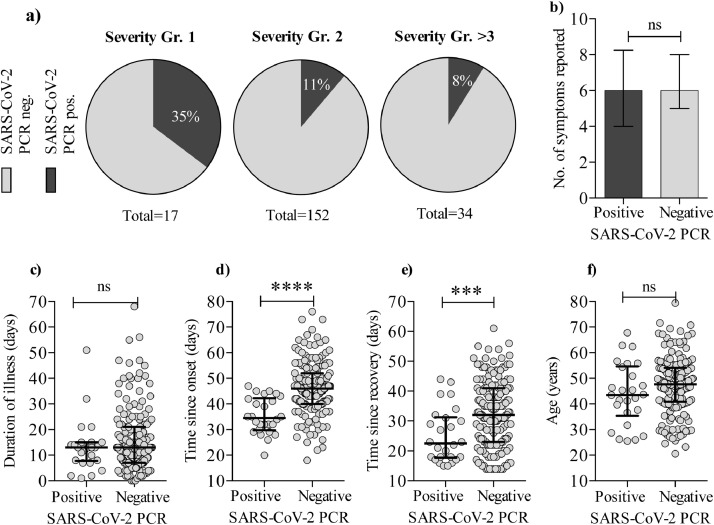
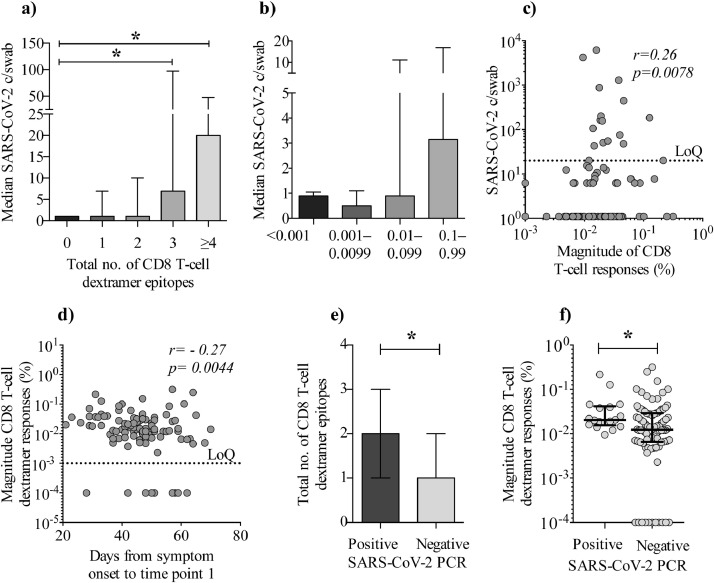
Findings: We enrolled 203 post-symptomatic participants with a previous RT-PCR-verified SARS-CoV-2 infection. At time point 1, a median of 23 days (range 15-44) after recovery, 26 individuals (12⋅8%) were PCR positive. At time point 2, 90 days (median, range 85-105) after recovery, 5 (5⋅3%) were positive. There was no difference in SARS-CoV-2 antibody levels between the PCR negative and positive group. The persistent PCR positive group however, had SARS-CoV-2-specific CD8 T-cell responses of significantly increased breadth and magnitude. Assisted contact tracing among persistent PCR positive individuals revealed zero new COVID-19 diagnoses among 757 close contacts.

Interpretation: Persistent pharyngeal SARS-CoV-2 PCR positivity in post-symptomatic individuals is associated with elevated cellular immune responses and thus, the viral RNA may represent replicating virus. However, transmission to close contacts was not observed indicating that persistent PCR positive individuals are not contagious at the post-symptomatic stage of the infection.

Keywords: Antibodies; CD8 T cell responses; Contact tracing; Immunology; Persistent PCR positive; SARS-CoV-2; Transmission.


Conflict of interest statement

Declaration of Competing Interest The authors report no conflict of interest.

Figures

Fig 1
Fig. 1
SARS-CoV-2 PCR copy number at time point 1 and 2. a) Positive SARS-CoV-2 copies/swab (c/swab) for the cohort at first and second visit. X-axis show ID numbers and visit time points. Time point 1 is grey and time point 2 is orange. Y-axis depicts detected SARS-CoV-2 c/swab as measured by digital droplet PCR (log10). Only positive values with copy number above limit of quantification (LoQ) is shown. Error bars are 95% confidence intervals. b) Correlation between time from symptom onset to sample collection on time point 1 (days) and copy number per swab. X-axis depicts time from onset. Y-axis show SARS-CoV-2 c/swab (log10). LoQ was determined to ≥ 3 events (see materials and methods section). Statistical analyses were by Spearman´s correlation coefficient, and the analyses included all data points.
Fig 2
Fig. 2
Clinical characteristics of persistent SARS-CoV-2 positivity. PCR outcome vs. severity of COVID-19 disease. a) Pie charts depicting the proportion of participants who had a positive PCR on time point 1 in each on the COVID-19 severity groups (as described in table 1). b) Graph shows the number of symptoms reported during illness for the PCR positive vs. PCR negative group. c) The duration of COVID-19 illness for the PCR positive vs. PCR negative group. d) Time since symptom onset (Mann-Whitney U test: p < 0⋅0001) and e) time since recovery (Mann-Whitney U test: p = 0⋅001) for the PCR negative vs. positive group. f) Age distribution for the PCR positive vs. PCR negative group. Error bars are shown as median with IQR. Statistical comparisons were by Mann Whitney U test. (ns: not significant. *: p < 0⋅05; **: p < 0⋅01; ***: p < 0⋅001; ****: p < 0⋅0001).
Fig. 3
Fig. 3
Levels of SARS-CoV-2-specific total Ig, IgA, and IgM and the relation to PCR results. a–c) Levels of SARS-CoV-2-specific total immunoglobulins (Ig), IgA, and IgM measured in serum for participants tested PCR positive vs. negative at the time point 1 visit (median of 45 days after onset of illness). Total Ig is shown as OD values (sample diluted 1:100), IgA shown as ratio against standard, IgM shown as OD (diluted 1:11). Signal was read at 450 nm with reference measurements at 650 nm. Error bars are shown as median with IQR. Statistical comparisons were by Mann-Whitney U test. d) SARS-CoV-2 RNA c/swab for the 50% lowest (n = 101) total Ig group were compared to the copy number in the 50% highest total Ig group (n = 102). Only data points with a value above the LoQ (≥3 events by ddPCR) are depicted in the graph. Statistical analyses included all data points and were by Mann-Whitney U test (Ig total low vs. Ig total high; p = 0⋅014). e) Proportions of PCR positive individuals in the low total Ig group and high total Ig group.
Fig 4
Fig. 4
Increased breadth and magnitude of CD8 T-cell responses in persistent PCR positive individuals. CD8 T-cell dextramer responses vs. SARS-CoV-2 PCR c/swab. a) The x-axis depicts the breadth of CD8 T-cell dextramer responses for HLA-A2-positive part of the cohort (n = 106), where ≥4 equals 4–7 epitopes. Y-axis shows the median copy number of SARS-CoV-2 copies per swab (c/swab) (Mann-Whitney U test: p = 0⋅02 and 0⋅03). b) X-axis depicts median SARS-CoV-2 c/swab. At the y-axis, individuals are grouped according to the magnitude of the accumulated/total CD8 T-cell dextramer responses (n = 106). c) X-axis depicts absolute SARS-CoV-2 c/swab and y-axis the magnitude of CD8 T-cell dextramer responses (Spearman's rank correlation coefficient: p = 0⋅0078, r = 0⋅26). d) Graph depicts the association between timespan from symptom onset until time point 1 (x-axis) vs. the magnitude of CD8 T-cell dextramer responses (y-axis) (Spearman's rank correlation coefficient: p = 0⋅0044, r = −0⋅27). e) Breadth of the CD8 T-cell responses shown as the total number of epitopes (y-axis) detected in PCR positive vs. PCR negative individuals (x-axis) (Mann-Whitney U test: p = 0⋅02). f) Magnitude of CD8 T-cells response (y-axis) for PCR positive individuals vs. PCR negative individuals (p = 0⋅01). Error bars are shown as median with IQR. Statistical comparisons were by Mann Whitney U test (*: p < 0⋅05). Correlations were Spearman's rank correlation coefficient.

Comment in

References

    1. Zhou P, Yang X-L, Wang X-G, Hu B, Zhang L, Zhang W. A pneumonia outbreak associated with a new coronavirus of probable bat origin. Nature. 2020;579:270–273. - PMC - PubMed
    1. World Health Organization. COVID-19 weekly epidemiological update. World Heal Organ. 2020 December 27.
    1. Wu Yongjian, Guo C, Tang L, Hong Z, Zhou J, Dong X. Prolonged presence of SARS-CoV-2 viral RNA in faecal samples. Lancet Gastroenterol Hepatol. 2020;5:434–435. - PMC - PubMed
    1. Wu J, Liu X, Liu J, Liao H, Long S, Zhou N. Coronavirus Disease 2019 test results after clinical recovery and hospital discharge among patients in China. JAMA Netw Open. 2020;3 - PMC - PubMed
    1. Hartman WR, Hess AS, Connor J. Persistent viral RNA shedding after COVID-19 symptom resolution in older convalescent plasma donors. Transfusion. 2020:1–3. - PMC - PubMed

Publication types