

One Year of SARS-CoV-2: How Much Has the Virus Changed?
- PMID: 33530355
- PMCID: PMC7911924
- DOI: 10.3390/biology10020091
One Year of SARS-CoV-2: How Much Has the Virus Changed?
Abstract
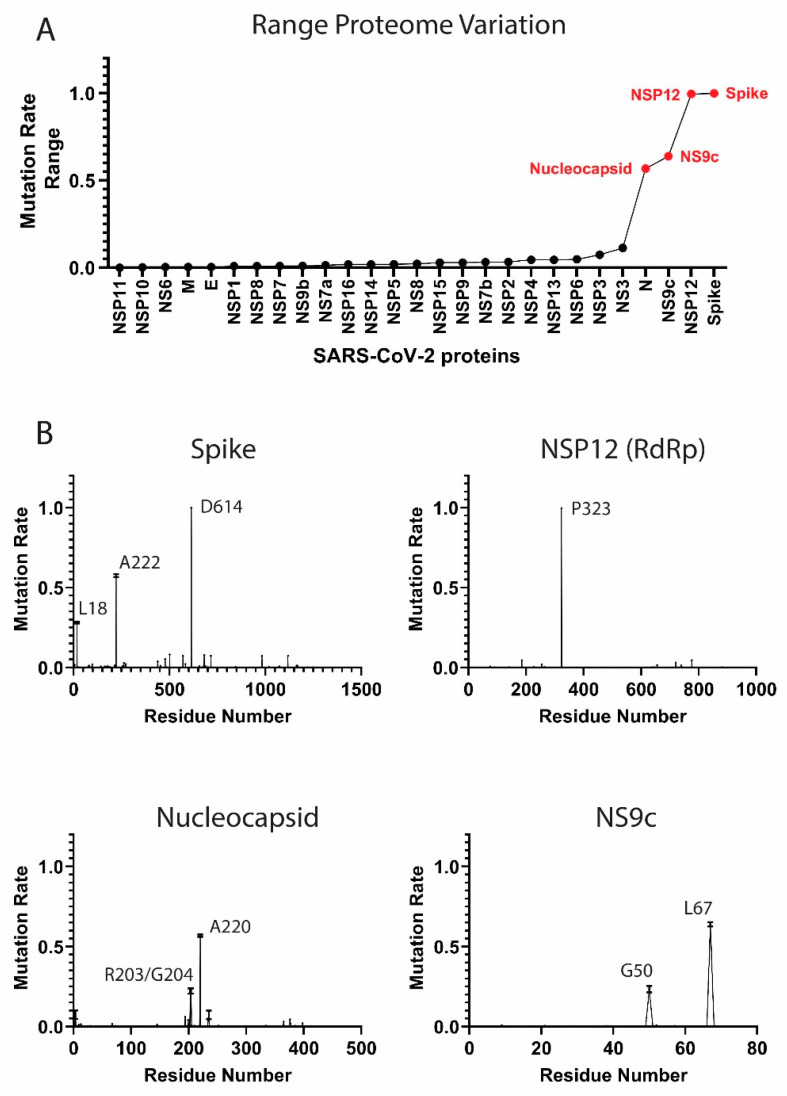
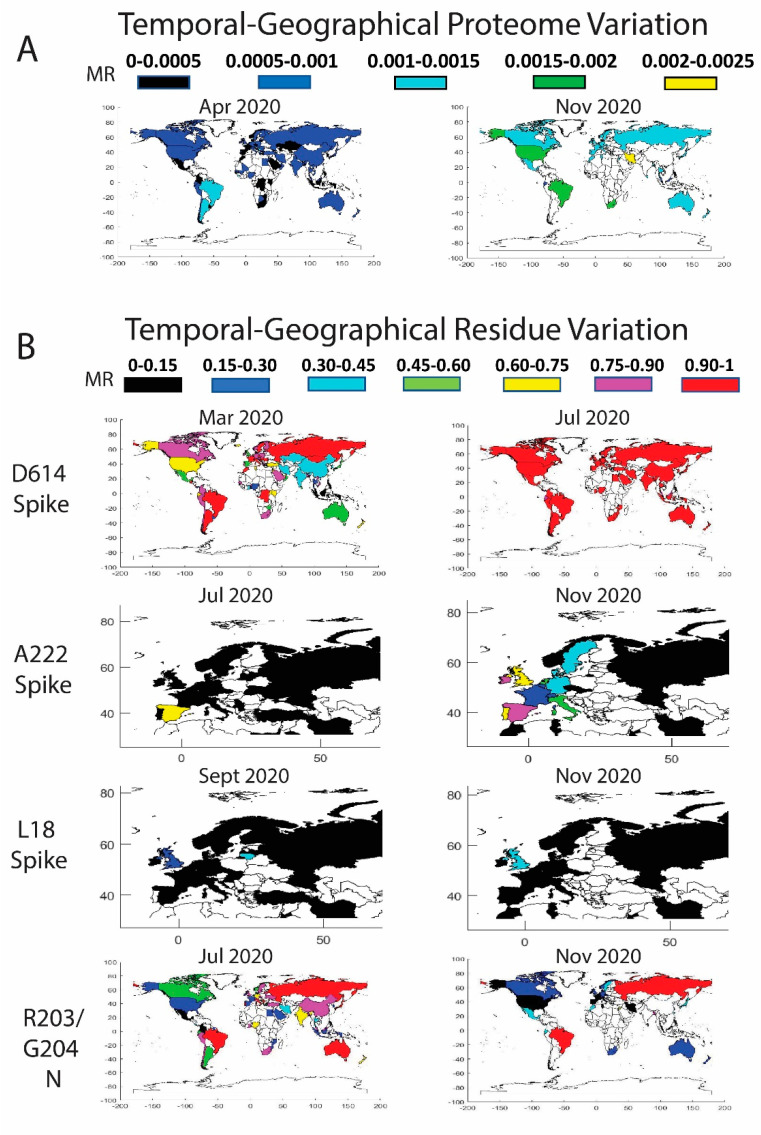
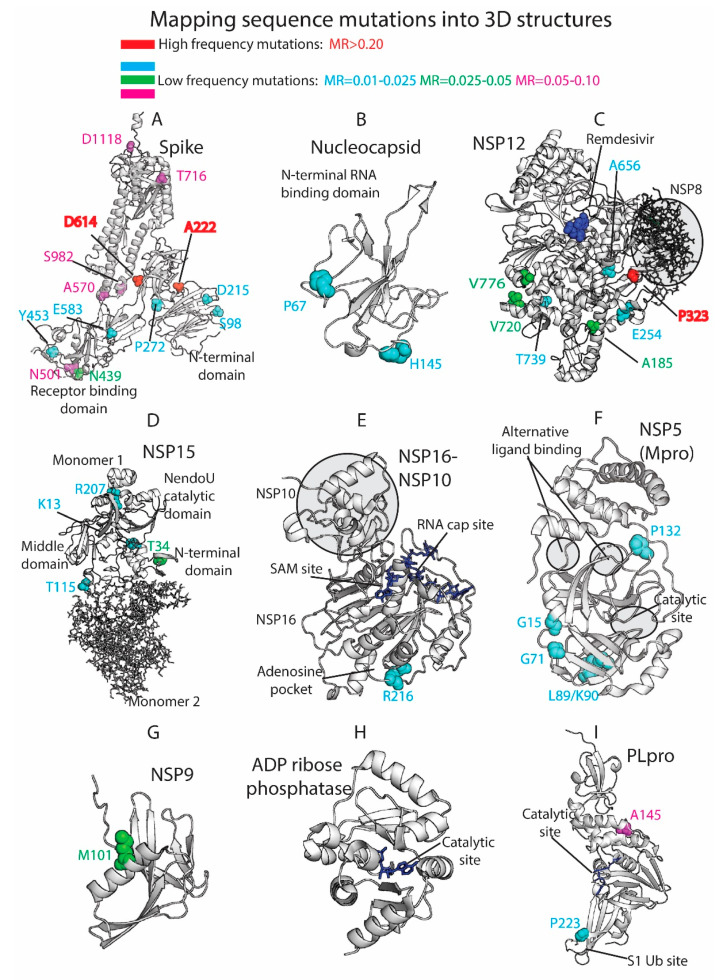
Severe acute respiratory syndrome coronavirus 2 (SARS-CoV-2) has caused a worldwide crisis with profound effects on both public health and the economy. In order to combat the COVID-19 pandemic, research groups have shared viral genome sequence data through the Global Initiative on Sharing All Influenza Data (GISAID). Over the past year, ≈290,000 full SARS-CoV-2 proteome sequences have been deposited in the GISAID. Here, we used these sequences to assess the rate of nonsynonymous mutants over the entire viral proteome. Our analysis shows that SARS-CoV-2 proteins are mutating at substantially different rates, with most of the viral proteins exhibiting little mutational variability. As anticipated, our calculations capture previously reported mutations that arose in the first months of the pandemic, such as D614G (Spike), P323L (NSP12), and R203K/G204R (Nucleocapsid), but they also identify more recent mutations, such as A222V and L18F (Spike) and A220V (Nucleocapsid), among others. Our comprehensive temporal and geographical analyses show two distinct periods with different proteome mutation rates: December 2019 to July 2020 and August to December 2020. Notably, some mutation rates differ by geography, primarily during the latter half of 2020 in Europe. Furthermore, our structure-based molecular analysis provides an exhaustive assessment of SARS-CoV-2 mutation rates in the context of the current set of 3D structures available for SARS-CoV-2 proteins. This emerging sequence-to-structure insight is beginning to illuminate the site-specific mutational (in)tolerance of SARS-CoV-2 proteins as the virus continues to spread around the globe.
Keywords: 3D proteins; COVID-19; SARS-CoV-2; mutations; proteome; sequence.
Conflict of interest statement
The authors declare no conflict of interest.
Figures

References
-
- OECD Policy Responses to Coronavirus (COVID-19) The Territorial Impact of COVID-19: Managing the Crisis Across Levels of Government. [(accessed on 15 December 2020)]; Available online: http://www.oecd.org/coronavirus/policy-responses/the-territorial-impact-....
-
- Race M., Ferraro A., Galdiero E., Guida M., Núñez-Delgado A., Pirozzi F., Siciliano A., Fabbricino M. Current emerging SARS-CoV-2 pandemic: Potential direct/indirect negative impacts of virus persistence and related therapeutic drugs on the aquatic compartments. Environ. Res. 2020;188:109808. doi: 10.1016/j.envres.2020.109808. - DOI - PMC - PubMed
Grants and funding
LinkOut - more resources
Full Text Sources
Other Literature Sources
Research Materials
Miscellaneous
