. 2021 Jan 26;14(2):90.
doi: 10.3390/ph14020090.

Protopine/Gemcitabine Combination Induces Cytotoxic or Cytoprotective Effects in Cell Type-Specific and Dose-Dependent Manner on Human Cancer and Normal Cells

Affiliations

Protopine/Gemcitabine Combination Induces Cytotoxic or Cytoprotective Effects in Cell Type-Specific and Dose-Dependent Manner on Human Cancer and Normal Cells

Mercedes Garcia-Gil et al. Pharmaceuticals (Basel). .

Abstract

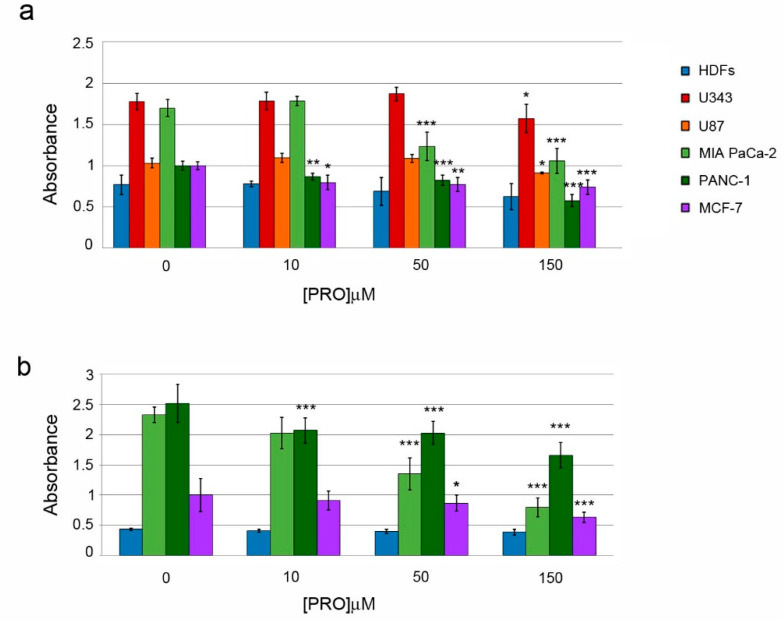
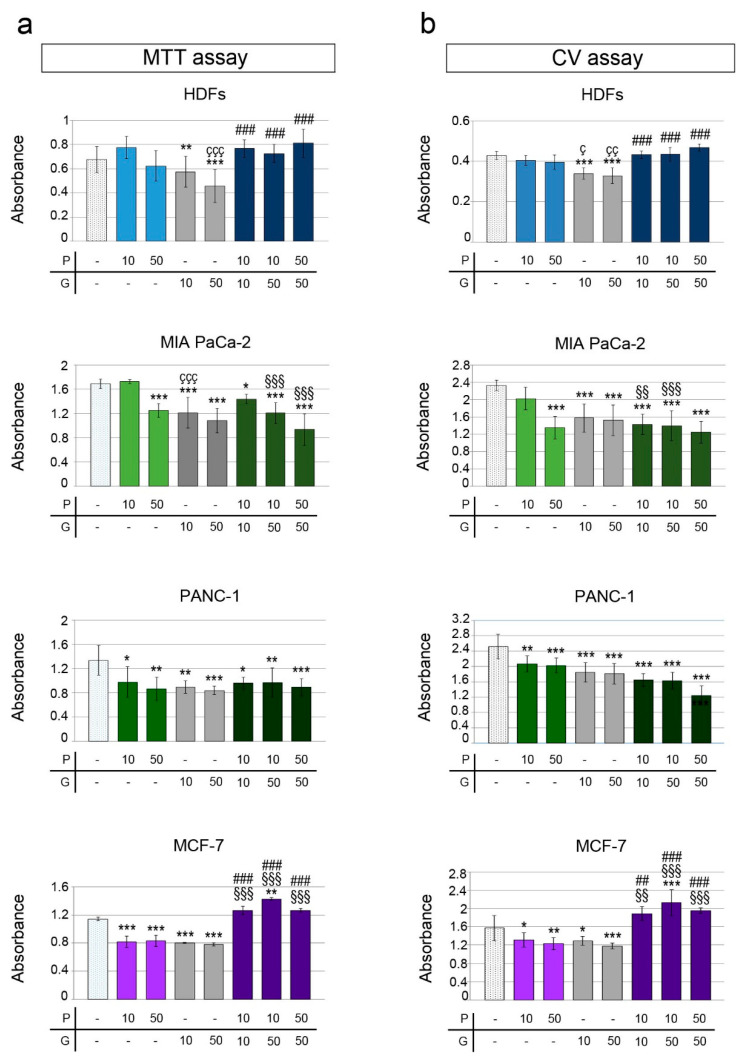
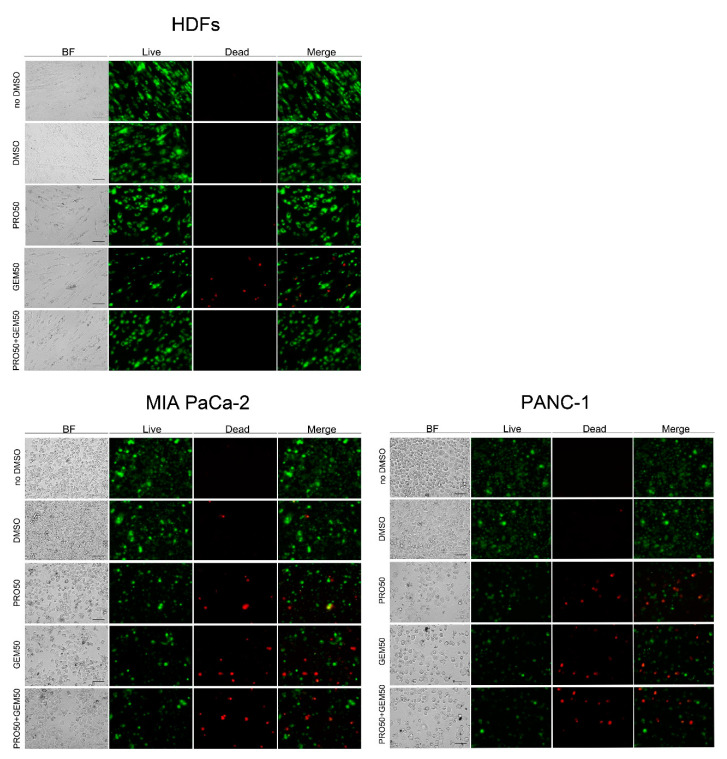
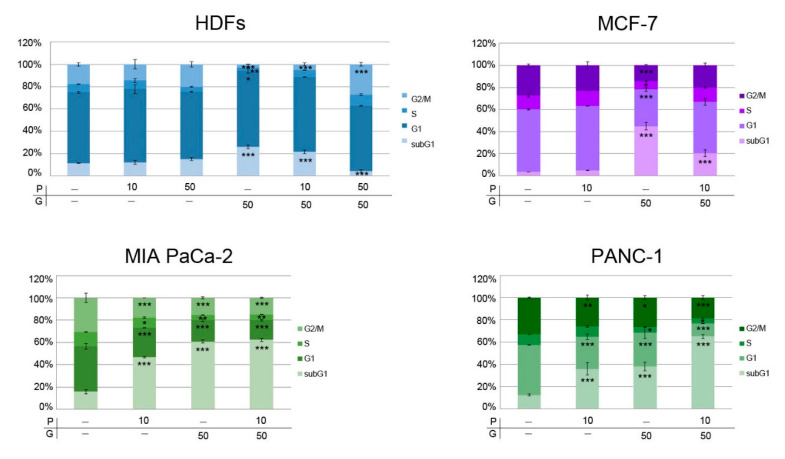
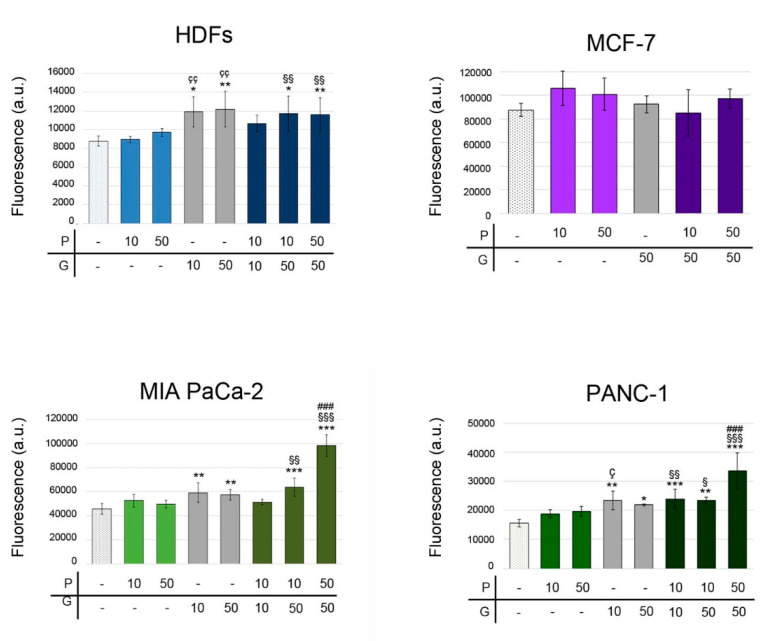
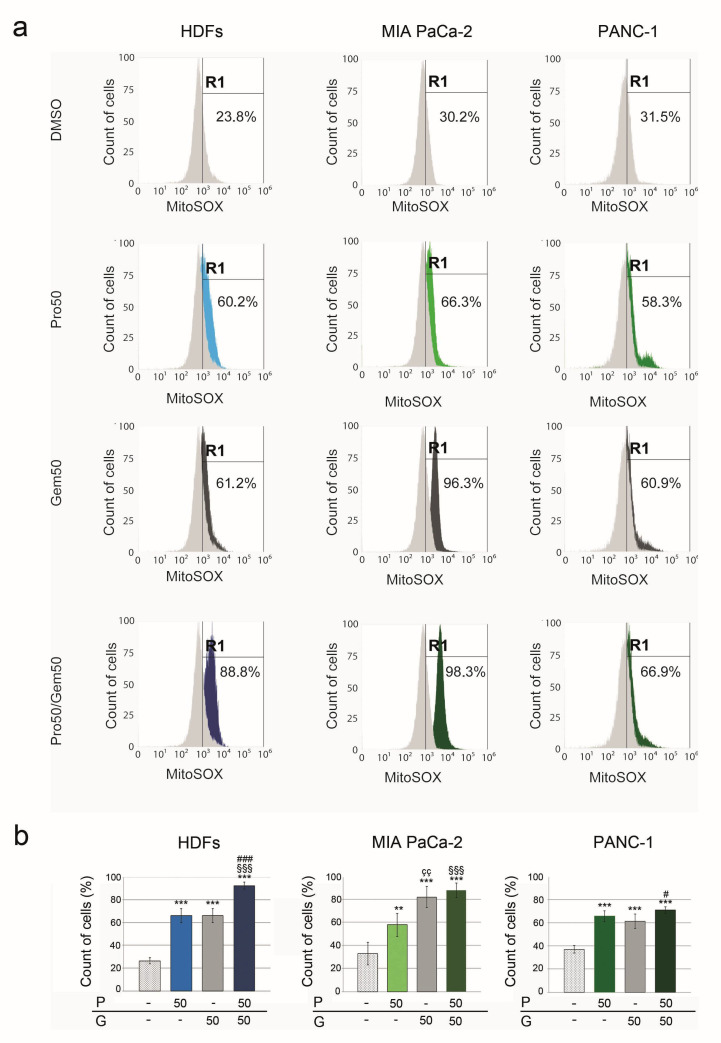
The natural alkaloid protopine (PRO) exhibits pharmacological properties including anticancer activity. We investigated the effects of PRO, alone and in combination with the chemotherapeutic gemcitabine (GEM), on human tumor cell lines and non-tumor human dermal fibroblasts (HDFs). We found that treatments with different PRO/GEM combinations were cytotoxic or cytoprotective, depending on concentration and cell type. PRO/GEM decreased viability in pancreatic cancer MIA PaCa-2 and PANC-1 cells, while it rescued the GEM-induced viability decline in HDFs and in tumor MCF-7 cells. Moreover, PRO/GEM decreased G1, S and G2/M phases, concomitantly with an increase of subG1 phase in MIA PaCa-2 and PANC-1 cells. Differently, PRO/GEM restored the normal progression of the cell cycle, altered by GEM, and decreased cell death in HDFs. PRO alone increased mitochondrial reactive oxygen species (ROS) in MIA PaCa-2, PANC-1 cells and HDFs, while PRO/GEM increased both intracellular and mitochondrial ROS in the three cell lines. These results indicate that specific combinations of PRO/GEM may be used to induce cytotoxic effects in pancreatic tumor MIA PaCa-2 and PANC-1 cells, but have cytoprotective or no effects in HDFs.

Keywords: ROS; cell cycle; cytoprotection; cytotoxicity; gemcitabine; protopine.


Conflict of interest statement

The authors declare no conflict of interests.

Figures

Figure 1
Figure 1
Effects of protopine (PRO) on cell viability. (a) Cell viability of human dermal fibroblasts (HDFs), U343, U87, MIA PaCa-2, PANC-1 and MCF-7 cells was evaluated after treatments for 48 h with different PRO doses, by using MTT. Graph columns represent mean of absorbance values ± standard deviation (SD) measured with MTT assay. In (b) Graph columns represent mean of absorbance values ± SD evaluated with crystal violet (CV) assay in the indicated cell lines. Graph columns represent mean ± SD of fluorescence intensity values. Control group contained only PRO vehicle, DMSO. The PRO doses (μM) used in treatments are indicated in x-axis. The symbols * indicate statistical significance versus control group. * p < 0.05; ** p < 0.01; *** p < 0.001.
Figure 2
Figure 2
Impact of different PRO/gemcitabine (GEM) combinations on cell viability of HDFs, MIA PaCa-2, PANC-1 and MCF-7 cells. Cell viability of HDFs, MIA PaCa-2, PANC-1 and MCF-7 cells was assessed by MTT (a) or crystal violet (CV) assay (b). PRO and GEM doses (μM) used in treatments are indicated in x-axis. Graph columns represent mean of absorbance ± SD (a,b). The symbol * indicates statistical significance of any treatment versus control group; ç, statistical significance of GEM versus the corresponding concentration of PRO; §, #, statistical significance of PRO/GEM combinations versus the corresponding concentration of PRO or GEM, respectively. P = protopine; G = gemcitabine. *, ç p < 0.05; **, çç, §§, ## p < 0.01; ***, ççç, §§§, ### p < 0.001.
Figure 3
Figure 3
Fluorescence micrographs of LIVE/DEAD-stained HDFs, MIA PaCa-2, and PANC-1 cells. Cells were treated in the presence of 50 μM PRO, 50 μM GEM or 50 μM PRO + 50 μM GEM for 48 h or in the presence or absence of DMSO as vehicle (controls). Figures are representative images obtained with fluorescence microscopy, as reported in Materials and Methods. Green-labeled DiOC18(3)-positive cells correspond to live cells, red-labeled propidium iodide-positive cells correspond to dead cells. BF = brightfield. Scale bar = 100 μm, represented in BF images, is valid for all images.
Figure 4
Figure 4
PRO/GEM combination altered cell cycle progression of MIA PaCa-2, PANC-1, MCF-7 cells and HDFs. The graphs show a quantification of cell cycle distribution, expressed as percent values of the means of cell number ± SD found in the cell cycle phases after different treatments. PRO and GEM doses (μM) used in treatments are indicated in x-axis. The symbol * indicates statistical significance versus control. P = protopine; G = gemcitabine. * p < 0.05, ** p < 0.01, *** p < 0.001.
Figure 5
Figure 5
Impact of PRO/GEM treatments on intracellular ROS levels on MIA PaCa-2, PANC-1, MCF-7 cells and HDFs. The values of fluorescence intensity ± SD after PRO/GEM treatments are reported. The symbols denote statistical significance: *, any treatment versus control; ç, GEM versus the corresponding concentration of PRO; §, #, PRO/GEM combinations versus the corresponding concentration of PRO or GEM, respectively. P = protopine; G = gemcitabine. *, §, ç p < 0.05; **, §§, çç p < 0.01; ***, §§§, ###, p < 0.001.
Figure 6
Figure 6
PRO, GEM and PRO/GEM increased mitochondrial ROS levels. (a) Flow cytometry analysis of MitoSOX signal in HDF, MIA Paca-2 and PANC-1 cells treated with DMSO, PRO50 μM, GEM50 μM or PRO50 μM + GEM50 μM. Measurements were performed using the BL3 (off 488 laser) 695/40 nm. Y-axis = percent of count of cells acquired (3 × 10⁴); x-axis = fluorescence intensity of the MitoSOX dye; R1 = gating strategy based on DMSO cell population used as a control. (b) Graph columns represent mean of MitoSOX signal ± SD, expressed as percent values. The symbol * denotes statistical significance versus control group; ç, statistical significance of GEM versus the corresponding concentration of PRO; §, #, statistical significance of PRO/GEM combination versus the corresponding concentration of PRO or GEM. P = protopine; G = gemcitabine. # p < 0.05; **, çç, p < 0.01; ***, §§§, ### p < 0.001.

References

    1. Capistrano I.R., Vangestel C., Vanpachtenbeke H., Fransen E., Staelens S., Apers S., Pieters L. Coadministration of a Gloriosa superba extract improves the in vivo antitumoural activity of GEM in a murine pancreatic tumour model. Phytomedicine. 2016;23:1434–1440. doi: 10.1016/j.phymed.2016.07.012. - DOI - PubMed
    1. Donadelli M., Dando I., Zaniboni T., Costanzo C., DallaPozza E., Scupoli M.T., Scarpa A., Zappavigna S., Marra M., Abbruzzese A., et al. Gemcitabine/cannabinoidcombination triggers autophagy in pancreaticcancercellsthrough a ROS-mediatedmechanism. Cell Death Dis. 2011;2:e152. doi: 10.1038/cddis.2011.36. - DOI - PMC - PubMed
    1. Du J., Sun Y., Lu Y.Y., Lau E., Zhao M., Zhou Q.M., Su S.B. Berberine and evodiamine act synergistically against human breast cancer MCF-7 cells by inducing cell cycle arrest and apoptosis. Anticancer Res. 2017;37:6141–6151. doi: 10.21873/anticanres.12063. - DOI - PubMed
    1. Chiaravalli M., Reni M., O’Reilly E.M. Pancreatic ductal adenocarcinoma: State-of-the-art 2017 and new therapeutic strategies. Cancer Treat. Rev. 2017;60:32–43. doi: 10.1016/j.ctrv.2017.08.007. - DOI - PubMed
    1. Robinson B.W., Ostruszka L., Im M.M., Shewach D.S. Promising combination therapies with gemcitabine. Semin. Oncol. 2004;31:2–12. doi: 10.1053/j.seminoncol.2004.03.021. - DOI - PubMed

LinkOut - more resources