. 2021 Jan 26;22(3):1217.
doi: 10.3390/ijms22031217.

Gene Editing Correction of a Urea Cycle Defect in Organoid Stem Cell Derived Hepatocyte-like Cells

Affiliations

Gene Editing Correction of a Urea Cycle Defect in Organoid Stem Cell Derived Hepatocyte-like Cells

Mihaela Zabulica et al. Int J Mol Sci. .

Abstract

Urea cycle disorders are enzymopathies resulting from inherited deficiencies in any genes of the cycle. In severe cases, currently available therapies are marginally effective, with liver transplantation being the only definitive treatment. Donor liver availability can limit even this therapy. Identification of novel therapeutics for genetic-based liver diseases requires models that provide measurable hepatic functions and phenotypes. Advances in stem cell and genome editing technologies could provide models for the investigation of cell-based genetic diseases, as well as the platforms for drug discovery. This report demonstrates a practical, and widely applicable, approach that includes the successful reprogramming of somatic cells from a patient with a urea cycle defect, their genetic correction and differentiation into hepatic organoids, and the subsequent demonstration of genetic and phenotypic change in the edited cells consistent with the correction of the defect. While individually rare, there is a large number of other genetic-based liver diseases. The approach described here could be applied to a broad range and a large number of patients with these hepatic diseases where it could serve as an in vitro model, as well as identify successful strategies for corrective cell-based therapy.

Keywords: CRISPR; disease modelling; genome editing; hepatocytes; iPSC; urea cycle.


Conflict of interest statement

S.C.S. hold stocks in Yecuris, LLC. The funders had no role in the design of the study; in the collection, analyses, or interpretation of data; in the writing of the manuscript, or in the decision to publish the results.

Figures

Figure 1
Figure 1
Mutation identification and study overview. (a) OTC gene sequence alignment in OTC-deficient (OTCD) patient to reference gene. Sequencing coverage and depth, OTC gene, coding sequence (CDS), mRNA and variants identified after alignment of OTC gene in OTCD patient to reference gene (NCBI ID: 5009) are shown. The genomic region containing the single nucleotide polymorphism (SNP, rs66656800) causing the disease is presented in the bottom panel (c.386G>A). (b) Representation of OTC transcript in healthy (OTC-proficient, OTCP) hepatocytes and OTCD patient. Three different OTC transcripts are present in patient’s hepatocytes: skipping of exon 4 (r.299_386del), elongation of exon 4 with the first 4 bp of intron 4 (r.386_387ins386+1_386+4) and the full length of transcript with exon 4 harboring the mutation (r. 386g>a). Grey boxes represent introns (E2, E3, E4, E5). *: Mutation r.386g>a on RNA level which results in Arg129His substitution on protein level. (c) Amplification of OTC transcript. Amplification of OTC transcript spanning exons 1 to 5 was performed in normal (OTCP) and OTCD hepatocytes. OTCD appeared to have bands of two different lengths, around 550 (wild-type) and 450 bp. (d) Schematic diagram depicting the overview of the study. Fibroblasts from the OTCD donor were reprogrammed into induced pluripotent stem cells (iPSC). Thereafter, the cells were submitted to genome engineering to correct the disease-causing variant. Finally, cells were differentiated into hepatocyte-like cells through organoid formation and were phenotypically characterized (Illustration was partly generated with images from © Adobe Stock, Mountain View, CA, USA).
Figure 2
Figure 2
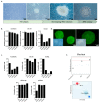
Generation and characterization of patient OTCD iPSC. (a) Generation of iPSC. Progressive stages of patient fibroblast reprogramming into iPSC are presented, starting from fibroblasts (left), moving into emerging iPSC colonies (middle), and eventually obtaining typical iPSC colony with characteristic features including sharp edges, round shape and homogeneous cell population (right). Scale bars are indicated in the respective images. (b) Expression profile of OTCD iPSC clones. Three different iPSC clones obtained from reprogramming OTCD fibroblasts, denoted as OTCD1, OTCD2 and OTCD3, were characterized for gene expression profile of pluripotency markers (NANOG, OCT4 and SOX2). The expression was normalized to endogenous control gene (PPIA) and compared to the respective levels in embryonic stem cells (ESC). Technical replicates n = 3. (c) Protein levels of iPSC clones. Three different iPSC clones obtained from reprogramming of OTCD fibroblasts, denoted as OTCD1, OTCD2 and OTCD3, were characterized for protein expression profile of pluripotency markers (NANOG, OCT4, SOX2, TRA-1-60, SSEA3) through flow cytometry and compared to the respective levels in ESC. (d) Alkaline phosphatase activity staining as a pluripotent marker. Representative pictures of alkaline phosphatase activity staining on generated iPSC colonies from OTCD patient cells. Scale bars are indicated in the respective images. (e) PluriTest. Pluripotency scores (upper panel) of fibroblasts (negative control), ESC (positive control) and OTCD3 iPSC clone were assessed through PluriTest. Red and blue areas in the lower panel refer to pluripotent and differentiated profiles, respectively, within SCM2 matrix data set. Fibroblasts, ESC and OTCD3 iPSC clones are indicated with arrows. n = 1.
Figure 3
Figure 3
CRISPR/Cas9-mediated gene targeting of patient’s OTCD iPSC. (a) Genome engineering strategies. Single guide RNA (gRNA1, gRNA2) (left panel) and dual gRNA (combination of gRNA3a with gRNA3b, and gRNA4a with gRNA4b) (right panel) approaches were used to achieve the best editing efficiency. Single guides were delivered along with wild-type Cas9, while dual guides with nickase Cas9. Position of mutation respective to gRNAs is marked in the figure. (b) Assessment of cleavage efficiency. Editing efficiency was estimated based on intensities of wild-type and cleaved bands following restriction enzyme digestion. Negative: untransfected cells. CRISPR-transfected: cells transfected with Cas9 and gRNA. (c) Restriction enzyme assay—clone screening. A total number of 54 iPSC clones were serially isolated, expanded and screened. Screening was conducted with restriction enzyme digestion assay which would digest only successfully corrected DNA sequence of targeted region. One iPSC clone was edited on both alleles having only digested bands, similar to the healthy control (positive control). A representative unedited clone is also shown. (d) Sequencing of genomic DNA of unedited and edited clones. The genomic region of interest containing the disease-causing variant was Sanger-sequenced in unedited and edited iPSC clones. Three base pairs were identified as differences between the parental and the engineered cells (indicated with arrows), as expected. Two of those are silent mutations which were deliberately introduced to increase the correction efficiency, and one is the mutation intended to be edited to correct OTC deficiency. (e) Investigation of OTC transcript. Amplification of OTC transcript spanning from exon 1 to exon 5 was performed in OTC-proficient (OTCP) primary and OTCD primary hepatocytes, as well as in unedited and edited iPSC hepatocyte-like cells (iPSC-HLC). One wild-type band was presented in cells correctly expressing the gene (OTCP primary hepatocytes and edited iPSC-HLC), while two bands (wild-type and shorter band due to exon skipping) in genetically defected cells (OTCD primary hepatocytes and unedited iPSC-HLC).
Figure 4
Figure 4
Stages of hepatic differentiation. Representative pictures of iPSC differentiation towards hepatoblast, and eventually organoid iPSC hepatocyte-like cells (iPSC-HLC) are shown at different magnifications. Synopsis of differentiation protocol is shown at the bottom of the figure. Scale bar indicated in each image.
Figure 5
Figure 5
Gene expression profiling of organoid iPSC hepatocyte-like cells (HLC) organoids. Expression of genes for liver-specific plasma proteins and metabolic enzymes (a), urea cycle proteins (b), phase I and II conjugation proteins (c), transcription factors (d) and pluripotency genes (e) was measured at different time points of differentiation protocol. Dashed and continuous lines show unedited and edited iPSC-HLC organoids, respectively. Black bar indicates the level of expression of the respective gene in primary OTCD hepatocytes from the same patient. Expression levels were normalized to endogenous gene (PPIA). Technical replicates n = 2.
Figure 6
Figure 6
Albumin secretion and 15N incorporation into urea. (a) Albumin secreted by unedited and edited iPSC hepatocyte-like cell (iPSC-HLC) was measured at days 20 and 26 of hepatic differentiation. Averages and errors are shown as means and standard deviation. Mann–Whitney U test was used for statistical analysis. Biological replicates n = 3. Ns: Not significant. (b) Incorporation of labelled 15N into urea, which indicates the urea produced through the urea cycle, by unedited and edited iPSC-HLC, was quantified with mass spectrometry at days 20 and 26 of hepatic differentiation. Biological replicates n = 6. Mann–Whitney U test was used for statistical analyses. Ns: Not significant, p > 0.05, *: p ≤ 0.05, **: p ≤ 0.01.

References

    1. Matsumoto S., Haberle J., Kido J., Mitsubuchi H., Endo F., Nakamura K. Urea cycle disorders-update. J. Hum. Genet. 2019;64:833–847. doi: 10.1038/s10038-019-0614-4. - DOI - PubMed
    1. Summar M.L., Koelker S., Freedenberg D., Le Mons C., Haberle J., Lee H.S., Kirmse B., European Registry. Network for Intoxication Type Metabolic Diseases. Members of the Urea Cycle Disorders Consortium The incidence of urea cycle disorders. Mol. Genet. Metab. 2013;110:179–180. doi: 10.1016/j.ymgme.2013.07.008. - DOI - PMC - PubMed
    1. Strom S.C., Fisher R.A., Rubinstein W.S., Barranger J.A., Towbin R.B., Charron M., Mieles L., Pisarov L.A., Dorko K., Thompson M.T., et al. Transplantation of human hepatocytes. Transplant. Proc. 1997;29:2103–2106. doi: 10.1016/S0041-1345(97)00252-2. - DOI - PubMed
    1. Stephenne X., Najimi M., Smets F., Reding R., de Ville de Goyet J., Sokal E.M. Cryopreserved liver cell transplantation controls ornithine transcarbamylase deficient patient while awaiting liver transplantation. Am. J. Transplant. 2005;5:2058–2061. doi: 10.1111/j.1600-6143.2005.00935.x. - DOI - PubMed
    1. Meyburg J., Das A.M., Hoerster F., Lindner M., Kriegbaum H., Engelmann G., Schmidt J., Ott M., Pettenazzo A., Luecke T., et al. One liver for four children: First clinical series of liver cell transplantation for severe neonatal urea cycle defects. Transplantation. 2009;87:636–641. doi: 10.1097/TP.0b013e318199936a. - DOI - PubMed

MeSH terms

LinkOut - more resources