. 2021 Jan 26;12(2):162.
doi: 10.3390/genes12020162.

The Role of Csmd1 during Mammary Gland Development

Affiliations

The Role of Csmd1 during Mammary Gland Development

Samuel J Burgess et al. Genes (Basel). .

Abstract

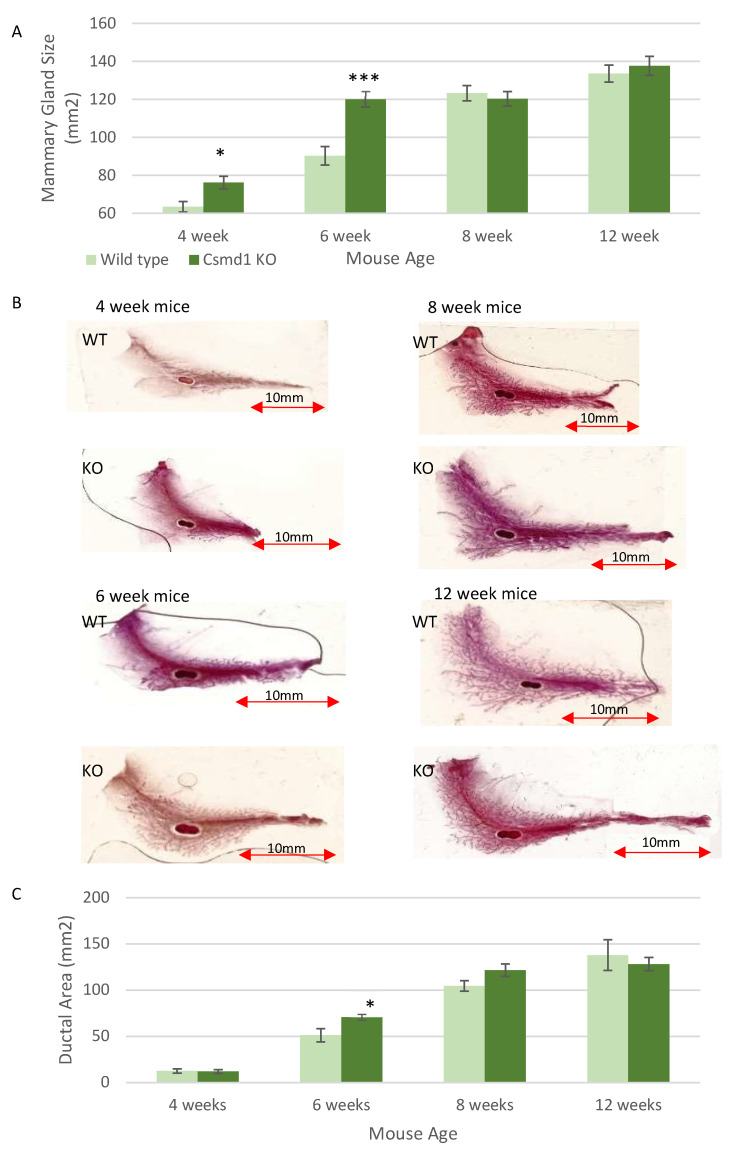
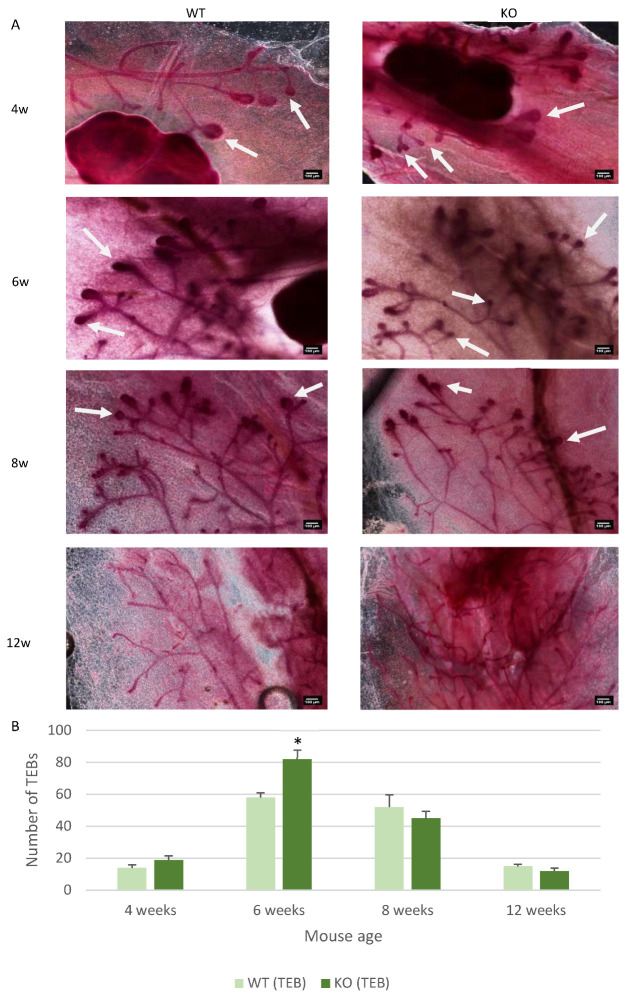
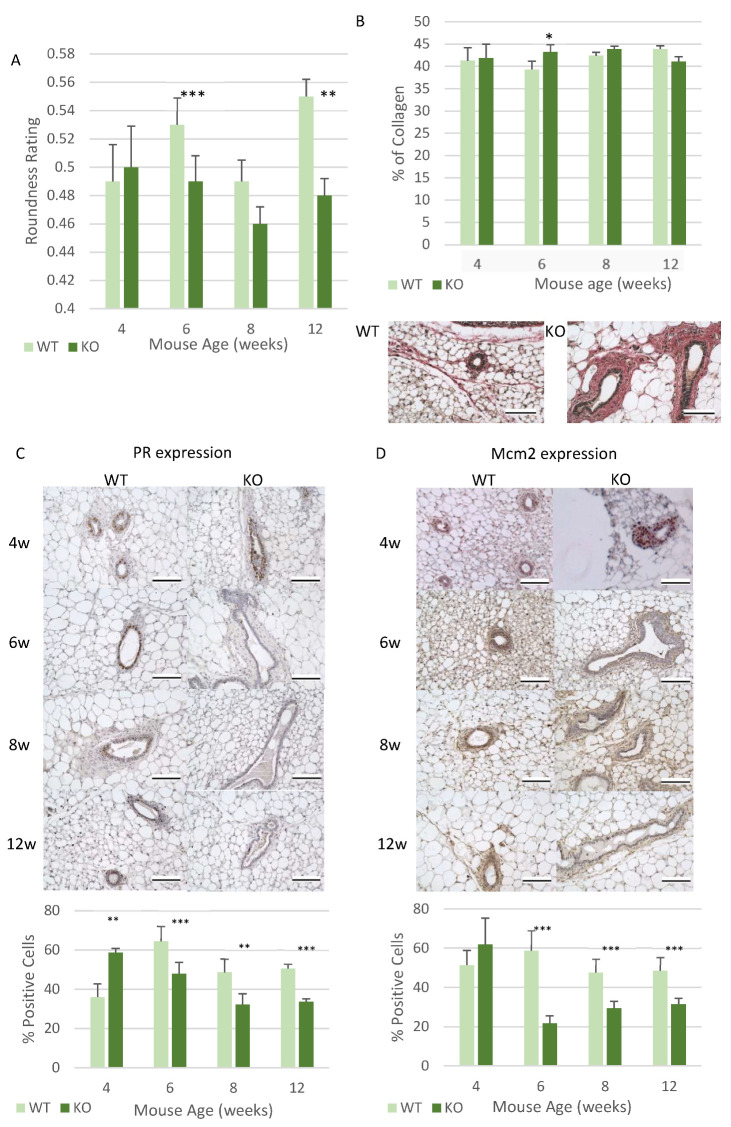
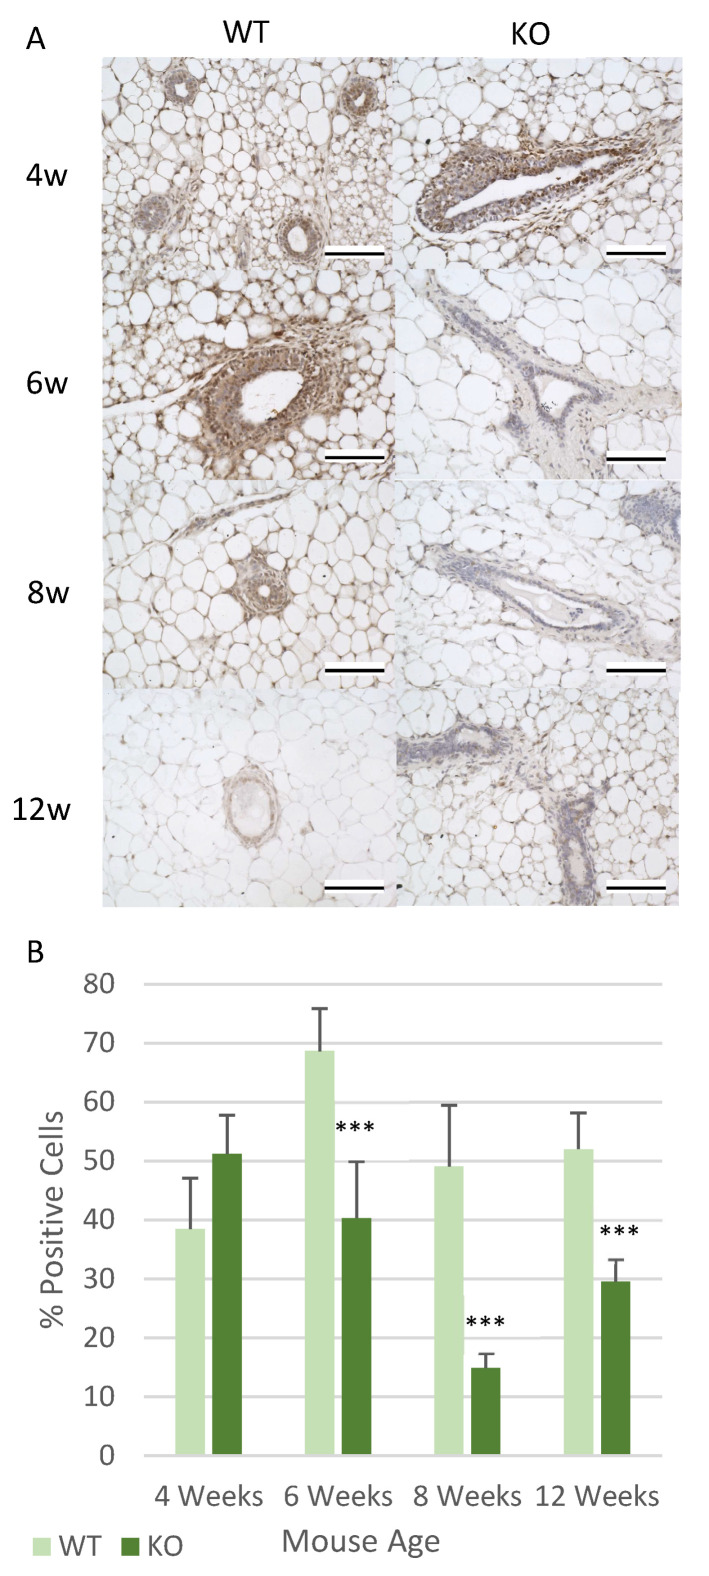
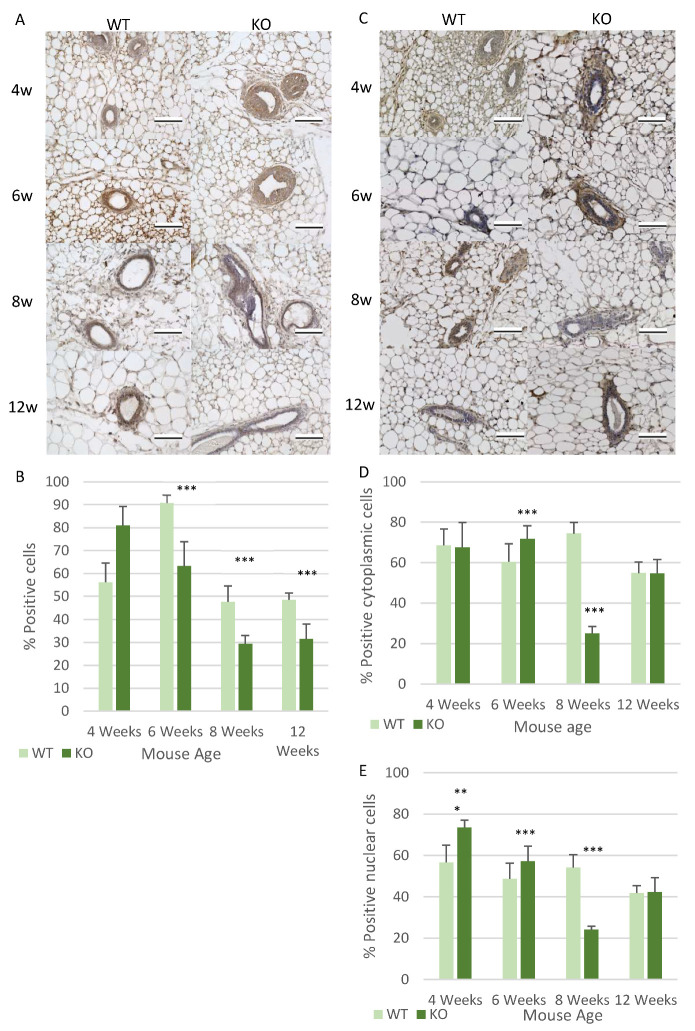
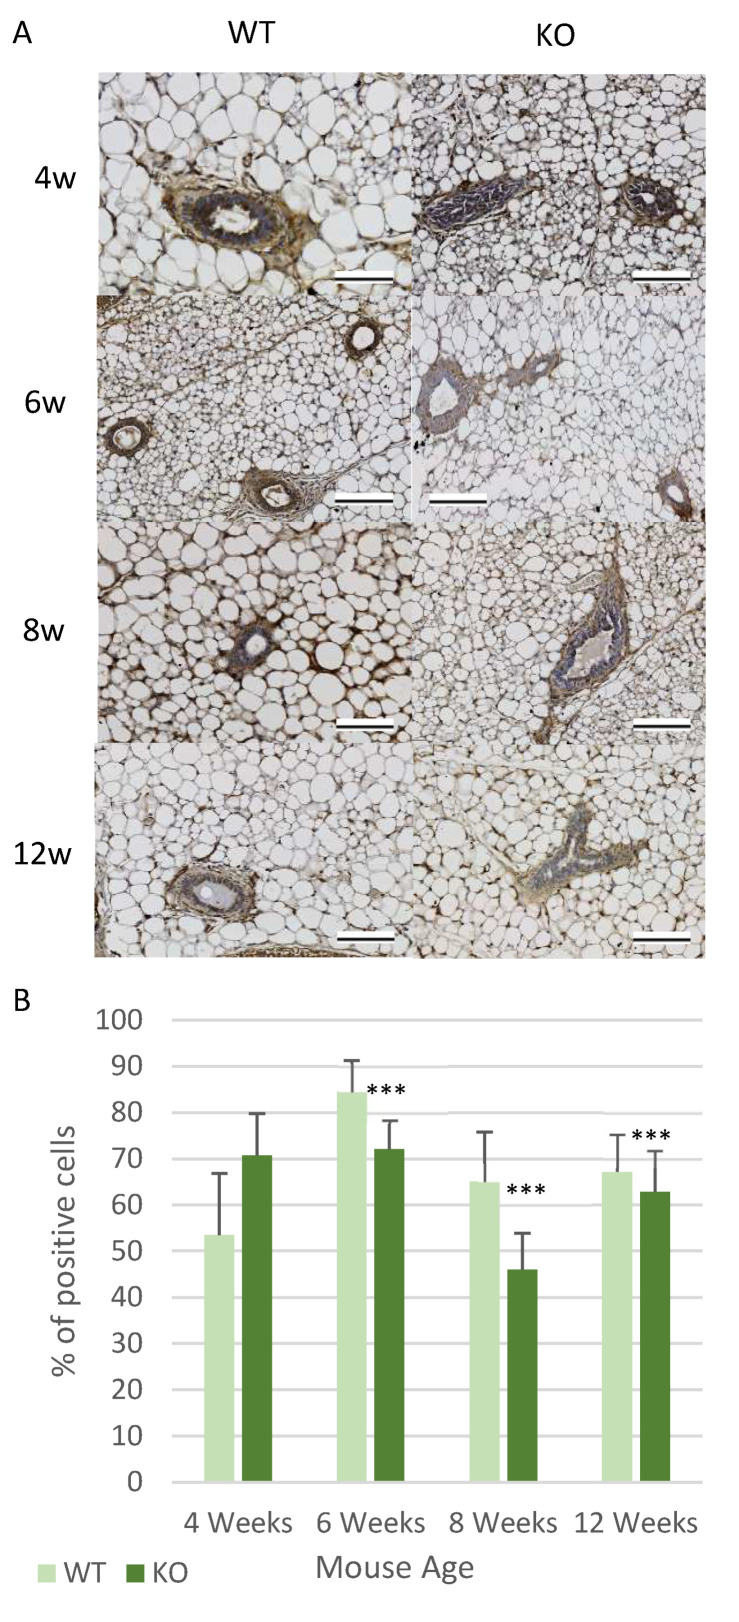
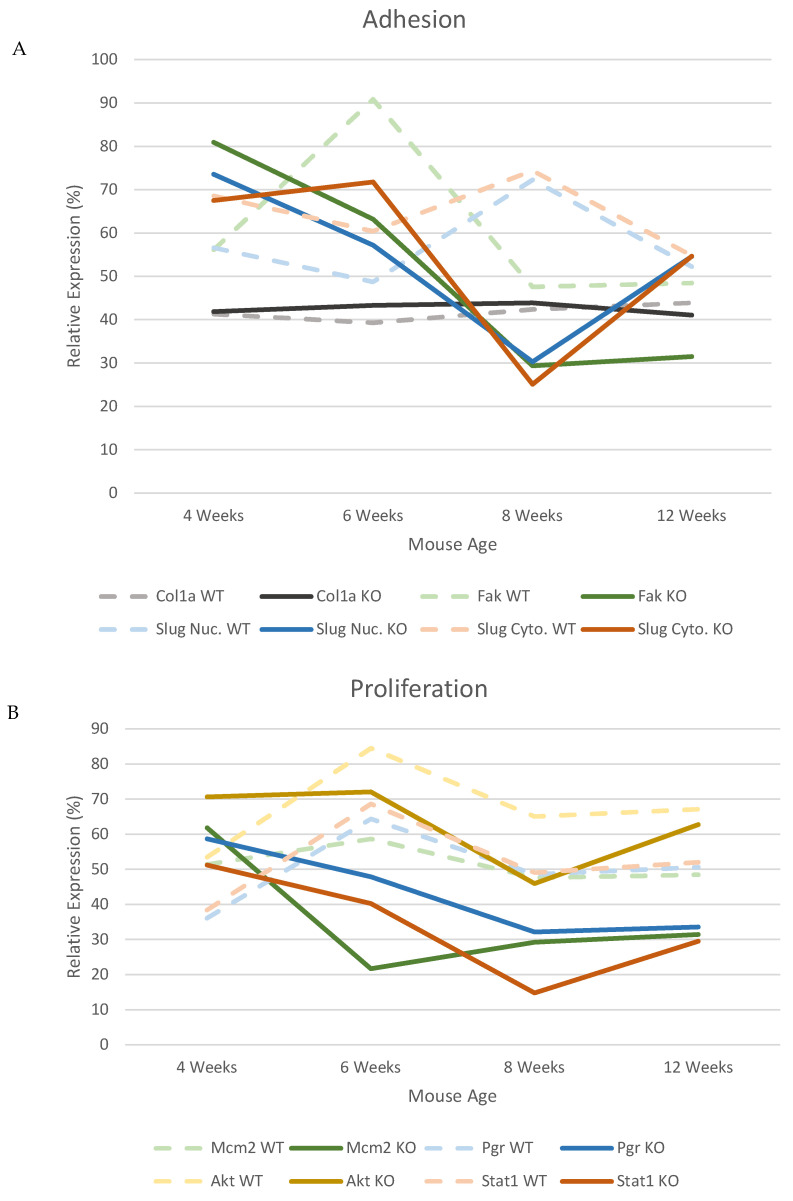
The Cub Sushi Multiple Domains-1 (CSMD1) protein is a tumour suppressor which has been shown to play a role in regulating human mammary duct development in vitro. CSMD1 knockdown in vitro demonstrated increased cell proliferation, invasion and motility. However, the role of Csmd1 in vivo is poorly characterised when it comes to ductal development and is therefore an area which warrants further exploration. In this study a Csmd1 knockout (KO) mouse model was used to identify the role of Csmd1 in regulating mammary gland development during puberty. Changes in duct development and protein expression patterns were analysed by immunohistochemistry. This study identified increased ductal development during the early stages of puberty in the KO mice, characterised by increased ductal area and terminal end bud number at 6 weeks. Furthermore, increased expression of various proteins (Stat1, Fak, Akt, Slug/Snail and Progesterone receptor) was shown at 4 weeks in the KO mice, followed by lower expression levels from 6 weeks in the KO mice compared to the wild type mice. This study identifies a novel role for Csmd1 in mammary gland development, with Csmd1 KO causing significantly more rapid mammary gland development, suggesting an earlier adult mammary gland formation.

Keywords: Akt; Csmd1; Fak; Stat1; epithelial mesenchymal transition; extracellular matrix; mammary gland development; terminal end bud.


Conflict of interest statement

The authors declare no conflict of interest. The funders had no role in the design of the study; in the collection, analyses, or interpretation of data; in the writing of the manuscript, or in the decision to publish the results.

Figures

Figure A1
Figure A1
Information regarding the breeding structure used to generate the mouse cohort used in this study (A), along with a PCR gel electrophoresis image showing how the mice genotypes were identified (B). To generate the mouse the cohort initially a Csmd1 KO mouse embryos were implanted into a pregnant WT mouse, this generated the F1 generation consisting of both WT and KO mice. These mice were then breed with further WT mice (C57BL/6). This generated an F2 generation consisting of either heterozygotes (Hets) or WT mice. The Hets were then breed with each other to generate both KO and WT mice. The KO mice were then further breed with each other to obtain the full KO cohort, with mice being harvested at 4, 6, 8 and 12 weeks. The WT mice breed throughout this study were also harvested at the same time points.
Figure A2
Figure A2
Image showing examples of the negative and positive controls used in this study. The negative control was an antibody free control to determine any background staining caused by the kit used. The positive control was performed on tissue known to express the protein in question. These tests were performed on the same tissue types for each run performed, with this tissue being full adult, >16 weeks of age, wild type mammary glands.
Figure 1
Figure 1
(A) Schematic of mammary gland development over the course of puberty (B) Terminal End Bud (TEB) structure, identifying the structure and types of cells present.
Figure 2
Figure 2
Loss of Csmd1 leads to increased mammary gland size and ductal growth. (A) Graph showing the changes in mammary gland size between the WT and Csmd1 KO mice. The area of the abdominal fat pad was measured in each mouse (mm2), showing significant changes at 4 and 6 week (* p < 0.05 and *** p < 0.001). The numbers of animals for each time point included 4-week-old mice (n = 12: WT; n = 14 KO), 6-week-old mice (n = 5: WT; n = 11 KO), 8-week-old mice (n = 7: WT; n = 8 KO), 12-week-old mice (n = 7: WT; n = 9 KO). (B) Whole mount stained mammary glands at all ages (4, 6, 8, 12 weeks) from both WT and KO mice, scale bar 10 mm. The images show the ductal trees within the mammary gland fat pad. (C) Graph showing the differences in ductal tree area between the WT and KO mice, (mm2), with significant differences noted at 6 weeks (* p < 0.05). The numbers of animals for each time point included 4-week-old mice (n = 12: WT; n = 10 KO), 6-week-old mice (n = 5: WT; n = 10 KO), 8-week-old mice (n = 7: WT; n = 7 KO), 12-week-old mice (n = 7: WT; n = 7 KO).
Figure 3
Figure 3
Csmd1 KO leads to increased terminal end bud number during duct development. (A) Images of the whole mount stained mammary glands taken at x4 objective. The terminal end buds are identified in the images by the white arrows and the scale is 100 µm. (B) Graph depicting the changes in terminal end bud number between the WT and KO mice, changes were observed at 6 weeks of age (* p < 0.05). The numbers of animals for each time point included 4-week-old mice (n = 12: WT; n = 10 KO), 6-week-old mice (n = 5: WT; n = 10 KO), 8-week-old mice (n = 7: WT; n = 7 KO), 12-week-old mice (n = 7: WT; n = 7 KO).
Figure 4
Figure 4
Loss of Csmd1 is able to promote changes in ductal morphology and development factors. (A) Graph showing changes in duct roundness, the lumen of the ducts were measured and then analysed using ImageJ software. The roundness rating is between 0 and 1, with 1 being a perfect circle (** p < 0.01 and *** p < 0.001). The numbers of animals for each time point included 4-week-old mice (n = 6 WT; n = 6 KO), 6-week-old mice (n = 8 WT; n = 7 KO), 8-week-old mice (n = 7 WT; n = 7 KO), 12-week-old mice (n = 7 WT; n = 7 KO). (B) Analysis of the Picro-Sirus Red staining, which is used to stain collagen red. The staining is shown in the images below the graph which depicts ducts at 6 weeks of age in the WT and KO mice, with the red collagen staining located around each duct. The graph shows the percentage of collagen surrounding each duct, which was calculated using ImageJ (* p < 0.05) (n = 6 WT; n = 6 KO), 6-week-old mice (n = 8 WT; n = 7 KO), 8-week-old mice (n = 7 WT; n = 7 KO), 12-week-old mice (n = 7 WT; n = 7 KO) (C) The analysis of progesterone receptor (PR) expression, the images show respective examples of the ducts at each time point in both the WT and KO mice. The graph highlights the percentage of cells which positively express PR (** p < 0.01 and *** p < 0.001). The numbers of animals for each time point included (n = 6 WT; n = 6 KO), 6-week-old mice (n = 8 WT; n = 7 KO), 8-week-old mice (n = 7 WT; n = 7 KO), 12-week-old mice (n = 7 WT; n = 7 KO). (D) Analysis of the level of proliferation occurring in each duct in the WT and KO mice. The images show proliferation in the ducts at all ages in both the WT and KO mice, with the graph showing number of cells actively proliferating (*** p < 0.001). The numbers of animals for each time point included 4-week-old mice (n = 6 WT; n = 6 KO), 6-week-old mice (n = 8 WT; n = 7 KO), 8-week-old mice (n = 7 WT; n = 7 KO), 12-week-old mice (n = 7 WT; n = 7 KO). All images taken using an x40 objective, with all scale bars 100 µm.
Figure 5
Figure 5
Changes in Stat1 expression are generated by Csmd1 KO. (A) Images showing the expression of Stat1 within the mammary glands ducts at all time points in both the WT and KO mice, stained using IHC (B) Graph highlighting the average percentage of cells positively expressing Stat1 between the WT and KO ducts by counting the percentage of positive cells per duct (*** p < 0.001). The numbers of animals for each time point included (n = 6 WT; n = 6 KO), 6-week-old mice (n = 8 WT; n = 7 KO), 8-week-old mice (n = 7 WT; n = 7 KO), 12-week-old mice (n = 7 WT; n = 7 KO). All images were taken using an x40 objective, with all scale bars 100 µm.
Figure 6
Figure 6
Csmd1 KO causes changes in the expression of cell adhesion associated proteins. (A) Images of Fak expression within the ducts of the mammary glands at all ages in both the WT and KO mice. (B) Graph highlighting the changes in Fak expression in each duct at the various ages between the WT and KO mice, with the average expression of Fak per duct being shown (*** p < 0.001). The numbers of animals for each time point (n = 6 WT; n = 6 KO), 6-week-old mice (n = 8 WT; n = 7 KO), 8-week-old mice (n = 7 WT; n = 7 KO), 12-week-old mice (n = 7 WT; n = 7 KO) (C) Images of Slug and Snail expression within the ducts of the mammary glands at all ages in both the WT and KO mice. (D) Graph highlighting the changes in cytoplasmic levels of Slug and Snail expression at the various ages between the WT and KO mice, with the average expression of Slug and Snail per duct being shown (*** p < 0.001). (E) Graph highlighting the changes in nuclear Slug and Snail expression at the various ages between the WT and KO mice, with the average expression of Fak per duct being shown (*** p < 0.001). The numbers of animals for each time point included (n = 6 WT; n = 6 KO), 6-week-old mice (n = 8 WT; n = 7 KO), 8-week-old mice (n = 7 WT; n = 7 KO), 12-week-old mice (n = 7 WT; n = 7 KO). All images were taken using an x40 objective, with all scale bars 100 µm.
Figure 7
Figure 7
Loss of Csmd1 causing changes in the expression patterns of Pi3k/Akt signaling. (A,B) Akt expression analysis. (A) Images showing the amount of positive Akt expression in the mammary gland ducts at all ages in the WT and KO mice, using IHC staining. (B) The graph shows the average percentage of cells which are positively expressing Akt in each duct (*** p < 0.001). The numbers of animals for each time point included (n = 6 WT; n = 6 KO), 6-week-old mice (n = 8 WT; n = 7 KO), 8-week-old mice (n = 7 WT; n = 7 KO), 12-week-old mice (n = 7 WT; n = 7 KO). All images were taken using an x40 objective, with all scale bars 100 µm.
Figure 8
Figure 8
The expression patterns of the proteins analysed show alternative peaks of expression in the Csmd1 KO mice compared to the WT. The expression levels across all time points (4–12 weeks) are shown to demonstrate how the specific expression of the proteins changes over puberty and also how the patterns vary between the WT and KO mice. (A) Graph showing the proteins associated with regulating cell adhesion. (B) Graph showing the proteins associated with regulating cell proliferation. In both graphs clear alternative peaks can be observed between the WT, peak of expression commonly at 6 weeks, and the KO mice, peak of expression commonly at 4 weeks.

References

    1. Sun P.C., Uppaluri R., Schmidt A.P., Pashia M.E., Quant E.C., Sunwoo J.B., Gollin S.M., Scholnick S.B. Transcript Map of the 8p23 Putative Tumor Suppressor Region. Genomics. 2001;75:17–26. doi: 10.1006/geno.2001.6587. - DOI - PubMed
    1. Toomes C., Jackson A., Maguire K., Wood J., Gollin S., Ishwad C., Paterson I., Prime S., Parkinson K., Bell S., et al. The Presence of Multiple Regions of Homozygous Deletion at the CSMD1 Locus in Oral Squamous Cell Carcinoma Question the Role of CSMD1 in Head and Neck Carcinogenesis. Genes. Chromosomes Cancer. 2003;37:132–140. doi: 10.1002/gcc.10191. - DOI - PubMed
    1. Bork P., Beckmann G. The CUB Domain: A Widespread Module in Developmentally Regulated Proteins. J. Mol. Biol. 1993;231:539–545. doi: 10.1006/jmbi.1993.1305. - DOI - PubMed
    1. Lee H.X., Mendes F.A., Plouhinec J.-L., De Robertis E.M. Enzymatic Regulation of Pattern: BMP4 Binds CUB Domains of Tolloids and Inhibits Proteinase Activity. Genes Dev. 2009;23:2551–2562. doi: 10.1101/gad.1839309. - DOI - PMC - PubMed
    1. Gaboriaud C., Gregory-Pauron L., Teillet F., Thielens N.M., Bally I., Arlaud G.J. Structure and Properties of the Ca2+-Binding CUB Domain, a Widespread Ligand-Recognition Unit Involved in Major Biological Functions. Biochem. J. 2011;439:185–193. doi: 10.1042/BJ20111027. - DOI - PubMed

Publication types

LinkOut - more resources