

doi: 10.1161/CIRCRESAHA.120.316666.
Epub 2021 Feb 3.
BCL11B Regulates Arterial Stiffness and Related Target Organ Damage
Affiliations
- PMID: 33530702
- PMCID: PMC7969164
- DOI: 10.1161/CIRCRESAHA.120.316666
Item in Clipboard
BCL11B Regulates Arterial Stiffness and Related Target Organ Damage
Circ Res.
.
Abstract
[Figure: see text].
Keywords: actins; blood pressure; calcineurin; phosphorylation; vascular smooth muscle; vascular stiffness.
Figures
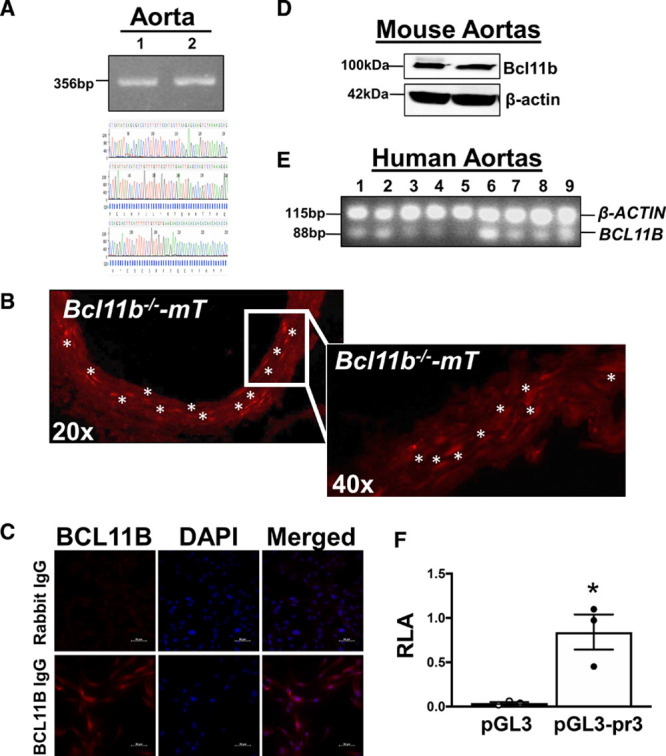
BCL11B (B-cell leukemia 11b) is expressed in vascular smooth muscle (VSM).
A, A conserved region within the 3′-BCL11B genetic locus with SNPs highly associated with arterial stiffness is present in murine aortas and identified as AI060616 (National Center for Biotechnology Information [NCBI]). AI060616 356 bp nucleotide sequence was confirmed by sequencing polymerase chain reaction (PCR) products from aortic DNA obtained from 2 C57Bl/6J mice (1 and 2). Sequencing chromatogram tracing shown in lower panel. B, Representative fluorescent images of aortic sections, taken at 20× and 40× magnification, indicating Bcl11b’s localization in VSM. Red fluorescence indicates tomato (mT) expression in lieu of Bcl11b, upon tamoxifen-induced Bcl11b removal and mT induction in 3 ER-Cre-Bcl11bflox/flox-mTomato mice. Asterisks indicate clusters of VSM cells with high mT fluorescence intensity. C, Representative images (40× magnification) of human primary aortic smooth muscle cell immunostaining with anti-BCL11B; rabbit IgG serves as negative control for antibody specificity. DAPI indicates nuclei. n=3 replicates with 3 different cell lines, as described in materials and methods. D, Western blot on murine aortas confirmed Bcl11b protein expression, with a band of expected MW 100–120 kDa. β-actin serves as loading control. Each lane represents one mouse. E, Image of 1% agarose gel electrophoresis of qRT-PCR Taqman products indicates BCL11B mRNA expression in human aortas (n=9). Each lane represents one human subject. β-ACTIN used as endogenous housekeeping gene in multiplexed assay. F, Relative luciferase activity (RLA), expressed as a ratio with Renilla luciferase, in VSM cells transfected with luciferase reporter plasmids expressing an empty plasmid (pGL3) or Bcl11b promoter (pGL3-pr3). Results represent 3 replicate experiments. *P=2.0×10⁻² by unpaired t test.
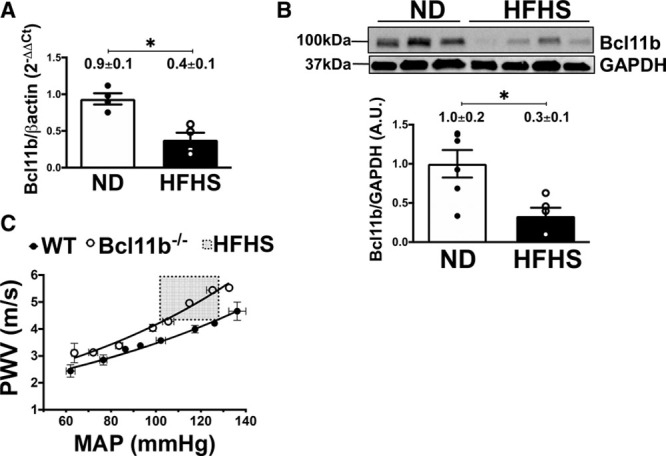
BCL11B (B-cell leukemia 11b) downregulation is associated with increased arterial stiffness.
A, Bcl11b mRNA levels measured by quantitative real-time polymerase chain reaction (PCR) (2−ΔΔCt) are decreased in aortas of high fat, high-sucrose (HFHS)-fed obese mice, a model of arterial stiffness, compared with normal diet (ND)-fed mice. n=4 mice in each group; *P=3.0×10⁻² by Mann-Whitney nonparametric test. B, Representative Western Blot of Bcl11b protein expression in aortic homogenates of ND- and HFHS-fed mice. Each lane represents one mouse. GAPDH serves as loading control. Bar graph summarizes protein band quantitation (ratio of Bcl11b over GAPDH band intensities), each dot represents one mouse. n=6 mice in each group; *P=1.0×10⁻² by unpaired t test. C, Pulse wave velocity (PWV, m/s), the in vivo index of arterial stiffness, measured over a range of mean arterial pressures (MAP, mm Hg), is increased in 10-month old mice lacking Bcl11b compared with wild-type (WT) littermates. n=4 mice in each group; area under the curve (AUC): 260.3±4.7 m/s×mm Hg in WT vs 285.6±2.8 m/s×mm Hg in Bcl11b−/−; *P=6.0×10⁻³ by unpaired t test for AUC. Shadowed box indicates PWV values (4–6 m/s) for HFHS-fed mice in comparable ranges of MAP (100–130 mm Hg), adapted from reference.
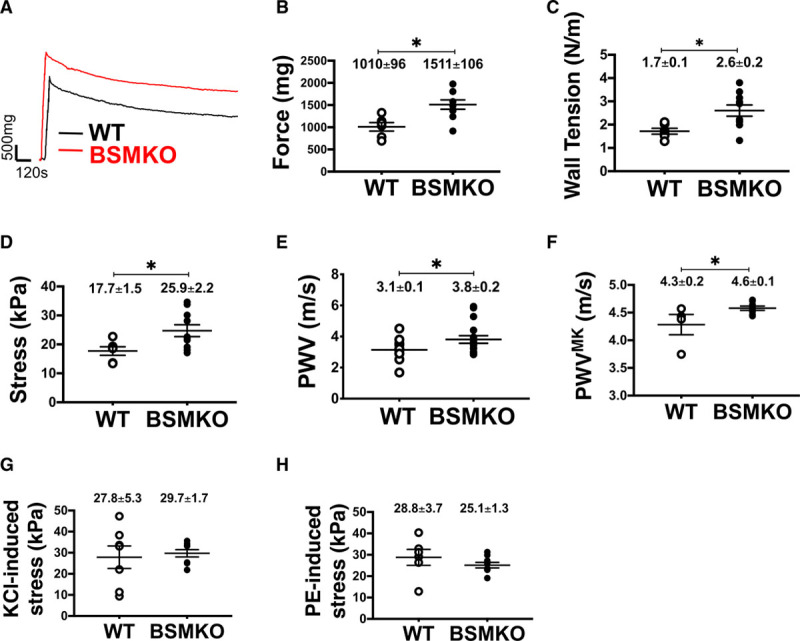
Vascular smooth muscle (VSM) bcl11b (B-cell leukemia 11b) deletion increases contractile force of aortic rings and arterial stiffness.
A, Representative force tracings recorded ex vivo in organ baths in aortic rings from wild-type (WT; n=5) and tamoxifen-inducible VSM-specific Bcl11b null mice (BSMKO; n=7). Scale on graph. Scatter plots indicate individual values for (B) force (mg); *P=6.0×10⁻³; (C) wall tension (N/m), *P=2.0×10⁻²; (D) stress (kPa), *P=3.0×10⁻²; (F) stiffness, expressed as pulse wave velocity (PWV) calculated via the Moens-Kortweg equation (PWVMK), *P=4.0×10⁻²; (G) KCl-, P=7.5×10⁻¹; and (H) phenylephrine (PE)-induced stress (kPa), P=2.9×10⁻¹. Each dot represents an aortic ring from one mouse; mean±SEM on graphs. E, Pulse wave velocity (m/s) measured in vivo by Doppler echocardiography in WT (n=14) and BSMKO (n=17) mice. *P=4.0×10⁻² by unpaired t test. Details in Methods.
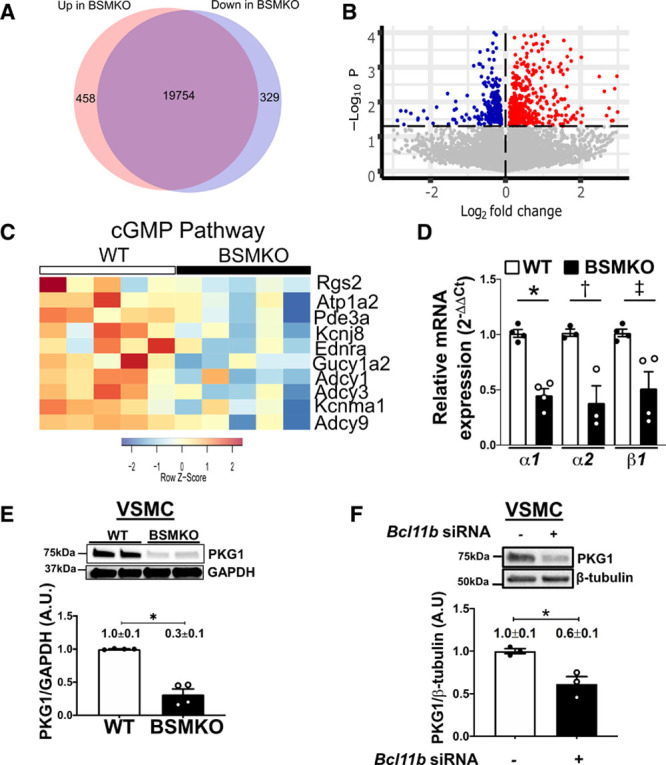
cGMP (cyclic guanosine monophosphate)-protein kinase G (PKG)-signaling pathway is down-regulated in aortas with vascular smooth muscle (VSM) bcl11b (B-cell leukemia 11b) deletion.
A, Venn diagram of genes differentially up- and down-regulated in aortas of tamoxifen-inducible VSM-specific Bcl11b null mice (BSMKO; n=5) compared with wild-type (WT; n=5) mice assessed by RNA sequencing. B, Volcano plot of differentially up- (red) and down-(blue) regulated genes in aortas of BSMKO (n=5) compared with WT (n=5) mice. The horizontal line indicates a threshold of P=0.05. For a list of the top 40 differentially regulated genes see Figure IV in the Data Supplement . C, List of genes within the cGMP-PKG signaling pathway, the most significantly regulated signaling pathway in BSMKO aortas after Database for Annotation, Visualization and Integrated Discovery (DAVID) network analysis of differentially expressed genes (FDR, q=0.0094). For quantitation of individual genes see Figure VI in the Data Supplement . D, Quantitative RT-polymerase chain reaction (PCR) for guanylyl cyclase isoforms Gucy1a1, Gucy1a2, and Gucy1b1 in mRNA extracts from WT and BSMKO VSM cells; n=4 replicate experiments. Data expressed as fold change vs WT. *P=2.8×10⁻²; †P=1.6×10⁻²; ‡P=2.8×10⁻² by Mann-Whitney nonparametric test. E, Representative Western Blot for PKG1 (PKG, isoform 1) protein levels in VSM cells from WT and BSMKO mice. GAPDH used as loading control. Quantitation of 4 replicate experiments in graph. *P=3.0×10⁻² by Mann-Whitney nonparametric test. F, Representative Western Blot for PKG1 in mouse VSM cells treated with a scrambled siRNA (control) or a validated Bcl11b siRNA. Quantitation of 3 replicate experiments on 3 different mouse VSM cell lines in graph. β-tubulin used as loading control. *P=4.0×10⁻² by unpaired t test.
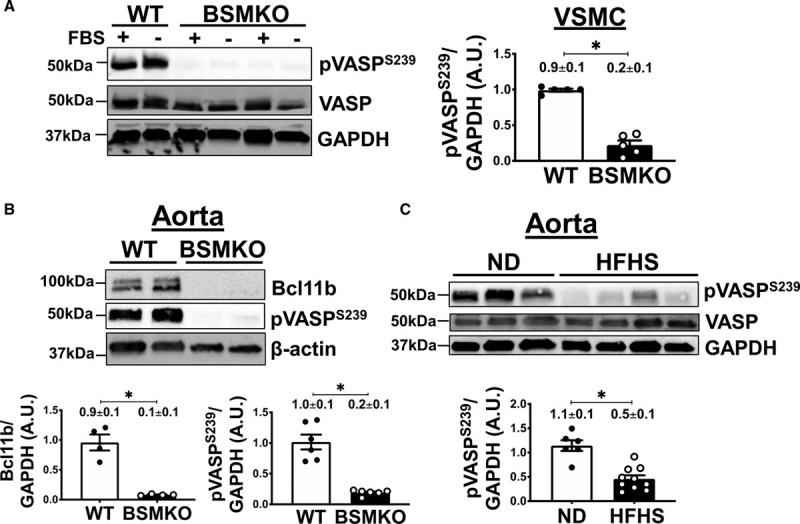
Vascular smooth muscle (VSM) bcl11b (B-cell leukemia 11b) deletion is associated with pVASPS239 (phosphorylated vasodilator-stimulated phosphoprotein) downregulation in aortas.
A, VASP (vasodilator-stimulated phosphoprotein) phosphorylation at serine 239 (pVASPS239) was significantly decreased in tamoxifen-inducible VSM-specific Bcl11b null mice (BSMKO) VSM cells, cultured with or without fetal bovine serum (FBS), compared with wild-type (WT) cells. Total VASP remained unchanged. GAPDH serves as loading control. n=5 replicate experiments. *P=8.0×10⁻³ by Mann-Whitney nonparametric test. B, Representative Western Blot images demonstrating pVASPS239 in aortas of BSMKO mice (n=6) compared with WT littermate controls (n=6). β-actin serves as loading control. Each lane represents one mouse. *P=5.3×10⁻⁵ by unpaired t test. C, pVASPS239 was significantly decreased in aortas of high fat, high sucrose (HFHS)-fed mice (n=10) compared with ND-fed controls (n=6; same aortic samples as in Figure 2B). Total VASP was similar in the two groups. Each lane represents one mouse. Band intensity quantitation summarized in graphs. *P=9.6×10⁻⁵ by unpaired t test.
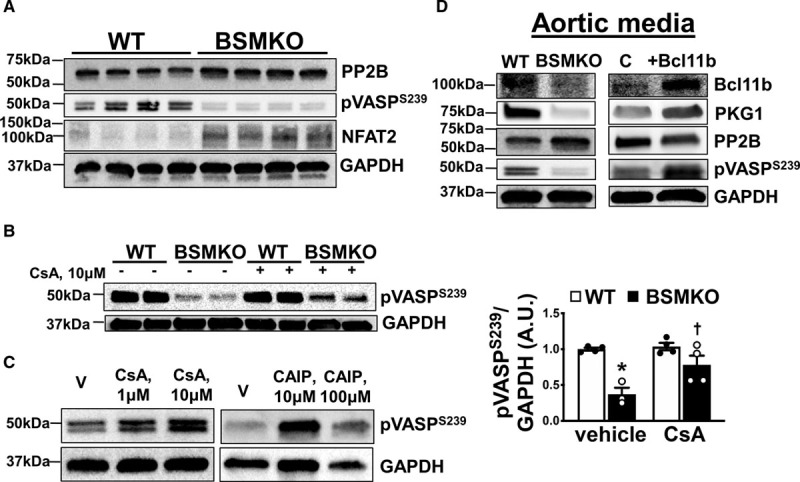
Calcineurin (PP2B) regulates VASPS239 phosphorylation after vascular smooth muscle (VSM) bcl11b (B-cell leukemia 11b) deletion.
A, Representative Western blot images demonstrating increased PP2B expression, increased NFAT2 and impaired VASP (vasodilator-stimulated phosphoprotein) phosphorylation at serine 239 (pVASPS239) in tamoxifen-inducible VSM-specific Bcl11b null mice (BSMKO) VSM cells compared with wild-type (WT) controls. GAPDH serves as loading control. Each lane represents a cell preparation from one mouse for a total of 4 replicates. B, Treatment of BSMKO VSM cells with 1 or 10 μmol/L cyclosporine A (CsA), a calcineurin inhibitor, or (C) a specific calcineurin autoinhibitory peptide (CAIP; 10 or 100 μmol/L) reversed pVASPS239 in BSMO cells towards WT levels, in a dose-dependent manner. V, vehicle control. Quantitation of band intensities in graph (n=3 replicate experiments). *P=1.5×10⁻² vs WT/vehicle; †P=3.0×10⁻² vs BSMKO/vehicle by 1-way ANOVA with Tukey multiple comparisons test. D, Western blots for Bcl11b, PKG1 (PKG, isoform 1), PP2B and pVASPS239 in WT and BSMKO aortic media (adventitia removed) without (left) or with (right) transient transfection with vehicle (lipofectamine C, control) or 20 μg Bcl11b plasmid. GAPDH serves as loading control.
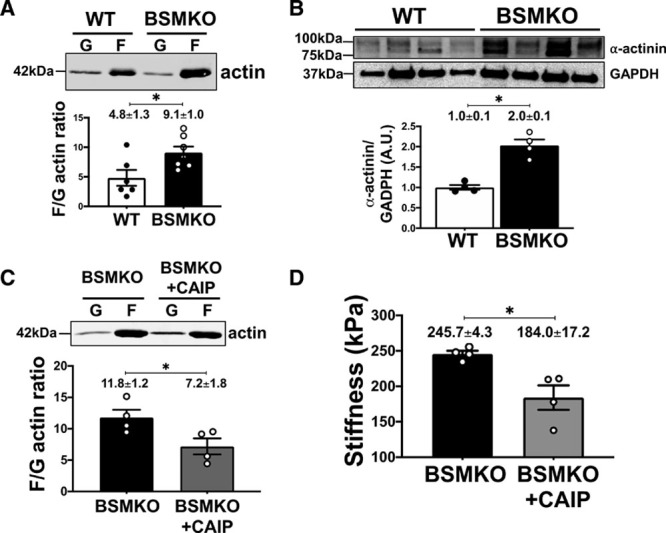
Vascular smooth muscle (VSM) bcl11b (B-cell leukemia 11b) regulates cytoskeletal actin polymerization and pVASPS239 (phosphorylated vasodilator-stimulated phosphoprotein).
A, Representative Western blot images of filamentous (F) and globular (G) actin in wild-type (WT; n=6) and tamoxifen-inducible VSM-specific Bcl11b null mice (BSMKO; n=7) aortas. (F/G) actin ratio quantitation in graph. *P=2.0×10⁻² by unpaired t test. B, Representative Western blot images of α-actinin in WT (n=4) and BSMKO (n=4) aortas. Each lane represents one mouse. GAPDH used as loading control. Quantitation in graph. *P=3.0×10⁻² by Mann-Whitney nonparametric test. C, Representative Western blot images of F and G actin in BSMKO aortas treated with vehicle (n=4) or CAIP (calcineurin autoinhibitory peptide; 10 μmol/L; n=4). F/G actin ratio quantitation in graph. *P=5.0×10⁻² by Mann-Whitney nonparametric test. D, Treatment of BSMKO aortas with CAIP (10 μmol/L) decreased stiffness, measured ex vivo on aortic rings in organ bath (n=4). *P=3.0×10⁻² by Mann-Whitney nonparametric test.
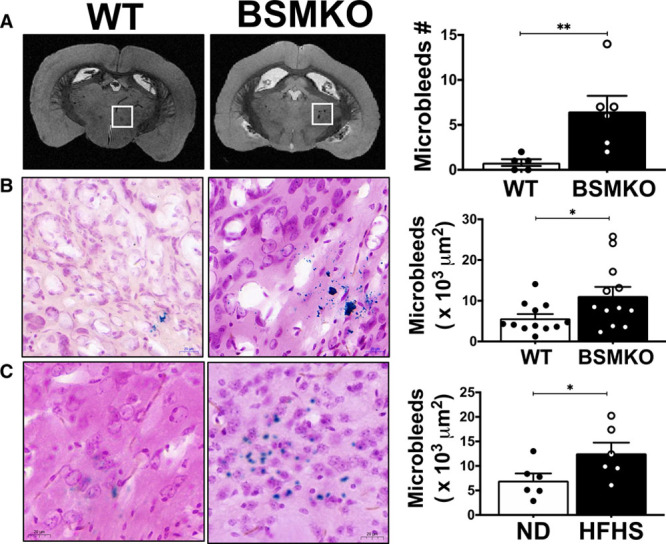
Cerebral microbleeds in wild-type (WT) vs tamoxifen-inducible VSM-specific Bcl11b null mice (BSMKO).
A, Representative magnetic resonance imaging (MRI) of whole brains from WT (n=5) and BSMKO mice (n=6). A microbleed-rich region is highlighted with the white box. Quantitation in graph. **P=1.0×10⁻² by unpaired t test. B, Representative histological staining of WT (n=12) and BSMKO (n=12) brain sections (40× magnification); areas stained in blue are indicative of cerebral microbleeds. Quantitation in graph (µm2). Each dot represents the average of at least 5 sections, corresponding to a cumulative thickness of 150 µm, for each mouse. *P=3.0×10⁻² by unpaired t test. C, Representative histological staining of cerebral microbleeds in normal diet (ND)- (n=6) and high fat, high sucrose (HFHS)-fed (n=6) mice. Quantitation in graph. *P=5.0×10⁻² by unpaired t test.
Comment in
-
Targeting Cell Stiffness: A Paradigm Shift in the Treatment of Aortic Stiffness.Circ Res. 2021 Mar 19;128(6):769-771. doi: 10.1161/CIRCRESAHA.121.318954. Epub 2021 Mar 18. Circ Res. 2021. PMID: 33734817 No abstract available.
References
-
- Virani SS, Alonso A, Benjamin EJ, Bittencourt MS, Callaway CW, Carson AP, Chamberlain AM, Chang AR, Cheng S, Delling FN, et al. Heart disease and stroke statistics—2020 update: a report from the American Heart Association. Circulation. 2020;141:e139–e596 - PubMed
-
- Willum-Hansen T, Staessen JA, Torp-Pedersen C, Rasmussen S, Thijs L, Ibsen H, Jeppesen J. Prognostic value of aortic pulse wave velocity as index of arterial stiffness in the general population. Circulation. 2006;113:664–670. doi: 10.1161/CIRCULATIONAHA.105.579342 - PubMed
-
- Najjar SS, Scuteri A, Shetty V, Wright JG, Muller DC, Fleg JL, Spurgeon HP, Ferrucci L, Lakatta EG. Pulse wave velocity is an independent predictor of the longitudinal increase in systolic blood pressure and of incident hypertension in the Baltimore Longitudinal Study of Aging. J Am Coll Cardiol. 2008;51:1377–1383. doi: 10.1016/j.jacc.2007.10.065 - PMC - PubMed
-
- AlGhatrif M, Strait JB, Morrell CH, Canepa M, Wright J, Elango P, Scuteri A, Najjar SS, Ferrucci L, Lakatta EG. Longitudinal trajectories of arterial stiffness and the role of blood pressure: the Baltimore Longitudinal Study of Aging. Hypertension. 2013;62:934–941. doi: 10.1161/HYPERTENSIONAHA.113.01445 - PMC - PubMed
Publication types
MeSH terms
Substances
Grants and funding
LinkOut - more resources
Full Text Sources
Other Literature Sources
Molecular Biology Databases
