

doi: 10.1161/CIRCRESAHA.120.317458.
Epub 2021 Feb 3.
Atherosclerosis Regression and Cholesterol Efflux in Hypertriglyceridemic Mice
Affiliations
- PMID: 33530703
- PMCID: PMC7979499
- DOI: 10.1161/CIRCRESAHA.120.317458
Item in Clipboard
Atherosclerosis Regression and Cholesterol Efflux in Hypertriglyceridemic Mice
Circ Res.
.
Abstract
[Figure: see text].
Keywords: atherosclerosis; cardiovascular disease; lipoprotein lipase; lipoproteins; macrophages; triglyceride.
Figures
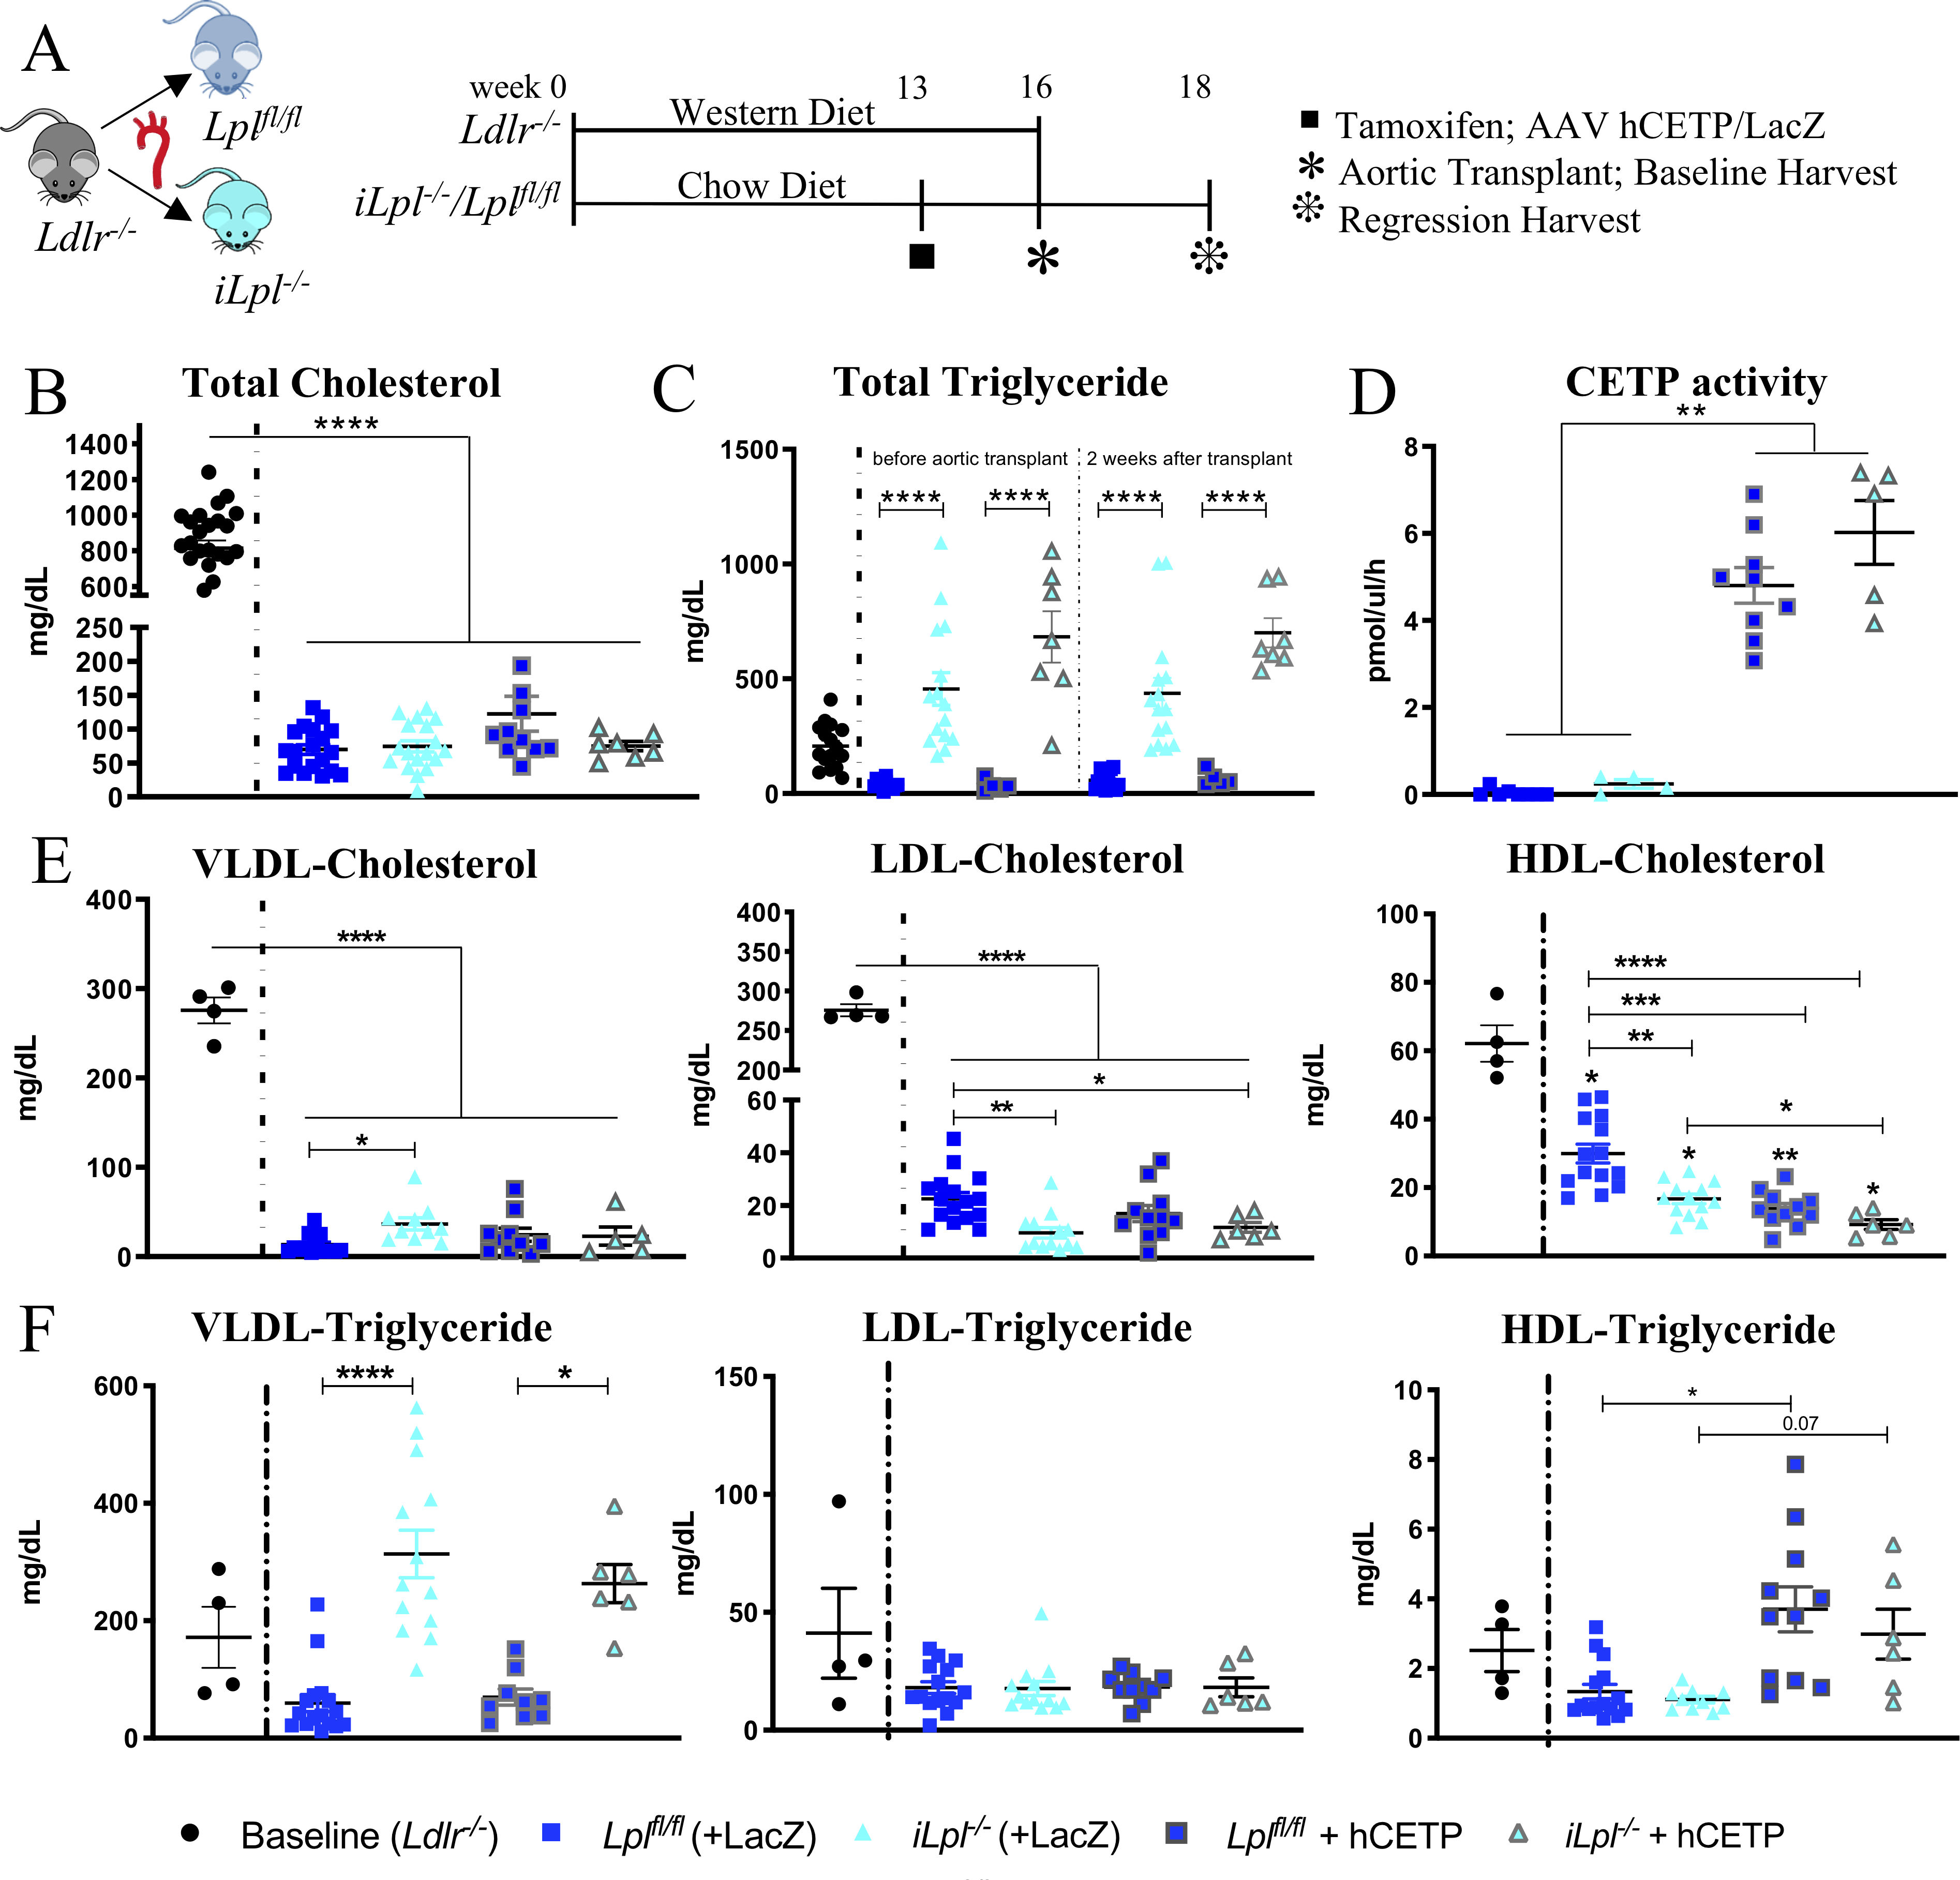
(A) Study Setup (B) Total plasma cholesterol levels at time of harvest (C) Total triglyceride (TG) levels in baseline and regression groups before and after the 2 weeks atherosclerosis regression period (D) CETP activity measured in circulation. Cholesterol (E) and triglyceride levels (F) of isolated lipoproteins. N= (B, C) Baseline 26, Lplfl/fl 19, Lpl−/− 18, Lplfl/fl +hCETP 11, Lpl−/− + hCETP 7; (D) Lplfl/fl 8, Lpl−/− 4, Lplfl/fl +hCETP 9, Lpl−/− + hCETP 5; (E, F) Baseline 4, Lplfl/fl 15, Lpl−/− 13, Lplfl/fl +hCETP 10, Lpl−/− + hCETP 6. Data represented as mean ± SEM, * P < 0.05, ** P<0.01, *** P < 0.001, **** P < 0.0001, 1-way ANOVA with Tukey’s multiple comparison test; HDL-C and HDL-TG Welch ANOVA with Games-Howell’s multiple comparison test; VLDL-TG & LDL-TG Kruskal-Wallis Test with Dunn’s multiple comparison test.
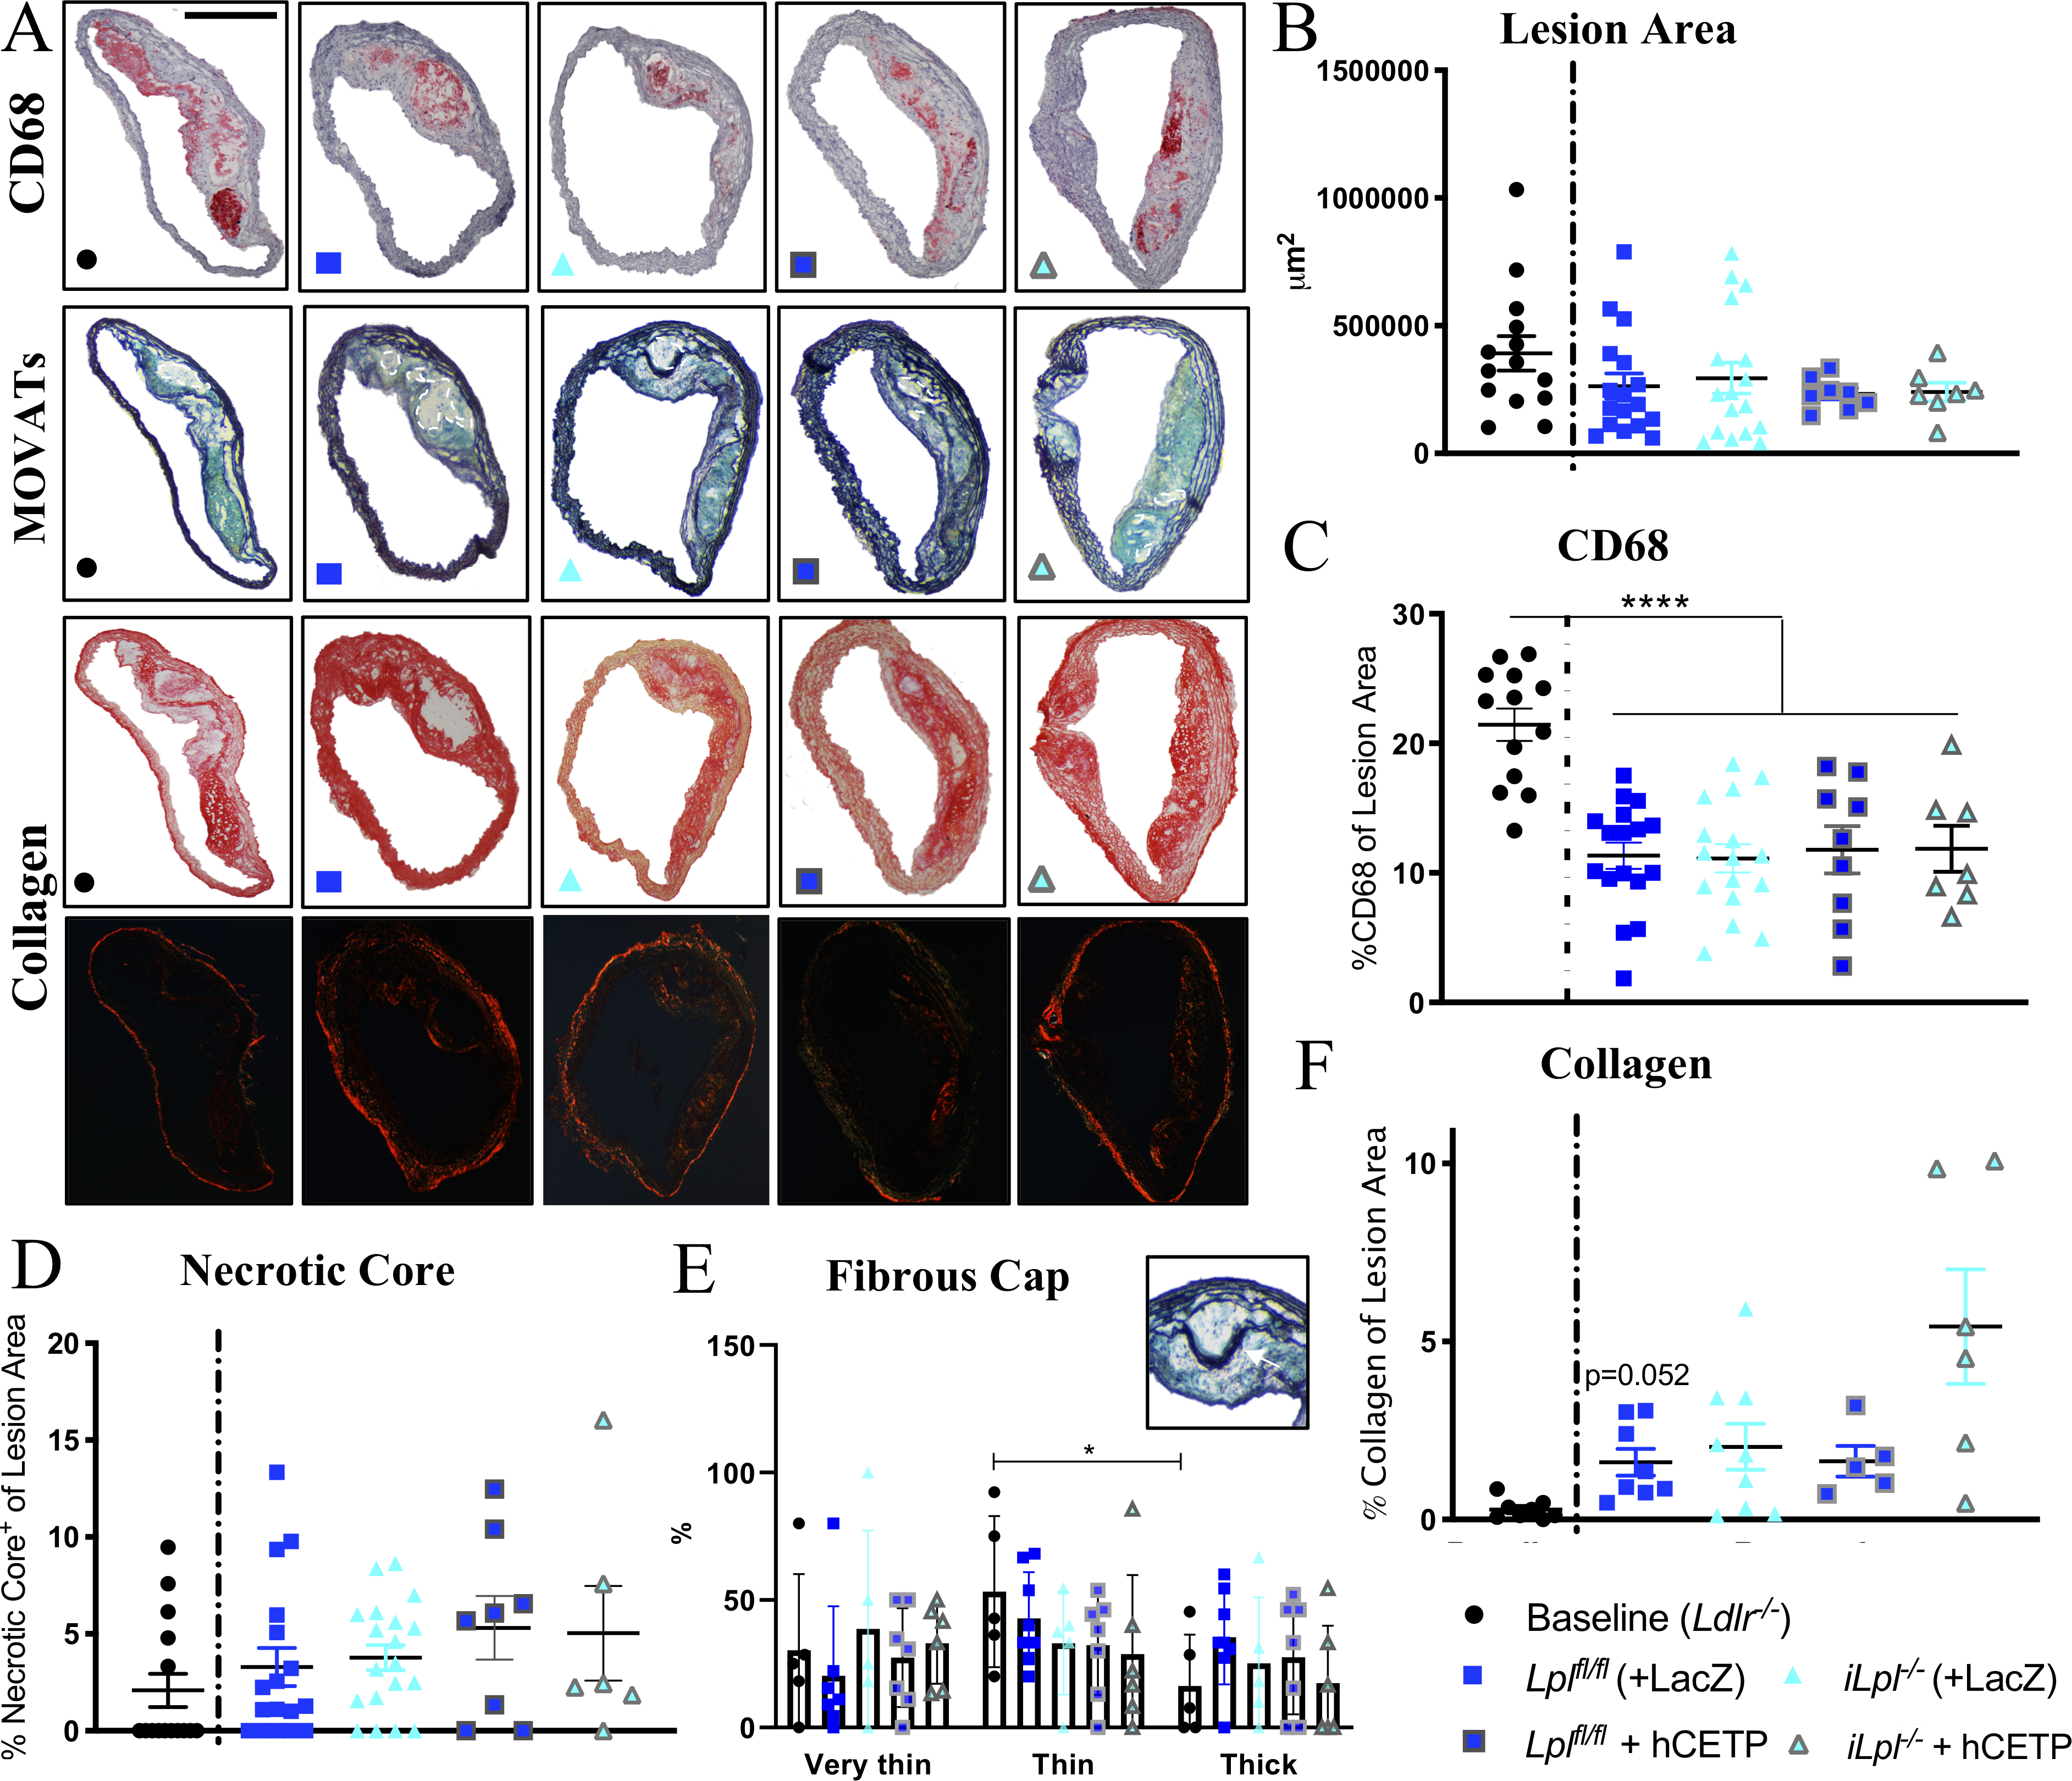
(A) Representative stainings; CD68, MOVATs, Picrosirius Red Staining (brightfield & polarized light); scale bar = 500 μm. Quantification of (B) Lesion Area (μm2) and (C) CD68 Area (% of Lesion Area ) (D) Necrotic Core (% of Lesion Area) (E) Fibrous Cap determined by number of layers above the Necrotic Core, Thick >10layers, Thin 5–10layers, Very Thin <5 layers; scale bar = 100 μm (F) Collagen (% of Lesion Area); N= (B, C, D) Baseline 15, Lplfl/fl 18, Lpl−/− 16, Lplfl/fl +hCETP 8, Lpl−/− + hCETP 6; (E) Baseline 5, Lplfl/fl 7, Lpl−/− 5, Lplfl/fl +hCETP 7, Lpl−/− + hCETP 6 (F) Baseline 8, Lplfl/fl 8, Lpl−/− 9, Lplfl/fl +hCETP 5, Lpl−/− + hCETP 6. Data represented as mean ± SEM, **** P < 0.0001, 1-way ANOVA with Tukey’s multiple comparison test; (E) 2-way ANOVA with Tukey’s multiple comparison test (F) Welch ANOVA with Games-Howell’s multiple comparison test.
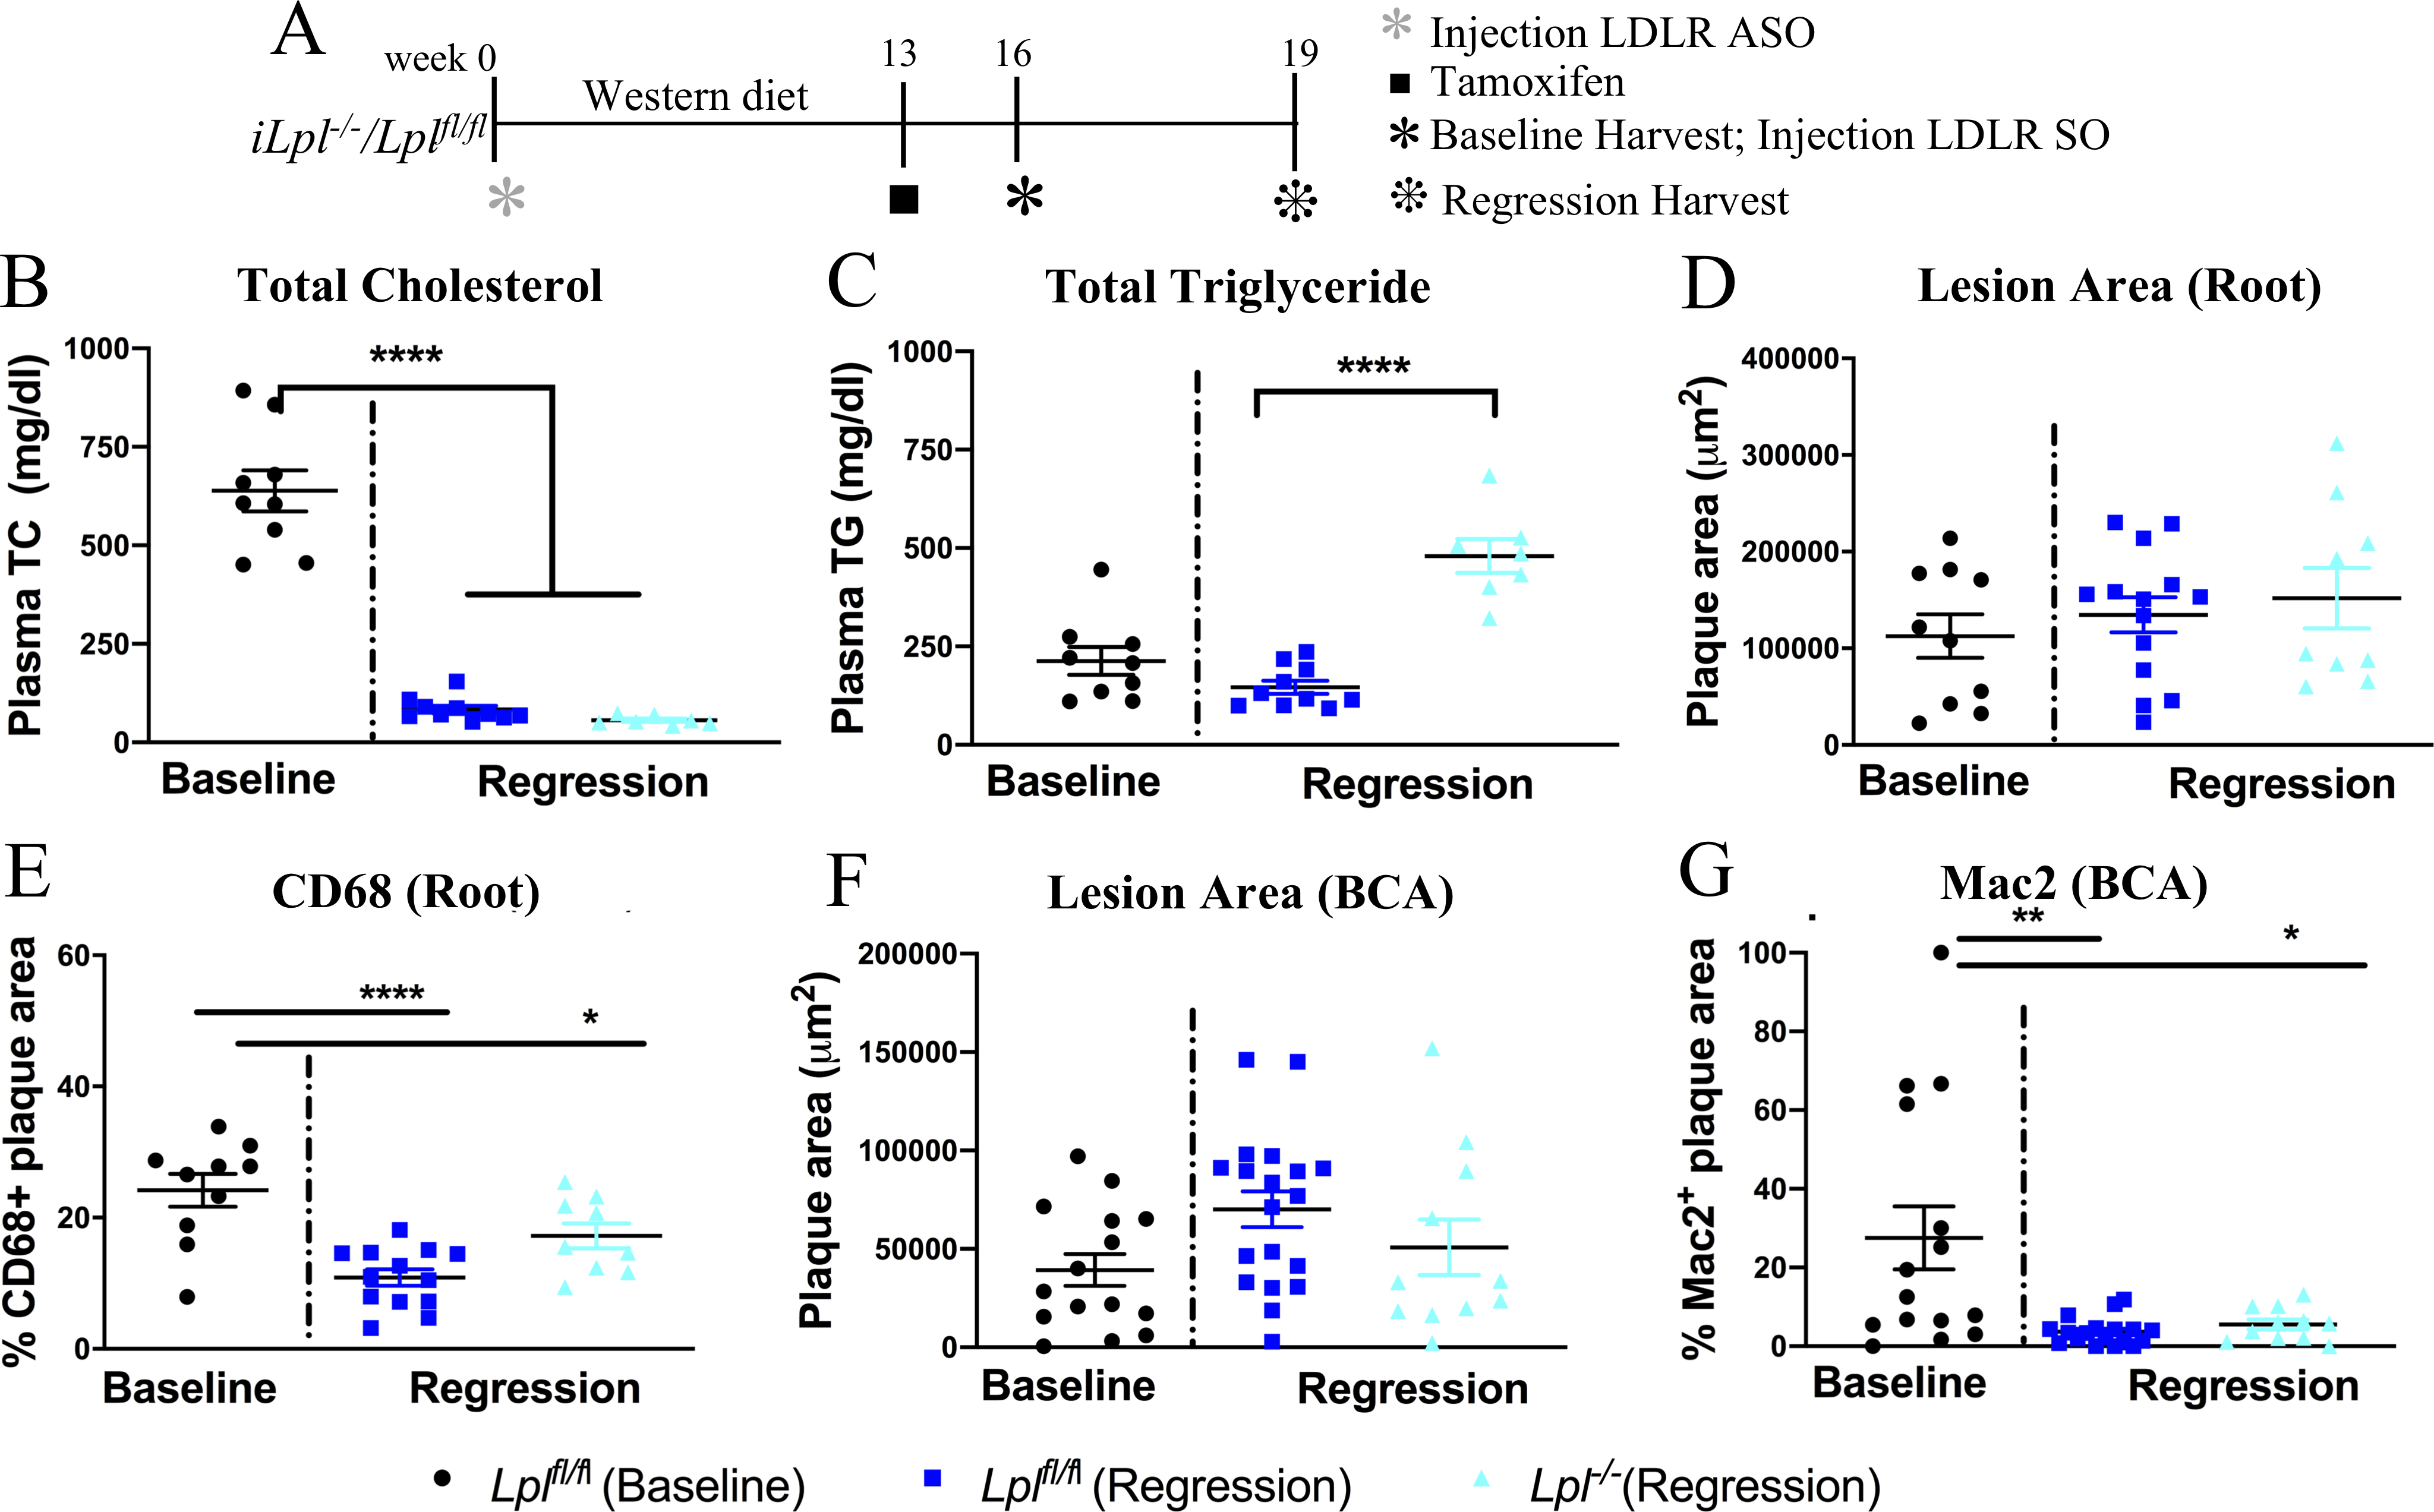
(A) Study design: atherosclerosis was created in Lplfl/fl and iLpl−/− mice with LDLR antisense oligonucleotides (ASO) and western diet feeding for 16 weeks. One set of mice were analyzed at 16 weeks as the baseline group and the rest of the mice were treated with SO to induce regression and were analyzed after 3 weeks. The mice in regression group were also treated with tamoxifen at week 13 to induce hypertriglyceridemia in iLpl−/− mice. (B) Plasma total cholesterol (TC) and (C) triglyceride (TG) levels in baseline and regression groups. (D) Total plaque area, (E) % of macrophages (CD68+) within aortic root lesions, (F) total plaque area, (G) % of macrophage (Mac2+) in plaques within the BCA in the baseline and regression groups. N=(B,C) Baseline Lplfl/fl 9, Regression Lplfl/fl 10 and iLpl−/− 7, (D,E) Baseline Lplfl/fl 10, Regression Lplfl/fl14 and iLpl−/− 9 and (F,G) Baseline Lplfl/fl 15, Regression Lplfl/fl 19 and iLpl−/− 11. Results are expressed as mean ± SEM. * P < 0.05, ** P<0.01 and **** P < 0.0001 using 1-way ANOVA with Tukey’s multiple comparison test.
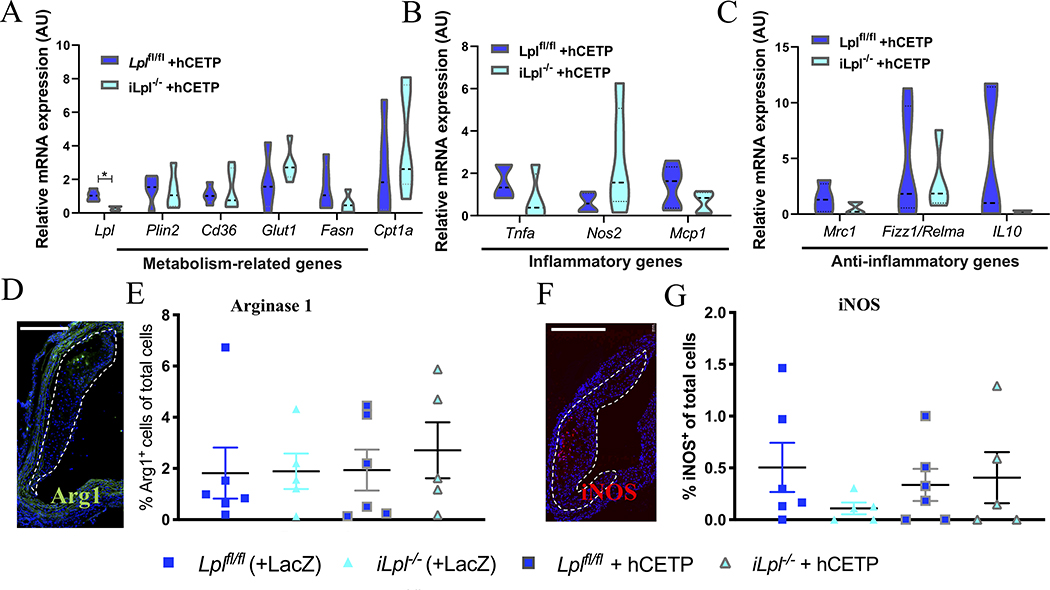
Macrophage phenotype was assessed by isolating mRNA from atherosclerotic CD68+ macrophages using Laser Capture Microdissection and mRNA expression measured for (A) Metabolism-related genes (B) Inflammatory genes (C) Anti-inflammatory genes. Additionally, immunofluorescence staining of atherosclerotic arches was performed for (D-E) Arginase-1 (%cells per total cells) and (F-G) iNOS (%cells per total cells), scale bars = 500 μm. N= (A-C) Lplfl/fl +hCETP 5, Lpl−/− + hCETP 5; (E, G) Lplfl/fl 6, Lpl−/− 5, Lplfl/fl +hCETP 6, Lpl−/− + hCETP 5. Data represented as mean ± SEM, * P < 0.05, (A-C) unpaired t-test, (E, G) 1-way ANOVA with Tukey’s multiple comparison test.
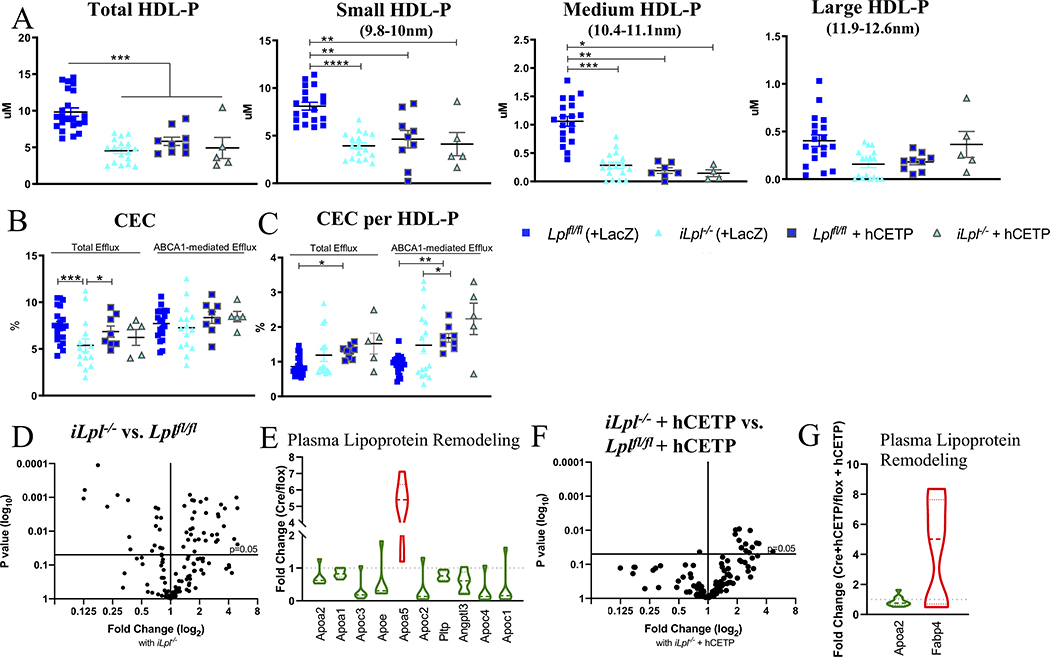
(A) Total HDL-P and its subfractions. (B) Total and ABCA1-mediated HDL Cholesterol Efflux Capacity (CEC). (C) Total and ABCA1-mediated CEC per HDL-P. (D) Volcano-plot of HDL Proteomics in iLpl−/− versus Lplf//fl. (E) Main regulated proteins are part of plasma lipoprotein remodeling. (F) Volcano plot iLpl−/−
+ hCETP vs. Lplfl/f + hCETP. (G) Regulated proteins in the plasma lipoprotein remodeling pathway. Proteomics normalized to spiked ApoA-I; complete list of proteins can be found in Supplemental Table II–V. N= (A) Lplfl/fl 19, Lpl−/− 17, Lplfl/fl +hCETP 9, Lpl−/− + hCETP 5; (B,C) Lplfl/fl 19, Lpl−/− 13, Lplfl/fl +hCETP 8, Lpl−/− + hCETP 5; (D-G) Lplfl/fl n=8, iLpl−/− n=8, Lplfl/f + hCETP n=17, iLpl−/−
+ hCETP n=10. * P < 0.05, ** P < 0.01, *** P < 0.001, **** P < 0.0001, 1-way ANOVA with Tukey’s multiple comparison test; Medium HDL-P and (C) Kruskal-Wallis Test with Dunn’s multiple comparison test.
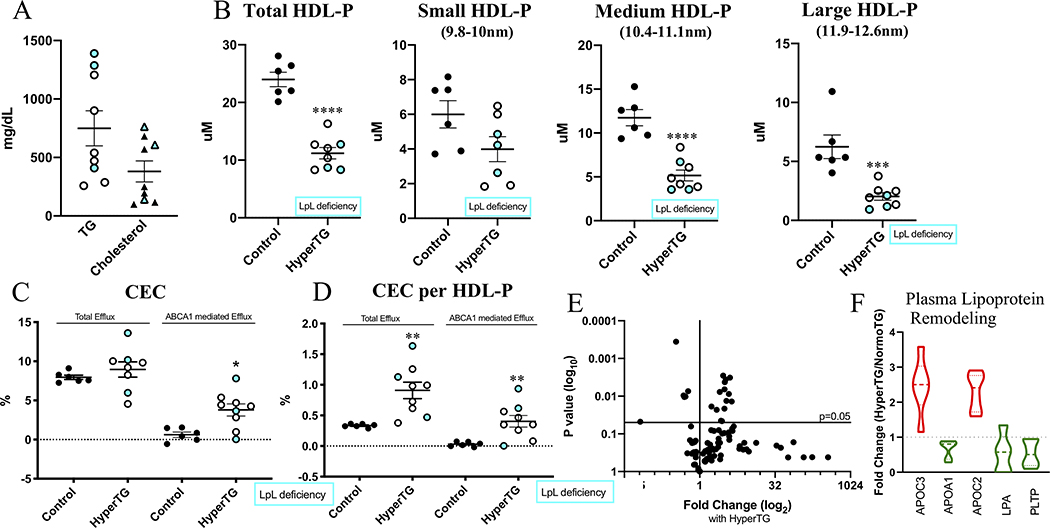
(A) Plasma TG and Cholesterol levels (mg/dL). (B) total HDL-P and HDL-P subsets. (C) Total and ABCA1-mediated CEC (%). (D) CEC per HDL-P (E) Volcano-plot of HDL Proteomics showing changes with HyperTG. (F) Main regulated proteins are part of plasma lipoprotein remodeling pathway. White-filled dots refer to HyperTG patients, blue filled dots refer to LpL deficient patients. Proteomics normalized to spiked ApoA-I; complete list of proteins can be found in Supplemental Table VI. N=6 (Control), N=9 (HyperTG). * P < 0.05, ** P<0.01, **** P < 0.0001, students unpaired t-test; (C, D) Mann-Whitney test.
References
Publication types
MeSH terms
Substances
Grants and funding
- R35 HL150754/HL/NHLBI NIH HHS/United States
- R01 HL045095/HL/NHLBI NIH HHS/United States
- R01 HL129433/HL/NHLBI NIH HHS/United States
- P30 DK020541/DK/NIDDK NIH HHS/United States
- P60 DK020541/DK/NIDDK NIH HHS/United States
- P01 HL092969/HL/NHLBI NIH HHS/United States
- R01 HL084312/HL/NHLBI NIH HHS/United States
- P30 DK017047/DK/NIDDK NIH HHS/United States
- P01 HL131481/HL/NHLBI NIH HHS/United States
- R01 HL144558/HL/NHLBI NIH HHS/United States
- R01 HL073029/HL/NHLBI NIH HHS/United States
- P01 HL151328/HL/NHLBI NIH HHS/United States
LinkOut - more resources
Full Text Sources
Other Literature Sources
Medical
Molecular Biology Databases
