. 2021 Feb 16;118(7):e2016553118.
doi: 10.1073/pnas.2016553118.

PON2 subverts metabolic gatekeeper functions in B cells to promote leukemogenesis

Affiliations

PON2 subverts metabolic gatekeeper functions in B cells to promote leukemogenesis

Lili Pan et al. Proc Natl Acad Sci U S A. .

Abstract

Unlike other cell types, developing B cells undergo multiple rounds of somatic recombination and hypermutation to evolve high-affinity antibodies. Reflecting the high frequency of DNA double-strand breaks, adaptive immune protection by B cells comes with an increased risk of malignant transformation. B lymphoid transcription factors (e.g., IKZF1 and PAX5) serve as metabolic gatekeepers by limiting glucose to levels insufficient to fuel transformation. We here identified aberrant expression of the lactonase PON2 in B cell acute lymphoblastic leukemia (B-ALL) as a mechanism to bypass metabolic gatekeeper functions. Compared to normal pre-B cells, PON2 expression was elevated in patient-derived B-ALL samples and correlated with poor clinical outcomes in pediatric and adult cohorts. Genetic deletion of Pon2 had no measurable impact on normal B cell development. However, in mouse models for BCR-ABL1 and NRASG12D-driven B-ALL, deletion of Pon2 compromised proliferation, colony formation, and leukemia initiation in transplant recipient mice. Compromised leukemogenesis resulted from defective glucose uptake and adenosine triphosphate (ATP) production in PON2-deficient murine and human B-ALL cells. Mechanistically, PON2 enabled glucose uptake by releasing the glucose-transporter GLUT1 from its inhibitor stomatin (STOM) and genetic deletion of STOM largely rescued PON2 deficiency. While not required for glucose transport, the PON2 lactonase moiety hydrolyzes the lactone-prodrug 3OC12 to form a cytotoxic intermediate. Mirroring PON2 expression levels in B-ALL, 3OC12 selectively killed patient-derived B-ALL cells but was well tolerated in transplant recipient mice. Hence, while B-ALL cells critically depend on aberrant PON2 expression to evade metabolic gatekeeper functions, PON2 lactonase activity can be leveraged as synthetic lethality to overcome drug resistance in refractory B-ALL.

Keywords: B cell leukemia; glucose transport; lactonase; paraoxonase 2.


Conflict of interest statement

The authors declare no competing interest.

Figures
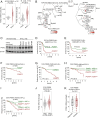
Fig. 1.
Fig. 1.
High PON2 mRNA levels predict poor clinical outcome in B-ALL patients. (A) Gene expression data from ECOG E2993 (ALL, n = 191) and St. Jude (ALL, n = 132) clinical trials are shown. Comparison of PON2 expression between normal pre-B cells and Ph+ B-ALL was performed using two-tailed t test. (B) Pon2 mRNA levels (red color scale) as determined by RNA sequencing were plotted for hematopoietic lineages (B lymphoid, T lymphoid, natural killer [NK] cell, and myeloid) as well as their differentiation stages within each lineage (GSE109125, Left) and for B cell malignancies, T-ALL and myeloid leukemias (GSE13159, Right) as dendrograms. (C) Western blots were performed to assess PON2 expression in B cells from healthy donors and patient-derived Ph+ B-ALL cells. (D and E) Patients with B-ALL from the indicated cohorts of the ECOG E2993 clinical trial were segregated into two groups, PON2high or PON2low based on PON2 mRNA levels (Upper and Lower quartiles in D and median values in E). OS in the two groups was assessed by Kaplan–Meier survival analysis. Imatinib-treated cases were excluded from the ECOG E2993 (GSE38461) dataset. P values were measured by log-rank test. (F and G) Patients in a pediatric high-risk ALL trial (Children’s Oncology Group, COG P9906; n = 207) were segregated into two groups based on whether PON2 mRNA levels were higher (PON2high) or lower (PON2low) than the median expression value. Overall survival (F) and relapse-free survival (G) were assessed in the two groups by Kaplan–Meier analysis. (H and I) Multivariate analysis of overall survival (H) and relapse-free survival (I) of pediatric B-ALL patients from the clinical trial COG P9906 (n = 207). Patients were segregated into four groups based on higher or lower than median expression levels of PON2 and IKZF1 status (IKZF1+/+ or IKZF1del; log-rank test). (J) MRD in B-ALL patients was assessed by flow cytometry analysis after 29 d of treatment (COG P9906). Comparison of PON2 expression between MRD+ and MRD patients was performed using a two-sided Mann–Whitney Wilcoxon test. (K) Comparison of PON2 expression between matched B-ALL samples (COG P9906) at diagnosis and relapse was performed using a two-sided Mann–Whitney Wilcoxon test.
Fig. 2.
Fig. 2.
Pon2 is required for survival and proliferation of BCR-ABL1- and NRASG12D-driven B cell leukemia. (A and B) Viable cell counts of Pon2+/+ and Pon2−/− BCR-ABL1 (A) and NRASG12D (B) B-ALL cells were measured daily for 6 consecutive days and normalized to day 0. Western blot analyses were performed to validate the deficiency of Pon2 and measure protein levels of Arf and p21 in both models. (C and D) Cell cycle analysis was performed for Pon2+/+ and Pon2−/− BCR-ABL1 (C) and NRASG12D (D) B-ALL cells by measuring 5-ethynyl-2′-deoxyuridine (EdU) incorporation in combination with DAPI staining. Comparison of proportions of cells in the S phase was performed using two-tailed t test. (E and F) Ten thousand Pon2+/+ and Pon2−/− BCR-ABL1 (E) and NRASG12D (F) B-ALL cells were seeded and plated in semisolid methylcellulose for colony forming assays. Colonies were counted and imaged after 10 d. P values were estimated using two-tailed t test. (G and H) One million firefly luciferase-labeled Pon2+/+ or Pon2−/− BCR-ABL1 (G) or NRASG12D B-ALL (H) cells were injected into each sublethally irradiated NSG mouse. Leukemia engraftment and progression were monitored by luciferase bioimaging at the indicated time points. Unit for bioimaging is photons/second/cm^2/steradian. Kaplan–Meier survival curves of the overall survival for each group (n = 7) are shown, and comparison of survival between two groups was performed by log-rank test. Data (AF) are shown as mean ± SD (n = 3 independent experiments).
Fig. 3.
Fig. 3.
CRISPR-Cas9-mediated deletion of PON2 compromises proliferation and colony formation in human Ph+ B-ALL cells. (A and B) PON2 levels were assessed following CRISPR-Cas9-mediated PON2 deletion in human Ph+ ALL cell line (BV173) before (A) and after single-cell cloning (B). (C and D) Two thousand PON2+/+ and PON2−/− B-ALL cells following single-cell cloning (B) were seeded and plated in semisolid methylcellulose for colony forming assays. Colonies were counted and imaged after 10 d. Representative images are shown at 40× and 200× magnification under a light microscope. Secondary plating was performed using the cells collected from primary plating. Comparison between two groups was performed for colony numbers and colony size (as measured by the diameter of each colony) using two-tailed t test. (E) Cell cycle analysis was performed for PON2+/+ and PON2−/− B-ALL cells following single-cell cloning (B) by measuring EdU incorporation in combination with DAPI staining. Comparison of proportions of cells in the S phase was performed using two-tailed t test. Data are shown as mean ± SD (n = 3 independent experiments).
Fig. 4.
Fig. 4.
Pon2 facilitates glucose uptake and ATP production in B-ALL cells. (A and B) Glucose uptake, total ATP, and lactate levels were measured for mouse BCR-ABL1 (A) or NRASG12D (B) B-ALL cells. All the values were normalized to viable cell counts. P values were determined using two-tailed t test (two to three independent experiments using biological replicates, each done with technical triplicate). (C) ECARs and (D) OCRs were measured in Pon2+/+ or Pon2−/− BCR-ABL1 B-ALL in response to various treatments as indicated in the figure. AA plus Rot: antimycin A and rotenone. Data shown as mean ± SD, summarizing results obtained using two to three biological replicates (two for C and three for D), each done with three or more technical replicates. (E) Pon2+/+ or Pon2−/− mouse BCR-ABL1 B-ALL cells were transduced with doxycycline-inducible Pon2 or EV control. Total ATP levels and Pon2 protein levels were measured upon 24 h of doxycycline (1 µg/mL) treatment. ATP levels in each sample were first normalized to viable cell counts and then normalized to the corresponding nondoxycycline-treated control, and comparison between Pon2-overexpressing and empty vector groups was performed using two-tailed t test. (F) Total ATP levels and Pon2 protein levels were measured at indicated time points upon doxycycline treatment. ATP levels were first normalized to viable cell counts and then normalized to empty vector controls; and comparison between Pon2-overexpressing and empty vector groups was performed using two-tailed t test (three independent experiments performed on separate days, each done with technical triplicate). (G) Glucose uptake and total ATP levels were measured in PON2+/+ or PON2−/− BV173 cells and normalized to viable cell counts. Comparison between two groups was performed using two-tailed t test. (H) Pon2+/+ or Pon2−/− mouse BCR-ABL1 or NRASG12D B-ALL, or human Ph+ B-ALL (BV173) cells were treated with increasing concentrations of dexamethasone (72 h). Cell viability was determined and normalized to the vehicle-treated group. IC50 values were determined using the CompuSyn software based on average effect value at each dose. Data are shown as mean ± SD (n = 3).
Fig. 5.
Fig. 5.
PON2 promotes glucose uptake via interfering with GLUT1-STOM interaction. (A) Coimmunoprecipitation assay was performed in BV173 cells expressing empty vector or FLAG-tagged PON2 using either IgG or anti-FLAG antibody. Immunoprecipitates and lysates were analyzed by Western blotting. (B) PON2 and STOM levels in BV173 cells were assessed following CRISPR-Cas9-mediated gene deletion and subsequent single-cell cloning. Glucose uptake was measured using the Amplex Red Glucose Assay Kit (Left), and 2-NBDG staining (Right), respectively. Median fluorescence intensity (MFI) of 2-NBDG staining was determined to compare the glucose uptake level among different groups. (C) Coimmunoprecipitation assay was performed to study endogenous PON2/STOM/GLUT1 interactions in BV173 cells expressing PON2 or in CRISPR-Cas9-edited BV173 cells deficient in PON2, with or without STOM deletion, using either IgG or anti-STOM antibody. Immunoprecipitates and lysates were analyzed by Western blotting. (D) Total ATP levels were measured. All the data were first normalized to viable cell counts and then normalized to PON2+/+ STOM+/+ BV173 cells. P values were determined using one-way ANOVA and Turkey’s multiple comparison test. (E and F) Two thousand BV173 cells with the indicated genotypes were seeded and plated in semisolid methylcellulose for colony forming assays. Colonies were imaged following 10 d (E). Representative images are shown at 40× magnification. P values were calculated for comparison of colony numbers and colony size using two-tailed t test with multiple test correction (F). Data are shown as mean ± SD (n = 3).
Fig. 6.
Fig. 6.
PON2 lactonase activity can be leveraged in a prodrug-based strategy to kill PON2high leukemia cells. (A) Pon2+/+ or Pon2−/− BCR-ABL1 and NRASG12D mouse B-ALL cells were treated with 3OC12 at the indicated concentrations for 3 d, and cell viability was determined. (B) Pon2+/+ or Pon2−/− mouse BCR-ABL1 B-ALL cells overexpressing Pon2 or empty vector were treated with 3OC12 at the indicated concentrations for 3 d. Cell viability was determined. (C) ROS levels were measured in Pon2+/+ or Pon2−/− mouse BCR-ABL1 and NRASG12D B-ALL cells after 2 h of 3OC12 treatment. (D and E) Patient-derived Ph+ B-ALL cells (LAX2 and PDX2) expressing gRNAs targeting PON2 or nontargeting (NT) gRNAs were treated with 3OC12 at the indicated concentrations for 3 d. (D) From top to bottom: LAX2 +PON2 gRNA, PDX2 +PON2 gRNA, LAX2 +NT gRNA, PDX2 +NT gRNA. Patient-derived Ph+ B-ALL cells (BLQ5 and PDX2) expressing PON2 or empty vector were treated with 3OC12 at the indicated concentrations for 3 d (E). Cell viability was determined. (F) Western blotting was performed to measure the levels of phospho-p38-pT180/Y182, total p38, and cleaved caspase-3 in 3OC12-treated patient-derived Ph+ B-ALL cells (BLQ5) with or without PON2 overexpression. The bands of phospho-p38-pT180/Y182 were quantified using ImageJ, and intensities were first normalized to those of total p38 and β-actin, and then normalized to values obtained from time 0 to determine the fold change. (G) NSG mice treated with 3OC12 or vehicle were weighed for 6 d consecutively. Weight measurements are shown (vehicle, n = 2; 3OC12, 12.5 mg/kg, n = 3; 3OC12, 25 mg/kg, n = 3). Each line represents measurement from one mouse. (H and I) Half a million luciferase-labeled PDX2 cells were injected via tail vein into each sublethally irradiated (2.5 Gy) NSG mouse. Prior to injection, cells were pretreated with vehicle or 3OC12 (100 μM) for 1 h and resuspended in PBS following washout of the vehicle or the lactone prodrug. Recipient mice were intraperitoneally injected with vehicle or 25 mg/kg of 3OC12 for 7 consecutive days. Leukemia engraftment and progression were monitored by luciferase bioimaging at the indicated time points (H). Kaplan–Meier survival curves of the overall survival for each group (n = 7) are shown, and comparisons of survival between two groups were performed by log-rank test (I). (J) PON2 enables glucose uptake and energy production by blocking the interaction between GLUT1 and its inhibitor STOM, thereby mitigating energy crisis caused by the metabolic gatekeepers and promoting leukemogenesis in B-ALL. While not required for glucose uptake, the lactonase activity of PON2 to hydrolyze the lactone-prodrug 3OC12 to 3OC12 acid, which induces intracellular acidification, caspase-3 activation, and subsequent cell death, can be exploited for eradicating B-ALL cells.

Similar articles

Cited by

References

    1. Buchner M., Swaminathan S., Chen Z., Müschen M., Mechanisms of pre-B-cell receptor checkpoint control and its oncogenic subversion in acute lymphoblastic leukemia. Immunol. Rev. 263, 192–209 (2015). - PubMed
    1. Papaemmanuil E., et al. , RAG-mediated recombination is the predominant driver of oncogenic rearrangement in ETV6-RUNX1 acute lymphoblastic leukemia. Nat. Genet. 46, 116–125 (2014). - PMC - PubMed
    1. Swaminathan S., et al. , Mechanisms of clonal evolution in childhood acute lymphoblastic leukemia. Nat. Immunol. 16, 766–774 (2015). - PMC - PubMed
    1. Chan L. N., et al. , Metabolic gatekeeper function of B-lymphoid transcription factors. Nature 542, 479–483 (2017). - PMC - PubMed
    1. Xiao G., et al. , B-cell-specific diversion of glucose carbon utilization reveals a unique vulnerability in B cell malignancies. Cell 173, 470–484.e18 (2018). - PMC - PubMed

Publication types

MeSH terms