. 2021 Mar;32(3):614-627.
doi: 10.1681/ASN.2020050757. Epub 2021 Feb 2.

Urinary Single-Cell Profiling Captures the Cellular Diversity of the Kidney

Collaborators, Affiliations

Urinary Single-Cell Profiling Captures the Cellular Diversity of the Kidney

Amin Abedini et al. J Am Soc Nephrol. 2021 Mar.

Abstract

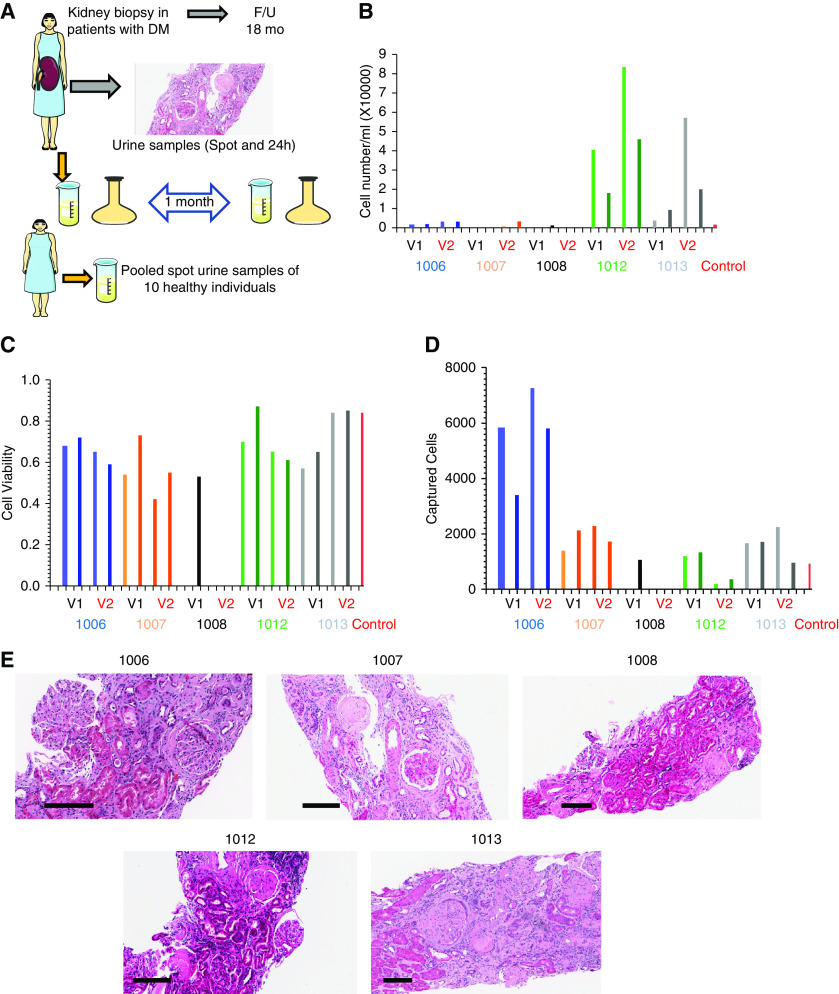
Background: Microscopic analysis of urine sediment is probably the most commonly used diagnostic procedure in nephrology. The urinary cells, however, have not yet undergone careful unbiased characterization.

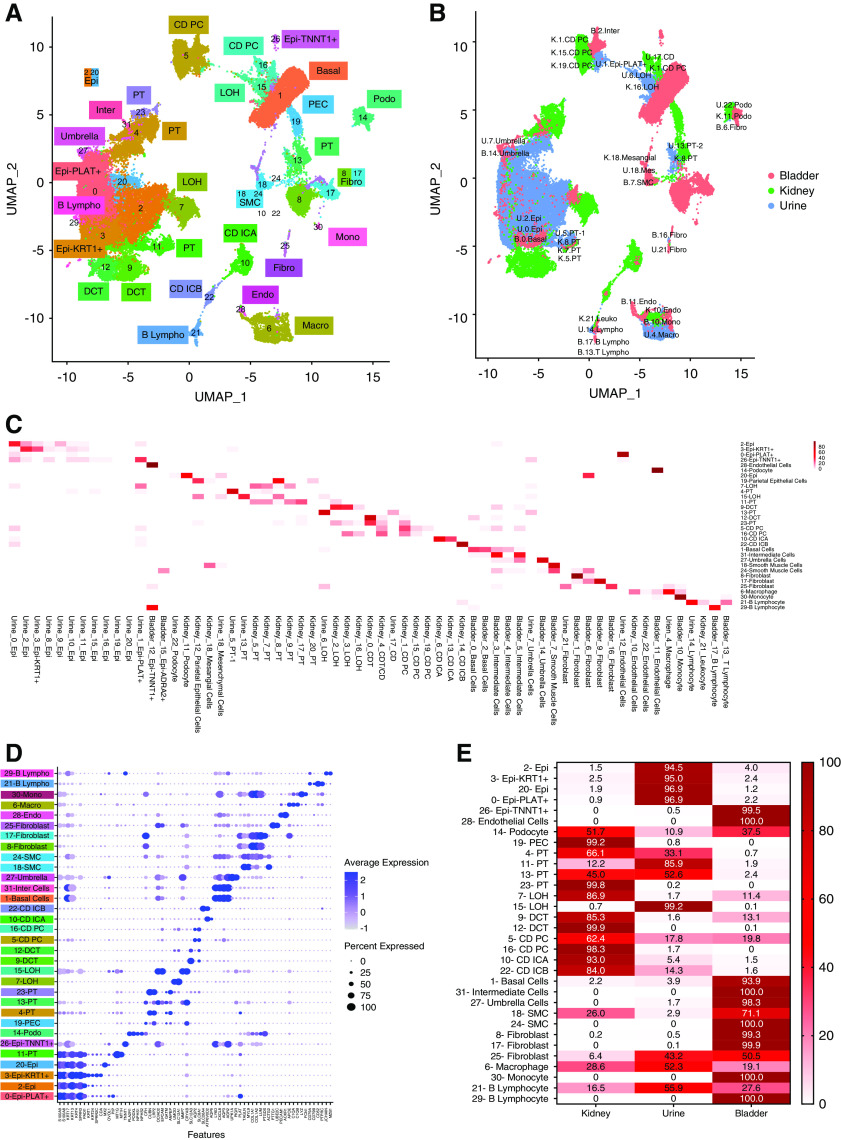
Methods: Single-cell transcriptomic analysis was performed on 17 urine samples obtained from five subjects at two different occasions, using both spot and 24-hour urine collection. A pooled urine sample from multiple healthy individuals served as a reference control. In total 23,082 cells were analyzed. Urinary cells were compared with human kidney and human bladder datasets to understand similarities and differences among the observed cell types.

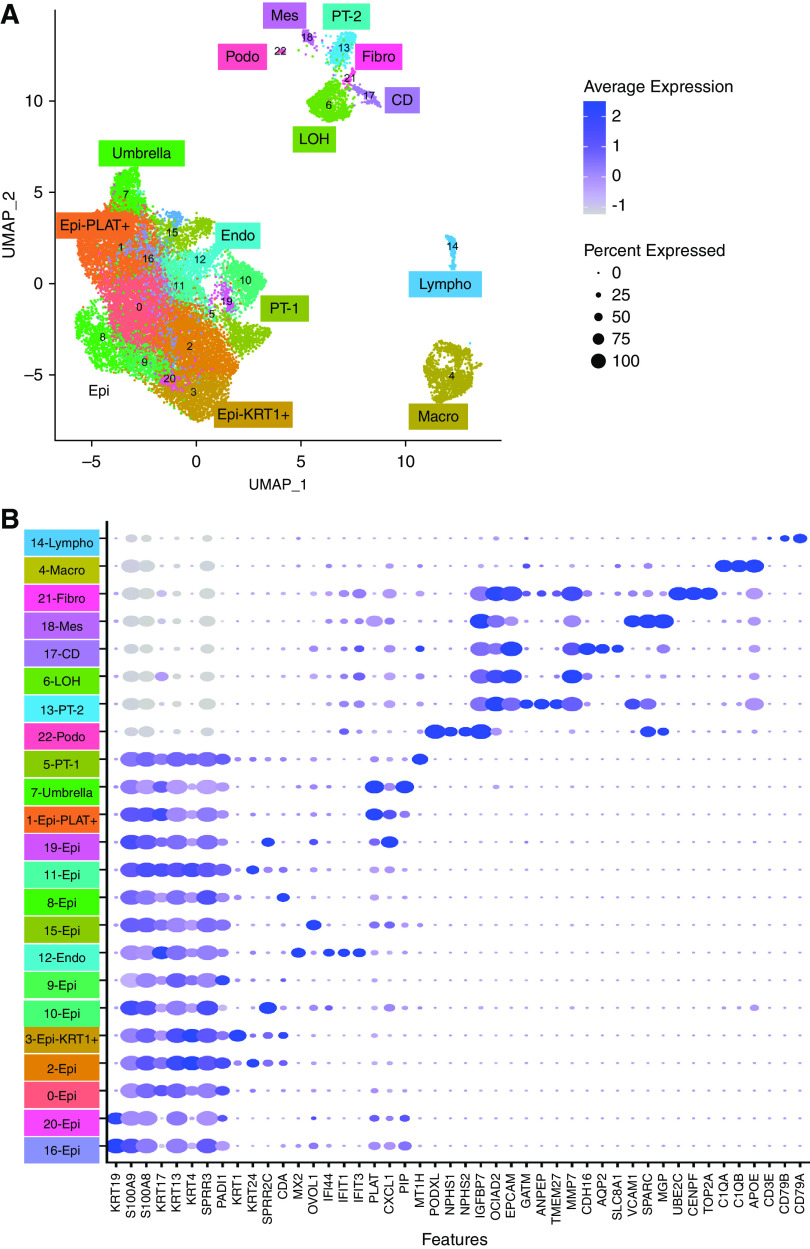
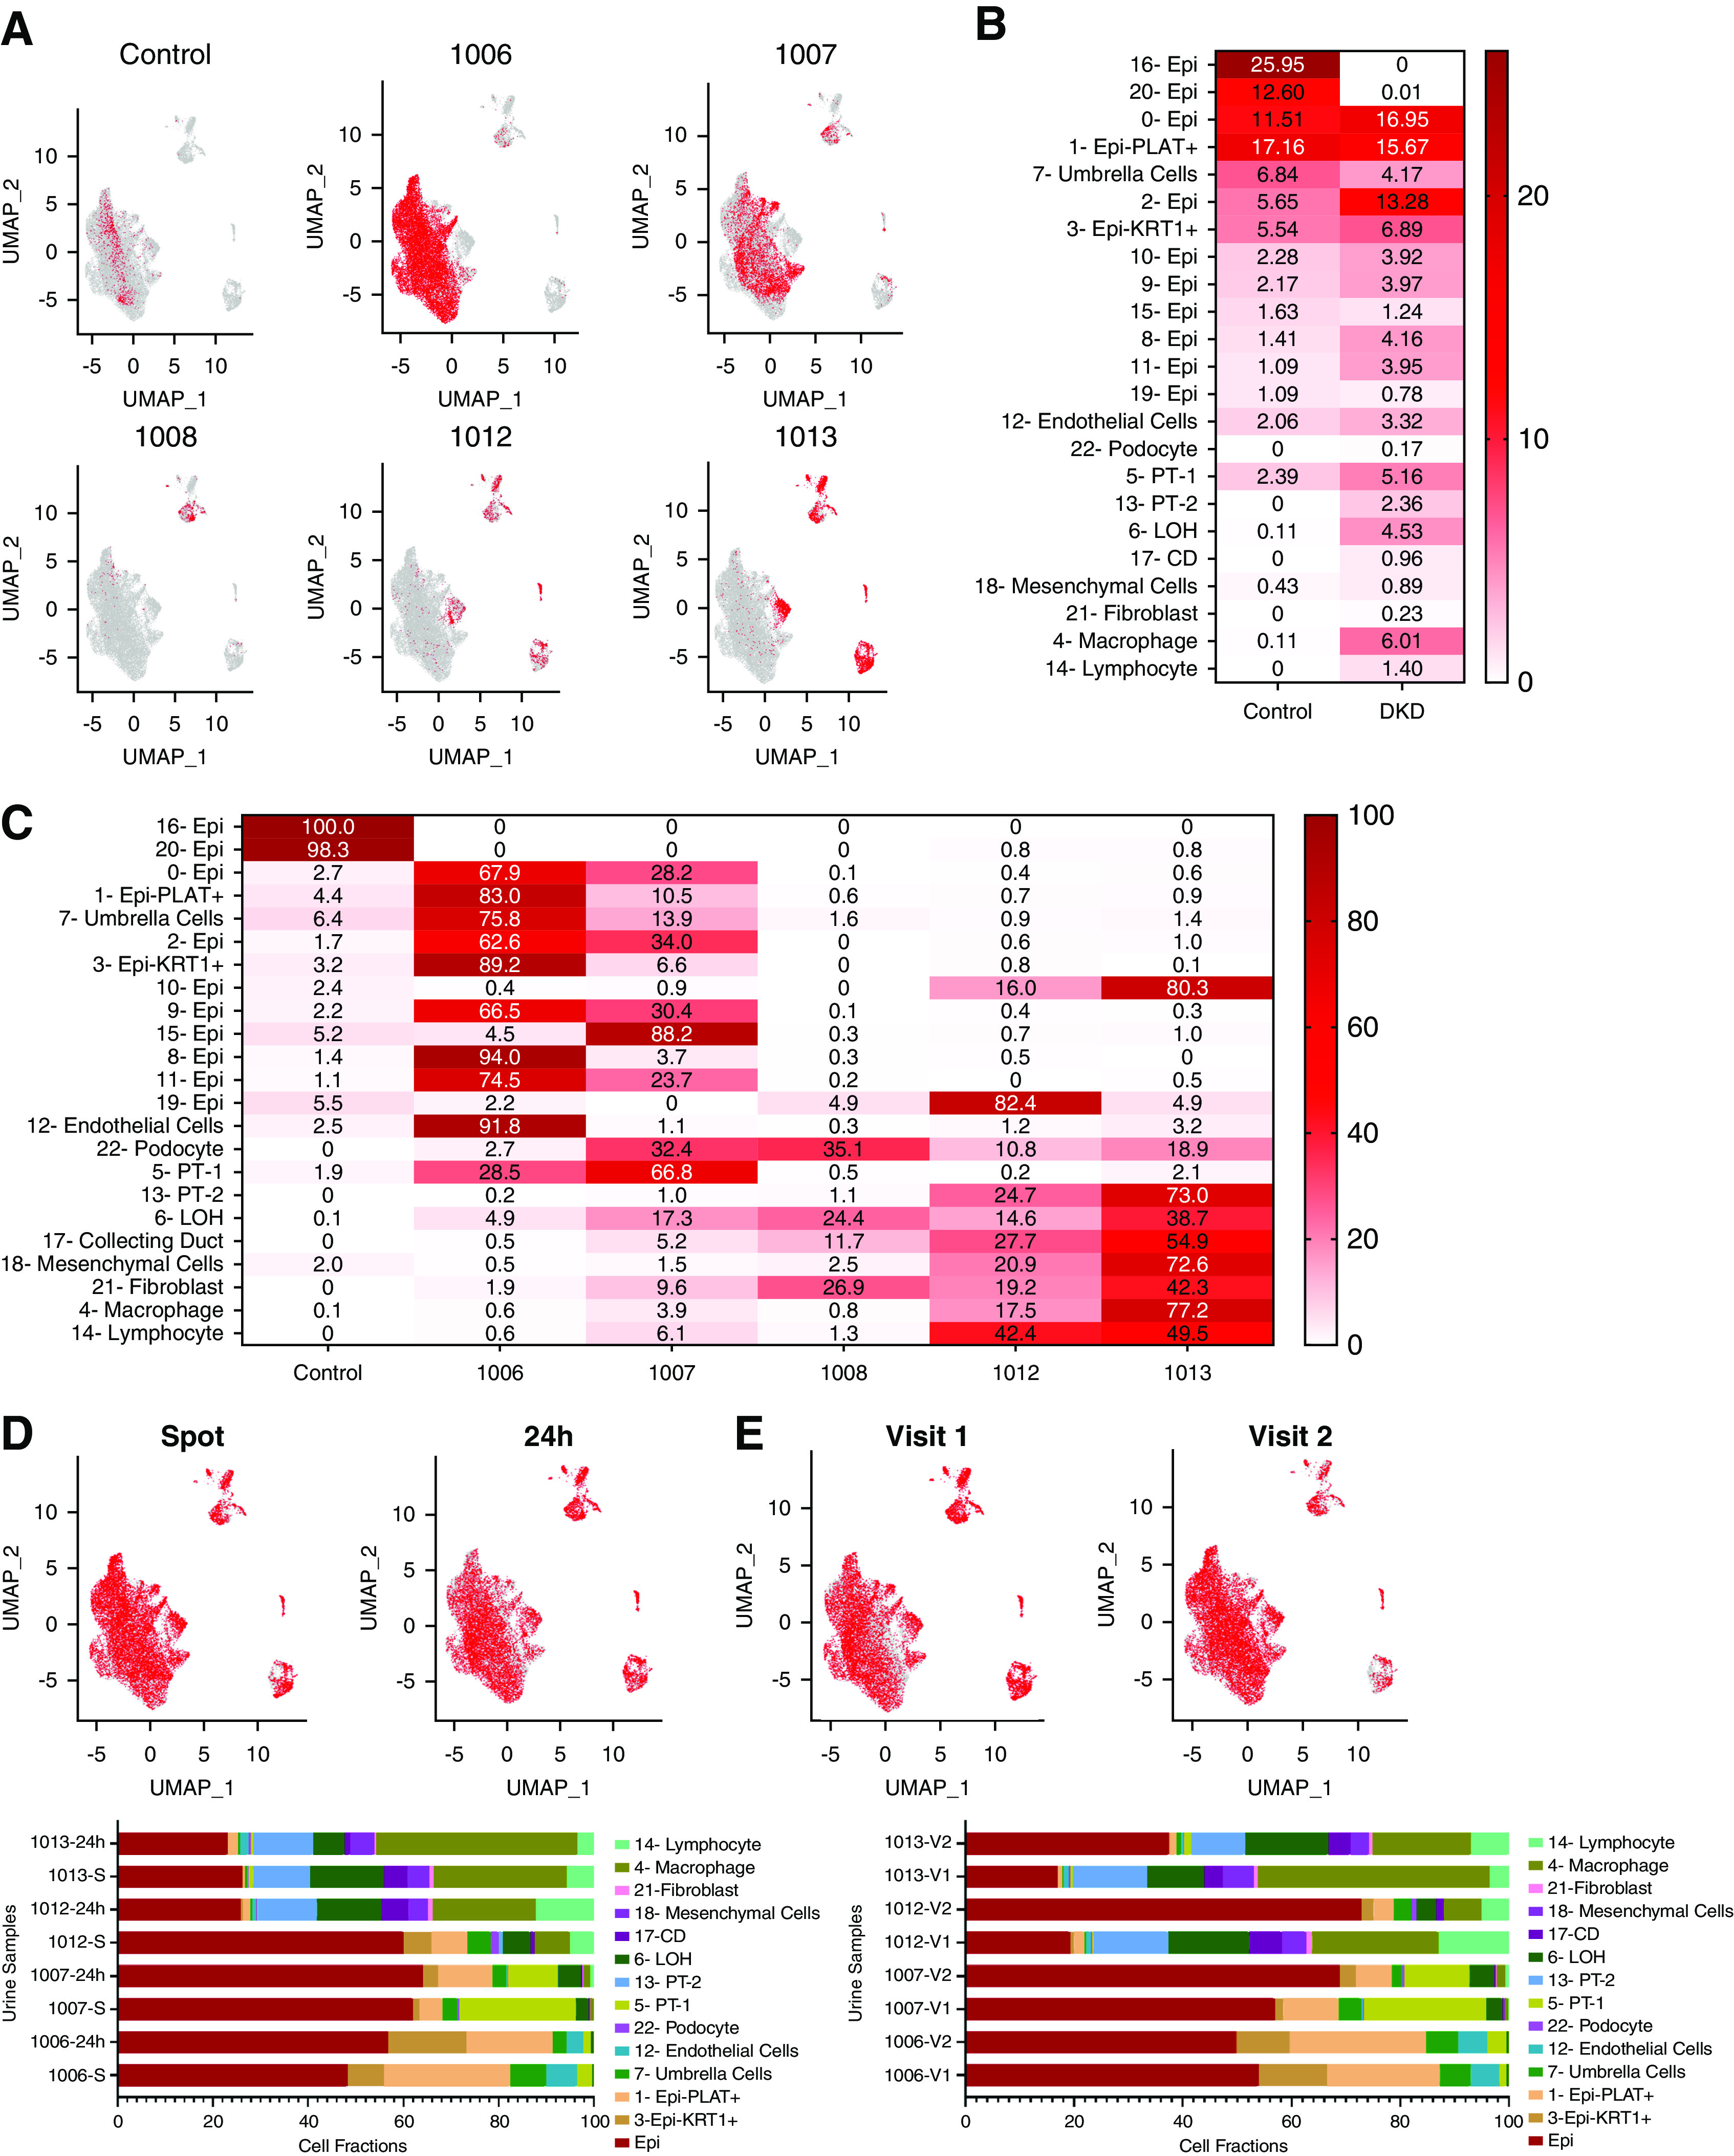
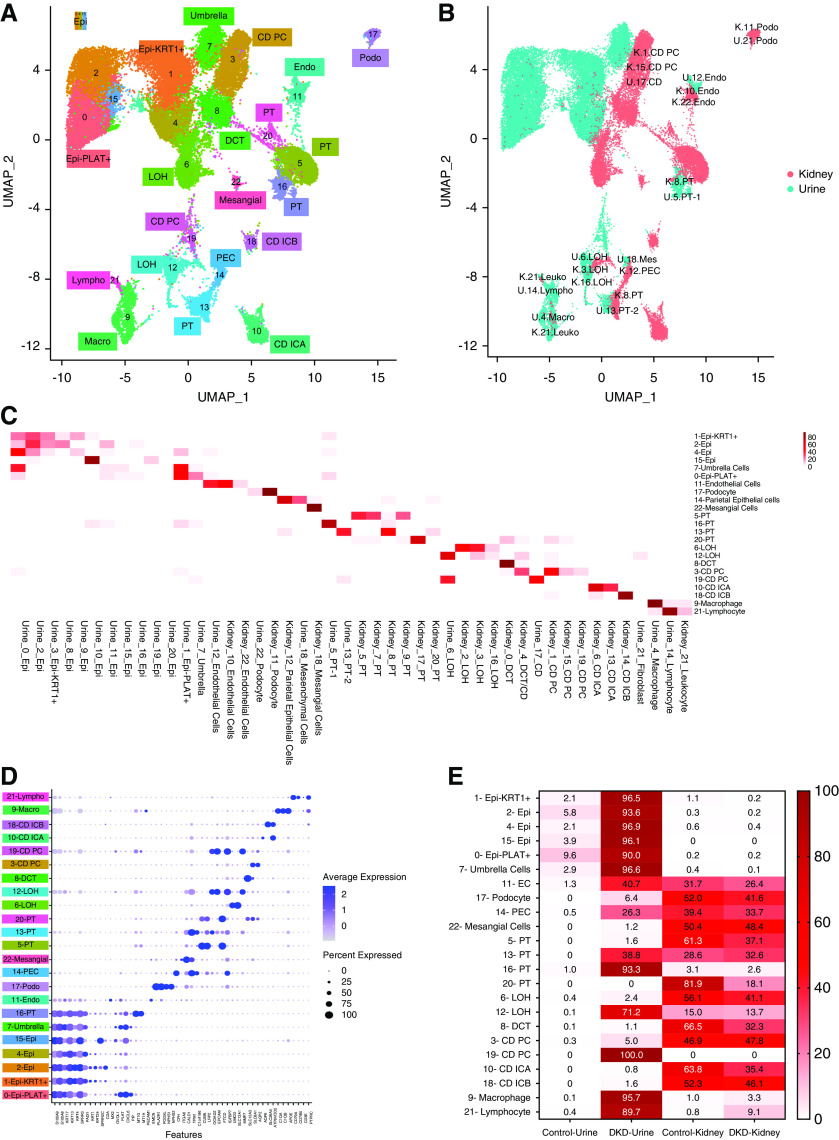
Results: Almost all kidney cell types can be identified in urine, such as podocyte, proximal tubule, loop of Henle, and collecting duct, in addition to macrophages, lymphocytes, and bladder cells. The urinary cell-type composition was subject specific and reasonably stable using different collection methods and over time. Urinary cells clustered with kidney and bladder cells, such as urinary podocytes with kidney podocytes, and principal cells of the kidney and urine, indicating their similarities in gene expression.

Conclusions: A reference dataset for cells in human urine was generated. Single-cell transcriptomics enables detection and quantification of almost all types of cells in the kidney and urinary tract.

Keywords: RNA sequencing; diabetic kidney disease; single-cell transcriptomics; urine.


Figures

Figure 1.
Figure 1.
Study design and urine characteristics. (A) Subjects with diabetes underwent diagnostic kidney biopsy. Tissue samples analyzed and scored by light and electron microscopy and immunofluorescence. Subjects were followed for 18 months. Spot and 24-hour urine samples were collected 1 month apart and analyzed. Ten spot urine samples from ten healthy individuals as control were obtained and pooled for the single-cell RNA-seq study. (B) Sample level, urinary cell number per ml urine (y-axis), x-axis is each patient, collection method, and time. (C) Sample level, urinary cell viability (y-axis), x-axis is each patient, collection method, and time. (D) Total captured cell number per sample, each column represents one sample, lighter and darker shades of the same color represent spot urine sample and the darker color shows the 24-hour urine collection. V1 and V2 represent visit 1 and visit 2, respectively, for each subject. (E) Images of periodic acid–Schiff-stained kidney section of each kidney biopsy. Scale bars are shown at the left bottom of each image represent 200 µm. DM, diabetes mellitus; F/U, follow up.
Figure 2.
Figure 2.
Single-cell survey of the human urine. (A) Uniform Manifold Approximation and Projection (UMAP) dimension reduction of 23,089 urinary cells identified in 17 DKD and one pooled control urine samples. Clusters 0, 2, 8, 9, 10, 11, 15, 16, 19, and 20 were called Epi. (B) Bubble dot plots of the top cluster specific genes. The size of the dot indicates expression percentage and the darkness of the color indicates average expression. Epi, variety epithelial cells; Epi-PLAT+, PLAT-positive cells; Epi-KRT1+, KRT1-positive cells; umbrella, umbrella cells; endo, endothelial cells; podo, podocytes; LOH, loop of Henle; fibro, fibroblast; CD, collecting duct principal cell; macro, macrophages; lympho, lymphocytes; mes, mesenchymal cells.
Figure 3.
Figure 3.
Distribution of cells in control and DKD samples. (A) Subject-level feature plot of cells over the Uniform Manifold Approximation and Projection (UMAP) of all cells (gray). All cells analyzed for a single subject (visit 1 [V1] and V2, spot and 24-hour) were combined and shown in red. (B) The fractions of cells in each cell cluster in control and DKD urine samples. Darker color indicates higher percentage of cells. (C) The fractions of cells in each cell cluster in each sample. Darker color indicates a higher percentage of cells. (D) The stability of urinary cell number on the basis of the collection method. The collection method (spot versus 24-hour) level feature models (colored red) over all cells in the UMAP (gray) (upper panel). Cumulative urine cell fractions of spot and 24-hour urine samples (the two visits were combined) (lower panel). (E) The stability of urinary cell number on the basis of time. V1 or V2 level feature models (colored red) over all cells in the UMAP (gray) (upper panel). Cumulative urine cell fractions of visits 1 and 2 samples (combined spot and 24-hour collection) (lower panel). Epi, variety epithelial cells; Epi-PLAT+, PLAT-positive cells; Epi-KRT1+, KRT1-positive cells; LOH, loop of Henle; CD, collecting duct principal cell.
Figure 4.
Figure 4.
Integration of urine single cell with human kidney single nuclei datasets. (A) Uniform Manifold Approximation and Projection (UMAP) of Harmony-based integration of urinary and kidney cells. (B) UMAP of Harmony-based integration of urinary and kidney cells colored by the sample of origin. Blue indicates the urine origin and pink shows the cells originated from kidney. Each cluster is labelled with the cells of origin. (C) The percent of cells in each integrated (urine and kidney) cluster (y-axis) that came from each original cluster (x-axis). (D) Bubble dot plots of the top cell-type–specific differentially expressed genes in the integrated clusters of urine and kidney samples. The size of the dot indicates the expression percentage and the darkness of the color indicates average expression. (E) The fraction of cells in each integrated cluster and their sample of origin. The data are colored by the percentage of cell. Epi, variety epithelial cells; Epi-PLAT+, PLAT-positive cells; Epi-KRT1+, KRT1-positive cells; umbrella, umbrella cells; endo, endothelial cells; EC, endothelial cells; LOH, loop of Henle; CD PC, collecting duct principal cells; CD ICA, collecting duct intercalated cells A; CD ICB, collecting duct intercalated cells B; DCT, distal convoluted tubule; mesangial, mesangial cells; podo, podocytes; PEC, parietal epithelial cells; macro, macrophages; lympho, lymphocytes; U, urine; K, kidney; leuko, leukocyte; mes, mesenchymal cells.
Figure 5.
Figure 5.
Integration of urine single-cell, kidney single-nucleus, and bladder single-cell datasets. (A) Uniform Manifold Approximation and Projection (UMAP) of Harmony-based integration of urinary, bladder, and kidney cells. (B) UMAP of Harmony-based integration of urinary bladder and kidney cells colored by the sample of origin. Blue, green, and pink indicates the urine, kidney, and bladder origins, respectively. The origins of the cells are written in each plot. (C) The percent of cells in each integrated (kidney, urine, and bladder) cluster (y-axis) that originated from the original clusters (x-axis). (D) Bubble dot plots of the top cell-type–specific differentially expressed genes in the integrated clusters of urine, kidney, and bladder samples. The size of the dot indicates expression percentage and the darkness of the color indicates average expression. (E) The fraction of cells in each integrated cluster and their sample of origin. Epi, variety epithelial cells; Epi-PLAT+, PLAT-positive cells; Epi-KRT1+, KRT1-positive cells; Epi-TNNT1+, TNNT1-positive cells; PEC, parietal epithelial cells; LOH, loop of Henle; DCT, distal convoluted tubule; CD PC, collecting duct principal cells; CD ICA, collecting duct intercalated cells A; CD ICB, collecting duct intercalated cells B; SMC, smooth muscle cell; basal, basal cells; inter, intermediate cells; umbrella, umbrella cells; endo, endothelial cells; podo, podocyte; fibro, fibroblast; SMC, smooth muscle cell; macro, macrophages; mono, monocyte; lympho, lymphocytes; U, urine; K, kidney; B, bladder; leuko, leukocyte.
Figure 6.
Figure 6.
Urinary single-cell profiling provides a read-out for kidney disease genes and drug targets. (A) Urinary single cell-type specific expression enrichment of monogenic nephrotic syndrome genes. (B) Urinary single cell-type–specific expression enrichment of CKD-GWAS–nominated genes. (C) Urinary single cell-type–specific expression enrichment genes related to nephrolithiasis. (D) Urinary single cell-type–specific expression enrichment of Food and Drug Administration–approved drug target genes. Mean gene expression values were calculated in each cell type cluster. The color scheme of the heatmap is on the basis of z score distribution. In each heatmap, x-axis represents the urinary cell clusters and y-axis shows the genes. Epi, variety epithelial cells; Epi-PLAT+, PLAT-positive cells; Epi-KRT1+, KRT1-positive cells; PT, proximal tubule; LOH, loop of Henle; CD, collecting duct principal cells.

References

    1. Cavanaugh C, Perazella MA: Urine sediment examination in the diagnosis and management of kidney disease: Core curriculum 2019. Am J Kidney Dis 73: 258–272, 2019 - PubMed
    1. Oliveira Arcolino F, Tort Piella A, Papadimitriou E, Bussolati B, Antonie DJ, Murray P, et al.: Human urine as a noninvasive source of kidney cells. Stem Cells Int 2015: 362562, 2015 - PMC - PubMed
    1. Racusen LC, Fivush BA, Andersson H, Gahl WA: Culture of renal tubular cells from the urine of patients with nephropathic cystinosis. J Am Soc Nephrol 1: 1028–1033, 1991 - PubMed
    1. Dörrenhaus A, Müller JI, Golka K, Jedrusik P, Schulze H, Föllmann W: Cultures of exfoliated epithelial cells from different locations of the human urinary tract and the renal tubular system. Arch Toxicol 74: 618–626, 2000 - PubMed
    1. Inoue CN, Sunagawa N, Morimoto T, Ohnuma S, Katsushima F, Nishio T, et al.: Reconstruction of tubular structures in three-dimensional collagen gel culture using proximal tubular epithelial cells voided in human urine. In Vitro Cell Dev Biol Anim 39: 364–367, 2003 - PubMed

Publication types

MeSH terms