. 2021 Feb 2;12(1):750.
doi: 10.1038/s41467-020-20289-8.

TGFβ signaling curbs cell fusion and muscle regeneration

Affiliations

TGFβ signaling curbs cell fusion and muscle regeneration

Francesco Girardi et al. Nat Commun. .

Abstract

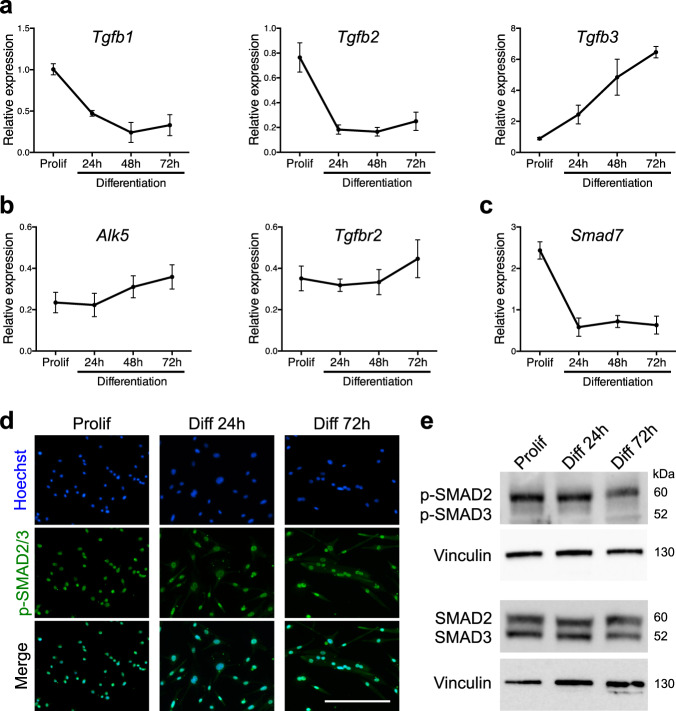
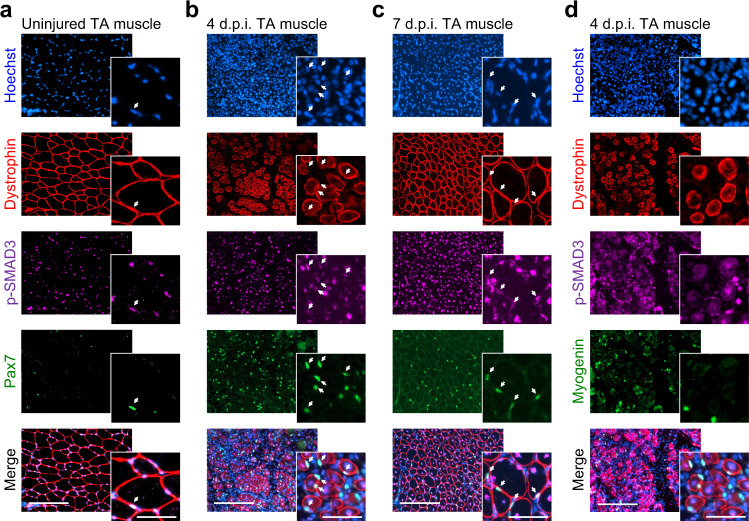
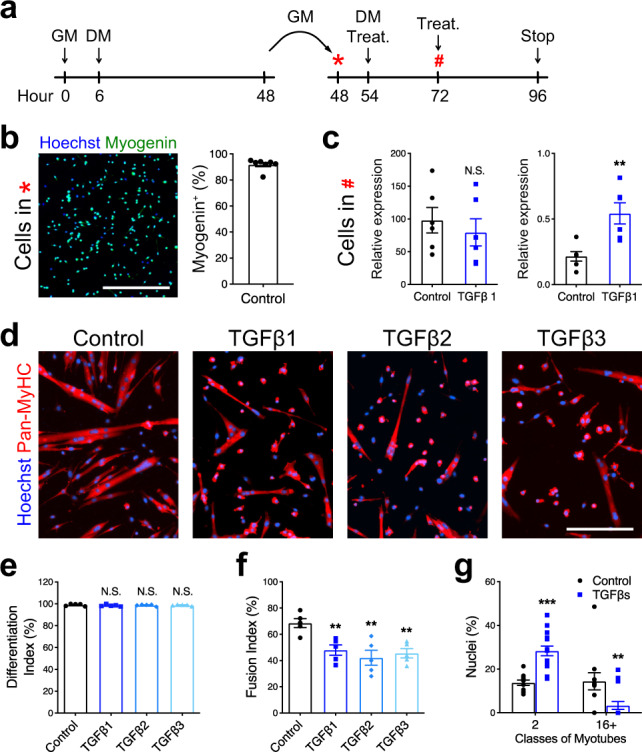
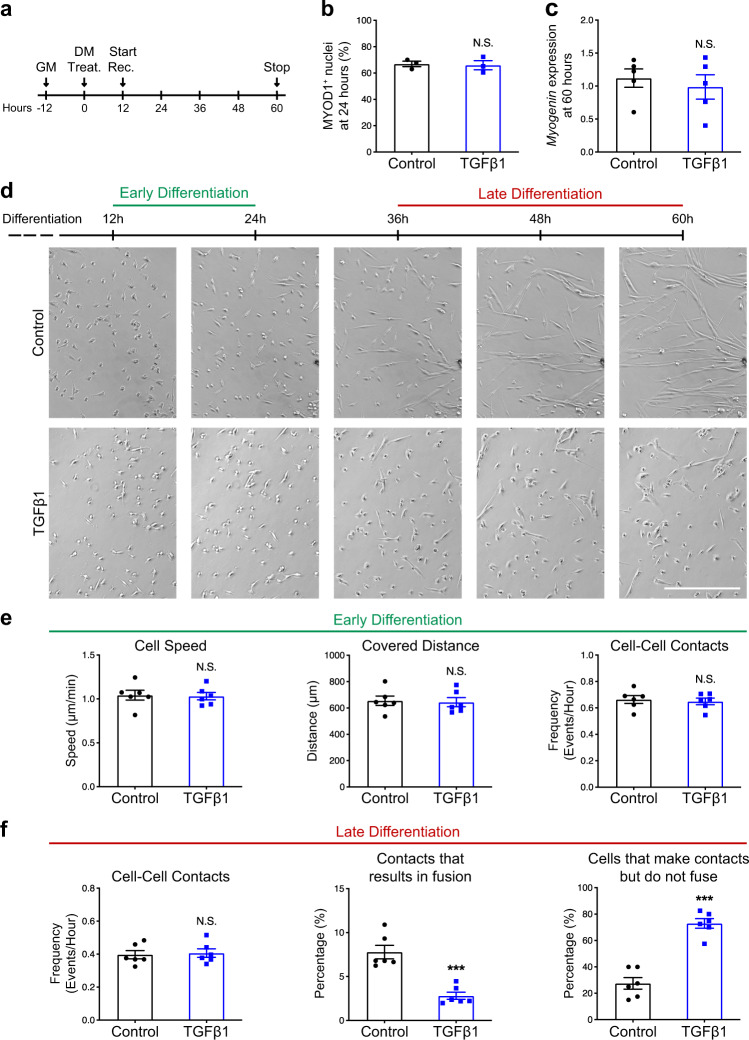
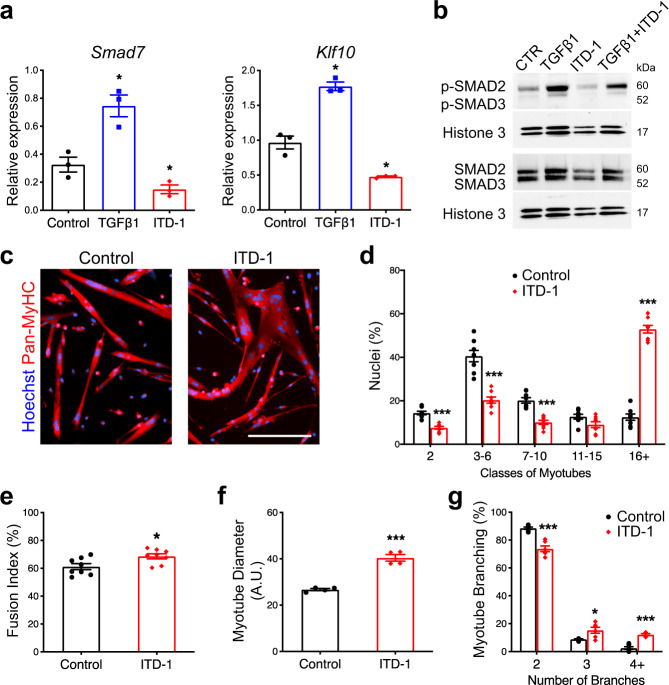
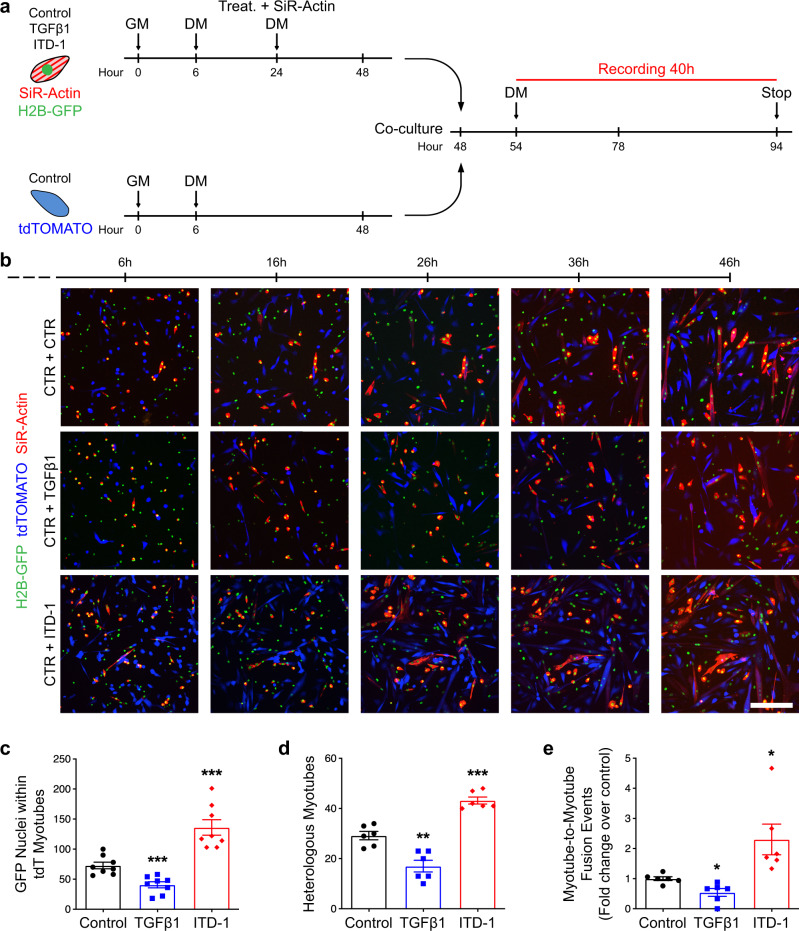
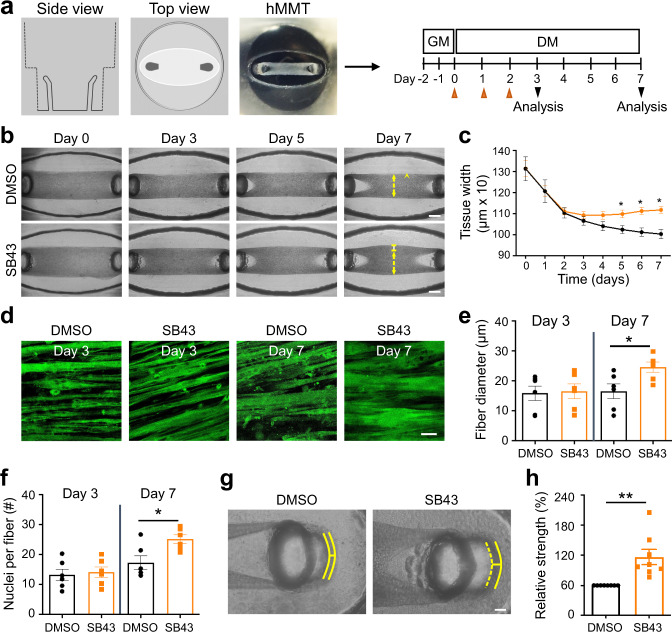
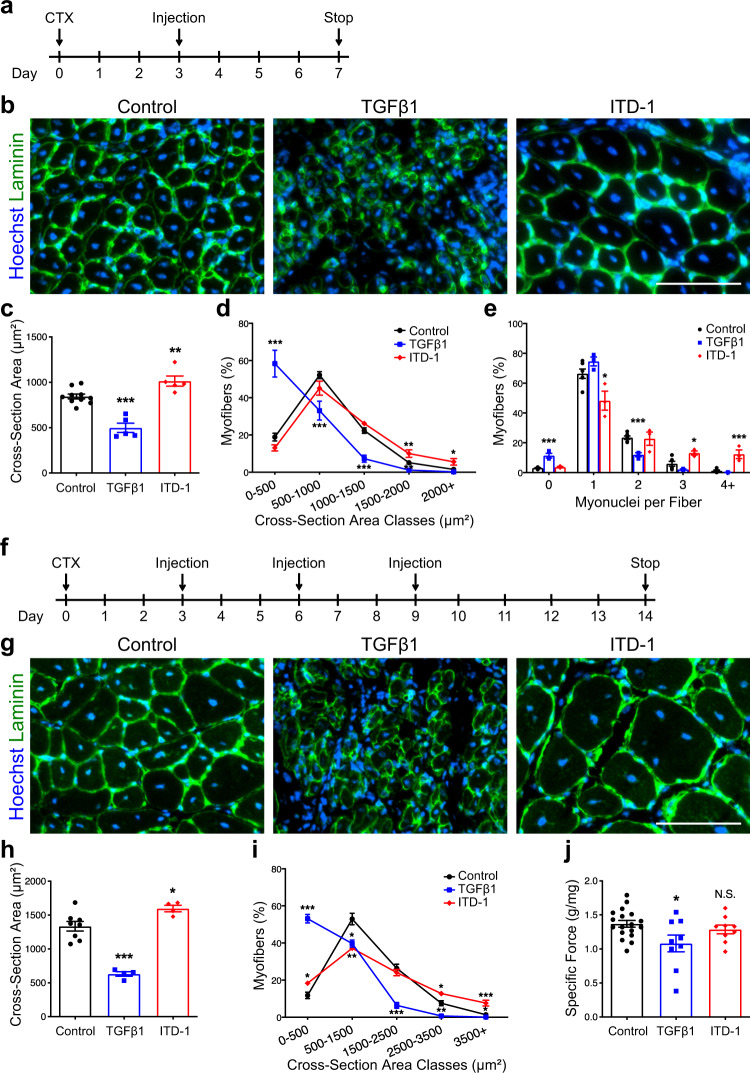
Muscle cell fusion is a multistep process involving cell migration, adhesion, membrane remodeling and actin-nucleation pathways to generate multinucleated myotubes. However, molecular brakes restraining cell-cell fusion events have remained elusive. Here we show that transforming growth factor beta (TGFβ) pathway is active in adult muscle cells throughout fusion. We find TGFβ signaling reduces cell fusion, regardless of the cells' ability to move and establish cell-cell contacts. In contrast, inhibition of TGFβ signaling enhances cell fusion and promotes branching between myotubes in mouse and human. Exogenous addition of TGFβ protein in vivo during muscle regeneration results in a loss of muscle function while inhibition of TGFβR2 induces the formation of giant myofibers. Transcriptome analyses and functional assays reveal that TGFβ controls the expression of actin-related genes to reduce cell spreading. TGFβ signaling is therefore requisite to limit mammalian myoblast fusion, determining myonuclei numbers and myofiber size.


Conflict of interest statement

The authors declare no competing interests.

Figures

Fig. 1
Fig. 1. TGFβ signaling pathway remains active during myoblast differentiation.
a qRT-PCR analysis of Tgfb1, 2, and 3 transcripts expression during in vitro differentiation of primary muscle cells shows different profiles. N = 3 biologically independent experiments for each time point. b qRT-PCR analysis of Alk5 and Tgfbr2 transcript expressions describes a constant expression of the receptors during primary muscle cell differentiation. N = 6 biologically independent experiments for each time point. c qRT-PCR analysis of the TGFβ target gene Smad7 transcript expression reveals a decreased activity of the pathway alongside in vitro primary muscle cell differentiation. N = 3 biologically independent experiments for each time point. d p-SMAD2/3 immunofluorescent staining of proliferating, differentiating, and differentiated primary myoblasts reveals a constant and basal activation of the pathway. N = 3 primary cell cultures. e p-SMAD2/3 and SMAD2/3 western-blot analysis of proliferating, differentiating, and differentiated primary myoblasts confirms a decrease in SMAD2/3 phosphorylation during differentiation. N = 3 biologically independent experiments. Scale bars: d 200 μm. Data are presented as mean ± SEM. Source data are provided as a Source Data file.
Fig. 2
Fig. 2. The state of TGFβ signaling during in vivo muscle regeneration.
ac p-SMAD3, PAX7, and DYSTROPHIN immunofluorescent stainings on 0-, 4-, and 7-day post injury (d.p.i.) regenerating TA muscle cryosections. SMAD3 signaling is active in interstitial cells and PAX7+ cells (white arrows) during muscle regeneration. p-SMAD3 is strongly expressed by myonuclei of the regenerating myofibers marked by DYSTROPHIN at 4 d.p.i. N = 8 cryosections. d p-SMAD3, MYOGENIN, and DYSTROPHIN immunofluorescent staining on 4 d.p.i. regenerating TA muscle cryosections. Myocytes do not express p-SMAD3 at the time of differentiation. N = 8 cryosections. Scale bars: low magnification, 400 μm; high magnification, 100 μm.
Fig. 3
Fig. 3. TGFβ signaling limits cell fusion.
a Experimental scheme. Primary myoblasts seeded at low density (5000 cells/cm2) were differentiated for 2 days, split, and re-plated at high density (75,000 cells/cm2) and cultured for 2 more days. b Immunofluorescent staining for MYOGENIN of primary myocytes pre-differentiated for 48 h and re-plated at high density confirms that >90% of cells express Myogenin. N = 7 biologically independent experiments. c qRT-PCR analysis for Myogenin and Smad7 transcript expression of re-plated primary myocytes cultured for 24 h with or without TGFβ1 recombinant protein. Although TGFβ1 stimulation activates Smad7 expression, it does not affect Myogenin transcript levels. N = 6 primary cell cultures. d Immunofluorescent staining for the MYOSIN HEAVY-CHAIN isoforms (Pan-MyHC) of re-plated primary myocytes cultured for 48 h. e Percentage of Pan-MyHC-expressing cells of re-plated myotubes shows that cells were differentiated in all conditions. N = 5 biologically independent experiments. f Fusion index of re-plated myotubes reveals that TGFβ stimulation inhibits fusion. N = 5 biologically independent experiments. g Percentage of nuclei in the smallest and largest myotube classes. TGFβ-treated myotubes are characterized by less nuclei per myotube. N = 11 (control) and 15 (TGFβ1) biologically independent experiments. Scale bars: b 400 μm; d 200 μm. Data are presented as mean ± SEM. Unpaired two-tailed Student’s t tests were used to compare between data. ** and *** denote a significant difference with the Control group of P < 0.01 and P < 0.001, respectively. NS not significant. Source data are provided as a Source Data file.
Fig. 4
Fig. 4. TGFβ signaling does not affect cell motility and cell–cell contact frequency.
a Experimental scheme. Primary myoblasts seeded at 10,000 cells/cm2 were induced to differentiate with or without TGFβ1 recombinant protein. After 12 h, cells were recorded live for 12 h during early differentiation and for 24 h during late differentiation. b Quantification of the percentage of MYOD1+ nuclei of primary myocytes cultured for 48 h with or without TGFβ1 recombinant protein. N = 3 biologically independent experiments. c qRT-PCR analysis for Myogenin transcript expression of primary myotubes cultured for 60 h with or without TGFβ1 recombinant protein. N = 5 biologically independent experiments. d Brightfield live-imaging frames of differentiating myoblasts confirm that TGFβ stimulation reduces fusion. N = 6 primary cell cultures. e Early differentiation movies were used to quantify cell speed, covered distance and cell–cell contact frequency. None of these parameters were significantly different between control and TGFβ1-treated myoblasts. N = 240 cells for each condition examined over six biologically independent experiments. f Late differentiation movies were used to quantify cell–cell contact frequency, the percentage of cell–cell contacts that result in fusion events and the percentage of cells that make contacts but do not fuse. Although TGFβ1 stimulation does not impair cell–cell contact frequency, many TGFβ1-treated contacting myoblasts make contacts but do not accomplish fusion. N = 240 cells for each condition examined over six biologically independent experiments. Scale bars: d 400 μm. Data are presented as mean ± SEM. Unpaired two-tailed Student’s t tests were used to compare between data. *** denote a significant difference with the Control group of P < 0.0001. NS not significant. Source data are provided as a Source Data file.
Fig. 5
Fig. 5. Inhibition of TGFBR2 function in differentiated muscle cell enhances fusion.
a qRT-PCR analysis of TGFβ target genes transcript expression in primary myocytes treated with TGFβ1 protein or ITD-1 compound proves that Smad7 and Klf10 are over-expressed when the signaling pathway is activated and inhibited when TGFβ cascade is blocked. N = 10 (Control), 8 (TGFβ1), and 8 (ITD-1) biologically independent experiments. b Nuclear p-SMAD2/3 and SMAD2/3 western blot analysis of primary myoblast treated with TGFβ1 protein, ITD-1 compound, or both combined. The intracellular mediators SMAD2/3 are phosphorylated upon TGFβ stimulation, while ITD-1 is able to reduce their phosphorylation. N = 3 biologically independent experiments. c Immunofluorescent staining for Pan-MyHC of re-plated myocytes cultured for 48 h. N = 8 primary cell cultures. d Aggregation index of re-plated myocytes shows that ITD-1 treatment leads to the formation of myotubes with higher numbers of nuclei compared to the control. N = 8 biologically independent experiments. e Fusion index of re-plated myocytes confirms the enhanced fusion when TGFβ cascade is inhibited. N = 8 biologically independent experiments. Diameter of re-plated myotubes (f) and of the distribution of branched-myotubes (g) of re-plated cells highlight aberrant morphology of syncytia treated with ITD-1 N = 4 (f) and 6 (g) biologically independent experiments. Scale bars: c 200 μm. Data are presented as mean ± SEM. Unpaired two-tailed Student’s t tests were used to compare between data. * and *** denote a significant difference with Control group of P < 0.05 and P < 0.001, respectively. Source data are provided as a Source Data file.
Fig. 6
Fig. 6. Live imaging of myoblast fusion.
a Experimental scheme. H2B-GFP primary myoblasts were seeded at low density (5000 cells/cm2), treated with TGFβ1 protein or ITD-1 compound, stained with SiR-Actin, and differentiated for 2 days. Membrane-tdTOMATO primary myoblasts seeded at low density (5000 cells/cm2) and were differentiated for 2 days. Both populations were split and co-cultured (50/50) at high density (75,000 cells/cm2) for 2 more days. In the last 40 h, cells were recorded live by confocal microscopy. b Live-imaging frames of co-cultured pre-differentiated myocytes confirm the phenotype previously observed. TGFβ activation inhibits fusion, while ITD-1 enhance fusion. N = 8 biologically independent primary co-cultures. c Quantification of H2B-GFP nuclei within tdTOMATO myotubes. N = 8 biologically independent experiments. d Quantification of heterologous myotubes (double positive for SiR-Actin and tdTOMATO). N = 6 biologically independent experiments. e Quantification of Myotube-to-Myotube events. ITD-1 treatment allows more myotube-to-myotube events compared to the control. N = 6 biologically independent experiments. Scale bars: b 200 μm. Data are presented as mean ± SEM. Unpaired two-tailed Student’s t tests were used to compare between data. *, **, and *** denote a significant difference with the Control group of P < 0.05, P < 0.01, and P < 0.001 respectively. Source data are provided as a Source Data file.
Fig. 7
Fig. 7. TGFβ inhibition induces human myotube fusion in 3D culture resulting in increased microtissue strength.
a Schematic representation (left) and timeline (right) of 3D human muscle cell experimental approach utilized in panels (bh). Briefly, immortalized human myoblasts are suspended in a fibrin/reconstituted basement membrane protein scaffold and seeded into the bottom of a custom rubber 96-well plate culture device. A side view depicts the vertical posts across which the cells remodel the protein scaffold, align, and fuse to form a 3D human muscle microtissue (hMMT). For the first 2 days of culture (Day −1, Day −2), tissues are maintained in growth media (GM). On Day 0, GM is removed from wells and replaced with differentiation media (DM). TGFBR1 inhibitor SB-431542 (SB43, 10 μM) was included in the DM on Days 0–2 (orange arrowheads) of culture. b Representative bright-field images of 3D hMMT culture over the time course of differentiation treated with SB43 as compared to DMSO-treated control. White arrows demarcate the region of tissues that are assessed in panel (c). c Line graph quantifying hMMT width over the time course of differentiation in DMSO (black line) or SB43 (orange line) conditions. N = 14 (DMSO) and 15 (SB43) biologically independent experiments. d Representative confocal slices of hMMT cultures immunostained for SARCOMERIC α-ACTININ (green) on Days 3 and 7 of culture. e, f Bar graph quantifying muscle fiber diameter (e) and average number of nuclei per fiber (f) at Days 3 and 7 of culture. N = 6 biologically independent experiments for each time point. g Representative brightfield images of hMMTs. Micro-post position before (solid yellow line) and after (dashed yellow line) acetylcholine stimulation is represented. h Bar graph quantifying relative strength of SB43-treated hMMTs compared to DMSO-treated hMMTs. N = 8 biologically independent experiments. Scale bars: b, 500 μm; d 50 μm; g 100 μm. A minimum of 30 microscopic images per culture condition was analyzed. Data are presented as mean ± SEM. Unpaired two-tailed Student’s t tests were used to compare between data. * and ** denote a significant difference with Control group of P < 0.05 and P < 0.01, respectively. Source data are provided as a Source Data file.
Fig. 8
Fig. 8. TGFβ signaling regulates muscle cell fusion in vivo.
a Experimental scheme. Adult murine tibialis anterior (TA) muscles were subjected to CTX injury and regenerating tissues were injected intramuscularly with either TGFβ1 proteins or ITD-1 compound 3 days after damage. b Immunofluorescent staining for LAMININ of 7 days regenerating TA muscles. c Quantification of myofiber size (cross-sectional area, CSA). While the injection of TGFβ strongly reduces fibers size, ITD-1 administration increases fibers size. d Distribution of myofiber CSA. N = 10 (Control), 5 (TGFβ1), and 5 (ITD-1) biologically independent TA muscles. e Distribution of myonuclei per fiber shows that the inhibition of TGFβ cascade leads to the formation of multinucleated myofibers, while TGFβ activation reduces the number of myonuclei per fibers. N = 6 (Control), 3 (TGFβ1), and 3 (ITD-1) biologically independent TA muscles. f Experimental scheme. Adult murine TA muscles were subjected to CTX injury and regenerating tissues were injected with either TGFβ proteins or ITD-1 compound 3, 6, and 9 days after damage. Fourteen days after injury, force measurements were performed, and TA muscles were collected. g Immunofluorescent staining for LAMININ of 14-day regenerating TA muscles. h Quantification of myofiber size confirms the phenotypes observed at 7 d.p.i. N = 8 (Control), 4 (TGFβ1), and 4 (ITD-1) biologically independent TA muscles. i Distribution of myofiber CSA. N = 8 (Control), 4 (TGFβ1), and 4 (ITD-1) biologically independent TA muscles. j Specific force measurement of regenerating muscles. While TGFβ1-treated muscles are weaker compared to the control, ITD-1-injected muscles show no differences. N = 18 (Control), 9 (TGFβ1), and 9 (ITD-1) biologically independent TA muscles. Scale bars: b, g, 100 μm. Data are presented as mean ± SEM. Unpaired two-tailed Student’s t tests were used to compare between data. *, **, and *** denote a significant difference with control group of P < 0.05, P < 0.01, and P < 0.001, respectively. Control represents mock-treated contralateral TA muscle. Source data are provided as a Source Data file.
Fig. 9
Fig. 9. Fusogenic actin remodeling is controlled by TGFβ signaling.
Transcriptomic analysis was performed on differentiated myocytes treated with either TGFβ1 or ITD1. N = 3 biologically independent experiments. a Heatmaps of TGFβ target genes, myogenic genes, and fusion genes. b Volcano plot showing the Ingenuity Pathway Analysis (IPA). Among the top modulated pathways, Actin Signaling Pathway is highlighted. c Phalloidin staining of 1-day differentiated myocytes. These pictures were analyzed with OrientationJ (ImageJ Plug-in) to obtain a color-coded orientation mask. N = 8 primary cell cultures. d Average cell spread quantification. TGFβ1 treatment reduces cell size; ITD-1 promotes cell spreading. N = 8 primary cell cultures. e Quantification of orientation coherency of the actin fibers. Both treatments reduce coherency compared to the control. N = 150 cells for each condition examined over six biologically independent experiments. f Quantification of cell–cell contact frequency. N = 240 cells for each condition examined over six biologically independent experiments. g Immunofluorescent staining for Pan-MyHC of re-plated primary myotubes cultured for 48 h with ITD-1, Latrunculin, or both. N = 5 primary cell cultures. h Fusion index of re-plated myotubes shows that Latrunculin significantly reduces the parameter when administrated. N = 5 biologically independent experiments. i Percentage of nuclei in the smallest myotube classes. ITD-1-treated myotubes are characterized by a lower number of nuclei in the smallest myotubes, while Latrunculin increases the percentage of nuclei in small myotubes when administrated alone or together with ITD-1. N = 5 biologically independent experiments. j Percentage of nuclei in the biggest myotube classes. ITD-1 strongly increases the number of nuclei in big myotubes, but Latrunculin blunts this effect, reducing the percentage. N = 5 biologically independent experiments. Scale bars: c 40 μm; g 200 μm. Data are presented as mean ± SEM. Unpaired two-tailed Student’s t tests were used to compare between data. *, **, and *** denote a significant difference with the Control group of P < 0.05, P < 0.01, and P < 0.001 respectively. #, ##, and ### denote a significant difference with ITD-1 group of P < 0.05, P < 0.01, and P < 0.001, respectively. NS not significant. Source data are provided as a Source Data file.

References

    1. Mauro A. Satellite cell of skeletal muscle fibers. J. Biophys. Biochem. Cytol. 1961;9:493–495. doi: 10.1083/jcb.9.2.493. - DOI - PMC - PubMed
    1. Yin H, Price F, Rudnicki MA. Satellite cells and the muscle stem cell niche. Physiol. Rev. 2013;93:23–67. doi: 10.1152/physrev.00043.2011. - DOI - PMC - PubMed
    1. Egner IM, Bruusgaard JC, Gundersen K. Satellite cell depletion prevents fiber hypertrophy in skeletal muscle. Development. 2016;143:2898–2906. doi: 10.1242/dev.134411. - DOI - PubMed
    1. Goh, Q. & Millay, D. P. Requirement of myomaker-mediated stem cell fusion for skeletal muscle hypertrophy. eLife6, e20007 (2017). - PubMed
    1. Millay DP, Sutherland LB, Bassel-Duby R, Olson EN. Myomaker is essential for muscle regeneration. Genes Dev. 2014;28:1641–1646. doi: 10.1101/gad.247205.114. - DOI - PMC - PubMed

Publication types

MeSH terms

Substances