. 2021 Feb 2;12(1):755.
doi: 10.1038/s41467-020-20793-x.

Host immunity modulates the efficacy of microbiota transplantation for treatment of Clostridioides difficile infection

Affiliations

Host immunity modulates the efficacy of microbiota transplantation for treatment of Clostridioides difficile infection

Eric R Littmann et al. Nat Commun. .

Abstract

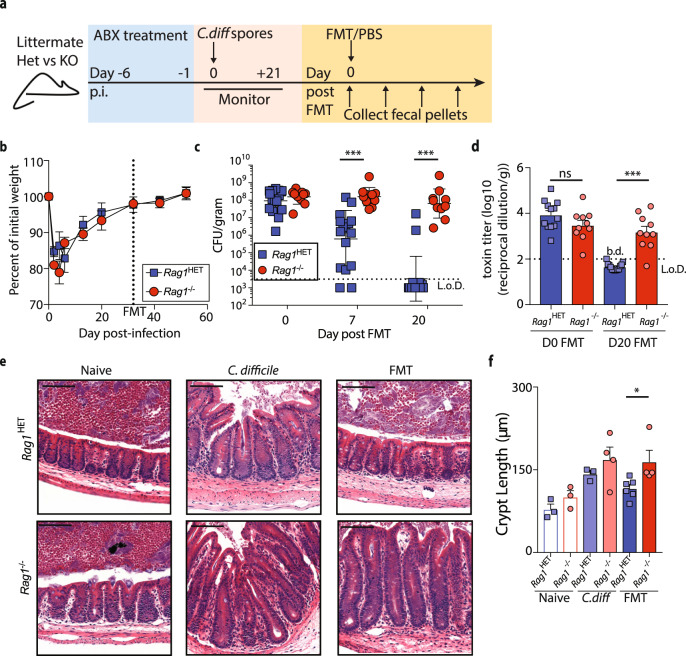
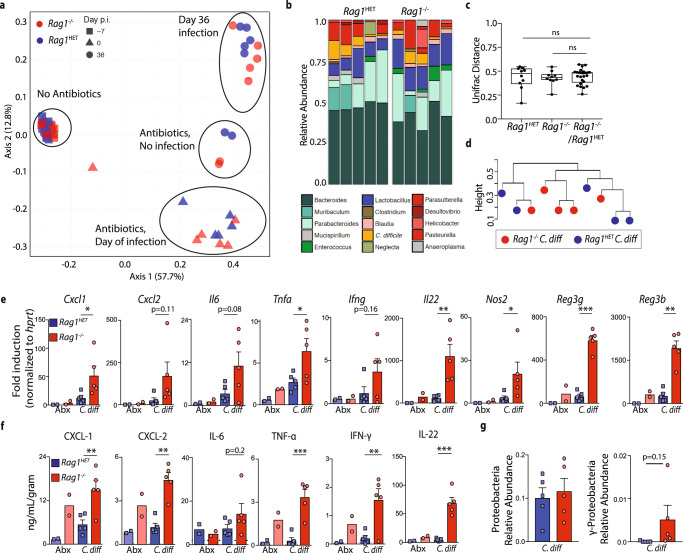
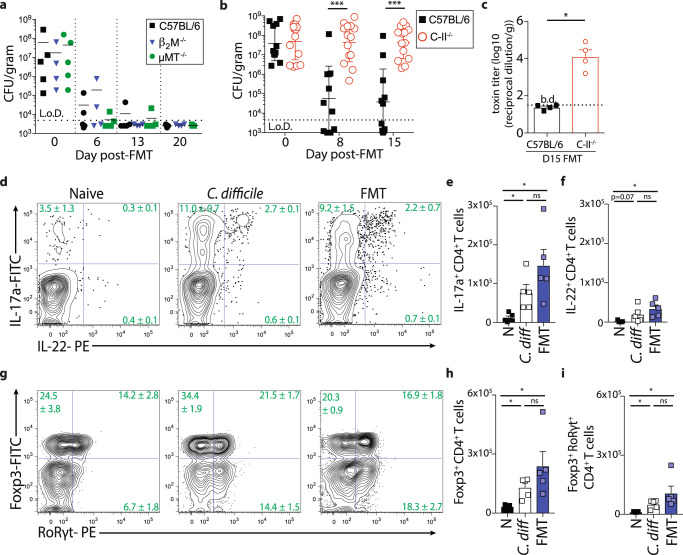
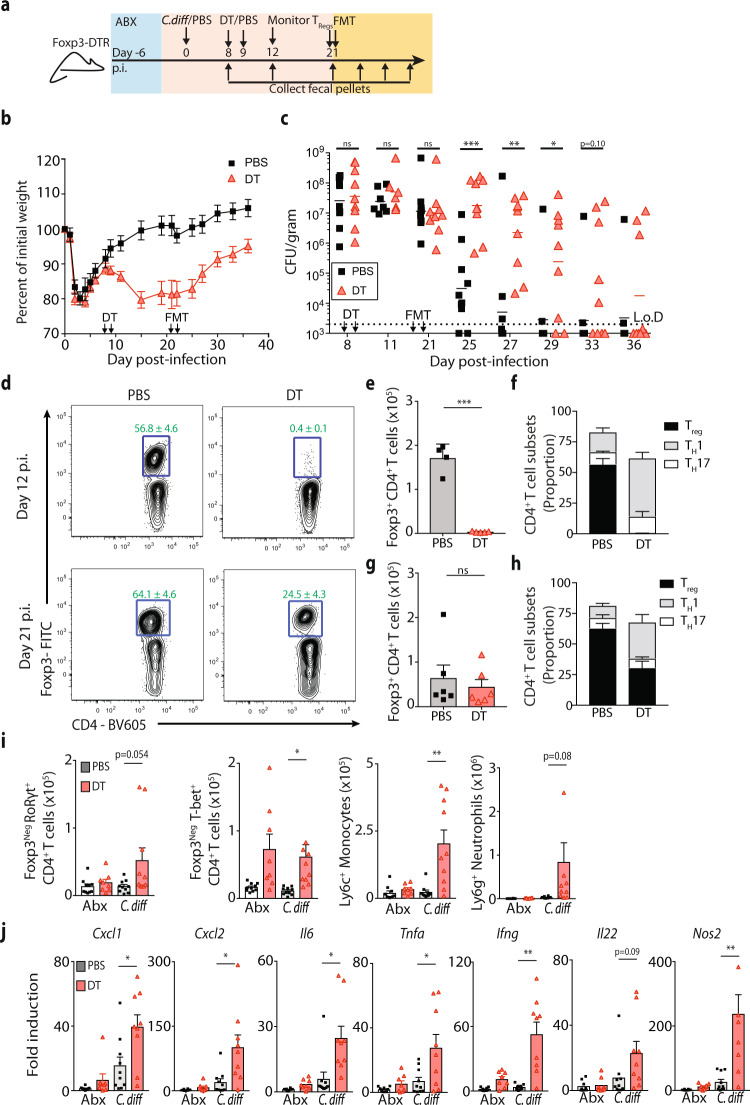
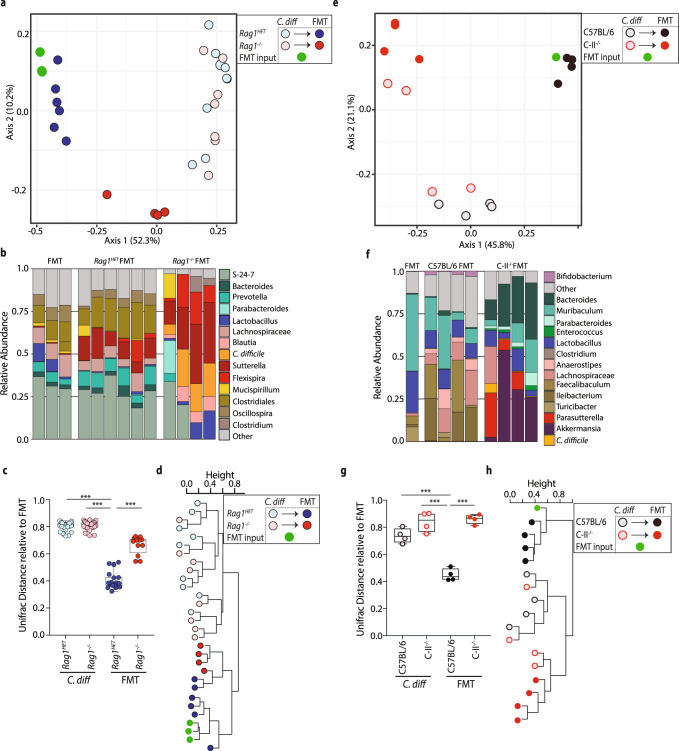
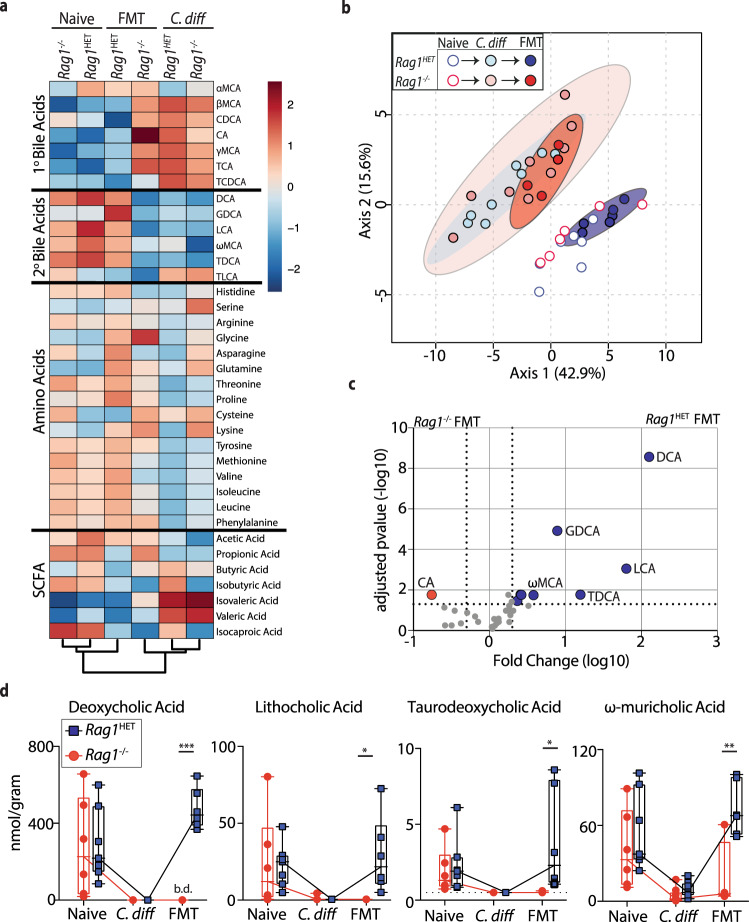
Fecal microbiota transplantation (FMT) is a successful therapeutic strategy for treating recurrent Clostridioides difficile infection. Despite remarkable efficacy, implementation of FMT therapy is limited and the mechanism of action remains poorly understood. Here, we demonstrate a critical role for the immune system in supporting FMT using a murine C. difficile infection system. Following FMT, Rag1 heterozygote mice resolve C. difficile while littermate Rag1-/- mice fail to clear the infection. Targeted ablation of adaptive immune cell subsets reveal a necessary role for CD4+ Foxp3+ T-regulatory cells, but not B cells or CD8+ T cells, in FMT-mediated resolution of C. difficile infection. FMT non-responsive mice exhibit exacerbated inflammation, impaired engraftment of the FMT bacterial community and failed restoration of commensal bacteria-derived secondary bile acid metabolites in the large intestine. These data demonstrate that the host's inflammatory immune status can limit the efficacy of microbiota-based therapeutics to treat C. difficile infection.


Conflict of interest statement

The authors declare no competing interests.

Figures

Fig. 1
Fig. 1. Immunodeficient Rag1−/− mice exhibit impaired resolution of C. difficile infection following FMT.
a Schematic of antibiotic (ABX) treatment, C. difficile infection, and FMT. b Weight loss following infection in littermate, antibiotic-treated RagHET (n = 6) and Rag1−/− (n = 5) mice. Data is representative of three independent experiments. Data are presented as mean values ± SEM. c C. difficile burden and d toxin B levels in the fecal pellets of Rag1−/− (n = 10) and Rag1HET (n = 14) mice following FMT. Data is a combination of three independent experiments. Statistical significance was calculated by a two-sided unpaired t-test. ***p < 0.0001. Data are presented as mean values ± SEM. e H&E stained cecal tissue sections and f mean crypt length from naïve, C. difficile-infected PBS treated, or C. difficile-infected FMT-treated Rag1HET and Rag1−/− mice. n = 3 naïve Rag1HET and Rag1−/− mice; n = 3 C. difficile-infected PBS treated Rag1HET mice; n = 4 C. difficile-infected PBS treated Rag1−/− mice; n = 6 C. difficile-infected FMT-treated Rag1HET mice; n = 4 C. difficile-infected FMT-treated Rag1−/− mice. Scale bar = 100 μm. Data is representative of two independent experiments. Statistical significance was calculated by a two-sided unpaired Mann–Whitney test; *p = 0.01 Data are presented as mean values ± SEM. b.d. below detection.
Fig. 2
Fig. 2. C. difficile-infected Rag1−/− and Rag1HET mice exhibit enhanced induction of proinflammatory immune response genes.
a Unweighted UniFrac principal coordinate analysis plot of 16S bacterial rRNA ASVs from fecal pellets of Rag1−/− and Rag1HET mice prior to ABX treatment, at day 0 of infection, and at day 36 post-C. difficile infection or ABX-treatment alone. Ellipses signify different experimental groups. b Relative abundance of top 15 bacterial ASVs from C. difficile-infected of Rag1−/− and Rag1HET mice at day 36 p.i. Bar plot is displayed at the genus level except for orange bars that represent an ASV aligning to C. difficile. c Unweighted UniFrac distance comparing the microbiota beta diversity dissimilarity within and between C. difficile-infected Rag1−/− and Rag1HET groups at day 36 p.i. One-way ANOVA conducted for statistical comparison. Boxes represent median, first and third quartile. Whiskers extend to the highest and lowest data point. d Dendrogram representation of intestinal microbial communities of C. difficile-infected of Rag1−/− and Rag1HET mice at day 36 p.i. using unsupervised hierarchical clustering of unweighted UniFrac distances to identify similarities between samples. e mRNA expression of proinflammatory immune response genes in whole colon tissue as assessed by qRT-PCR. Gene expression relative to ABX-treated Rag1HET mice and normalized to Hprt. Statistical significance was calculated by a two-sided unpaired t-test. *p < 0.05, **p < 0.01. Data are presented as mean values ± SEM. f Proinflammatory cytokine and chemokine protein levels in cecal tissue homogenates. Statistical significance was calculated by a two-sided unpaired t-test. *p < 0.05, **p < 0.01, ***p < 0.001. Data are presented as mean values ± SEM. g Relative abundance of Proteobacteria and gamma-Proteobacteria ASVs in fecal pellets of Rag1−/− and Rag1HET mice at day 36 p.i. Statistical significance was calculated by a two-sided unpaired t test. Data are presented as mean values ± SEM. Data presented in figure are representative of three independent experiments. Prior to ABX treatment (n = 10 Rag1−/−; n = 12 Rag1HET mice), day 0 of infection (n = 6 Rag1−/−; n = 5 Rag1HET mice), day 36 post-C. difficile (n = 5 Rag1−/− and Rag1HET mice) or ABX-treatment alone (n = 2 Rag1−/− and Rag1HET mice).
Fig. 3
Fig. 3. CD4+ T cells support FMT-mediated resolution of C. difficile infection.
a Cohoused C57BL/6, μMT−/−, β2M−/− mice were infected with C. difficile and bacterial burden was assessed in the fecal pellets following FMT. n = 5 C57BL/6; n = 4 β2M−/−; n = 5 μMT−/− mice. Data is representative of two independent experiments. b C. difficile burden in fecal pellets of cohoused C57BL/6 (n = 11) and C-II−/− (n = 14) mice following FMT. Data is a combination of three independent experiments. Statistical significance was calculated by a two-sided unpaired t-test. ***p < 0.0001. Data are presented as mean values ± SEM. c Toxin titers in the cecal content at day 15 post-FMT. n = 4 mice per group. Statistical significance was calculated by two-sided Mann–Whitney test. *p = 0.029. Data are presented as mean values ± SEM. df Single cell suspensions isolated from the large intestine lamina propria of naïve, C. difficile infected, or C. difficile-infected FMT-treated C57BL/6 mice were stimulated ex vivo with PMA/Ionomycin in the presence of BFA and assessed for cytokine production. d Frequency and total number of e IL-17a or f IL-22 competent CD4+ T cells. FACS plots gated on live, CD45+, CD3ε+, CD4+ cells. Gating strategy shown in Supplemental Fig. 13. gi Intranuclear transcription factor staining of cells isolated from the large intestine lamina propria of naïve, C. difficile infected, or C. difficile-infected FMT-treated C57BL6 mice. g Frequency and total number of h Foxp3+ or i Foxp3+ RoRγt+ CD4+ T cells. FACS plots gated on live, CD45+, CD3ε+, CD4+ cells. Data in di are representative of two independent experiments. Statistical significance was calculated by a two-sided unpaired t-test. n = 5 mice per group. e (N vs. C. diff *p = 0.014; N vs FMT *p = 0.011. f, N vs FMT *p = 0.007. h, N vs. C. diff *p = 0.003; N vs FMT *p = 0.021. i N vs. C. diff *p = 0.004; N vs FMT *p = 0.028) Data are presented as mean values ± SEM. *p < 0.05, **p < 0.01, ***p < 0.001. b.d. below detection.
Fig. 4
Fig. 4. Treg cell depletion impairs FMT-mediated resolution of C. difficile infection.
a Schematic of C. difficile infection, Treg cell depletion and FMT in Foxp3DTR mice. b Weight loss of C. difficile infected Foxp3DTR mice following DT (n = 7) or PBS (n = 7) administration. Data are presented as mean values ± SEM. c C. difficile burden in the feces of Foxp3DTR mice following DT or PBS administration and FMT. n = 9 mice per group. Data is a combination of three independent experiments. Statistical significance was calculated by a two-sided unpaired t-test. *p = 0.015, **p = 0.001, ***p < 0.0001. d Frequency of Foxp3+ CD4+ T cells in the large intestine lamina propria of Foxp3DTR mice at day 12 p.i. (day 4 post-DT treatment) or day 21 p.i. (day of FMT). n = 4–6 mice per group. FACS plots gated on live, CD45+, CD3ε+, CD4+ cells. Gating strategy shown in Supplemental Fig. 13. e Total number of Foxp3+ CD4+ T cells and f relative proportion of CD4+ T cell subsets in the large intestine lamina propria at day 12 p.i. (day 4 post-DT treatment). n = 4 PBS- treated Foxp3DTR mice; n = 5 DT-treated Foxp3DTR mice. Statistical significance was calculated by a two-sided Mann–Whitney test. ***p < 0.0001. Data are presented as mean values ± SEM. g Total number of Foxp3+ CD4+ T cells and h relative proportion of CD4+ T cell subsets in the large intestine lamina propria at day 21 p.i. (day of FMT). n = 6 PBS & DT-treated Foxp3DTR mice. Statistical significance was calculated by a two-sided unpaired Mann-Whitney test. Data are presented as mean values ± SEM. i Total number of TH17 cells, TH1 cells, inflammatory monocytes, and neutrophils in the large intestine lamina propria at day 21 p.i. (day of FMT). n = 10 uninfected PBS-treated Foxp3DTR mice; n = 8 uninfected DT-treated Foxp3DTR mice; n = 10 C. difficile infected PBS-treated Foxp3DTR mice; n = 10 C. difficile infected DT-treated Foxp3DTR mice examined over three independent experiments. Statistical significance was calculated by two-sided unpaired t-test. *p = 0.013, **p = 0.002 Data are presented as mean values ± SEM. j mRNA expression of proinflammatory immune response genes in whole colon tissue as assessed by qRT-PCR. Gene expression relative to ABX-treated, uninfected Foxp3DTR mice and normalized to Hprt. n = 10 uninfected PBS-treated Foxp3DTR mice; n = 8 uninfected DT-treated Foxp3DTR mice; n = 10 C. difficile infected PBS-treated Foxp3DTR mice; n = 9 C. difficile infected DT-treated Foxp3DTR mice examined over three independent experiments. Statistical significance was calculated by two-sided unpaired t-test. *p < 0.05, **p < 0.01. Data are presented as mean values ± SEM.
Fig. 5
Fig. 5. C. difficile-infected Rag1−/− and C-II−/− mice exhibit impaired FMT engraftment.
C. difficile-infected (ad) Rag1−/− and Rag1HET mice or (eh) C57BL/6 and C-II−/− mice were administered a FMT and microbial composition was analyzed. a Unweighted UniFrac principal coordinate analysis plot of 16S bacterial rRNA ASVs from the FMT inoculum, fecal pellets of C. difficile infected Rag1−/− and Rag1HET mice at the time of FMT, and cecal content of Rag1−/− and Rag1HET mice at day 21 post-FMT. b Relative abundance of top 15 bacterial ASVs in the microbiota of C. difficile-infected FMT-treated Rag1−/− and Rag1HET mice (day 21 post-FMT) Bar plot is displayed at the genus level except for orange bars that represent an ASV aligning to C. difficile. c Unweighted UniFrac distance comparing the microbiota beta diversity dissimilarity of Rag1−/− and Rag1HET groups to FMT inoculum. n = 9 C. diff. Rag1HET; n = 8 C. diff. Rag1−/−; n = 6 FMT Rag1HET; n = 4 FMT Rag1−/− mice. Statistical significance was calculated by one-way ANOVA test using Dunnett method for multiple comparison adjustments. ***p < 0.0001. Boxes represent median, first and third quartile. Whiskers extend to the highest and lowest data point. d Dendrogram representation of intestinal microbial communities of FMT inoculum, Rag1−/− and Rag1HET groups using unsupervised hierarchical clustering of unweighted UniFrac distances to identify similarities between samples. e Unweighted UniFrac principal coordinate analysis plot of 16S bacterial rRNA ASVs from the FMT inoculum and fecal pellets from C. difficile infected C57BL/6 and C-II−/− mice at time of FMT and day 15 post-FMT. f Relative abundance of top 15 bacterial ASVs in the microbiota of C. difficile-infected FMT-treated C57BL/6 and C-II−/− mice (day 15 post-FMT). Bar plot is displayed at the genus level except for orange bars that represent an ASV aligning to C. difficile. g Unweighted UniFrac distance comparing the microbiota beta diversity dissimilarity of C57BL/6 and C-II−/− groups to FMT inoculum. n = 4 mice per group . Statistical significance was calculated by a one-way ANOVA test using Dunnett method for multiple comparison adjustments. ***p < 0.0001. Boxes represent median, first and third quartile. Whiskers extend to the highest and lowest data point. h Dendrogram representation of intestinal microbial communities of FMT inoculum, C57BL/6 and C-II−/− groups using unsupervised hierarchical clustering of unweighted UniFrac distances to identify similarities between samples. Data are presented as mean values ± SEM. ***p < 0.001.
Fig. 6
Fig. 6. FMT non-responsive Rag1−/− mice fail to restore their intestinal metabolite profile to pre-infection conditions.
C. difficile-infected Rag1−/− and Rag1HET mice were administered FMT or PBS, sacrificed 21 days later along with naïve mice and amino acid, short chain fatty acid (SCFA), 1° and 2° bile acid pools were analyzed in cecal content. a Heatmap of relative concentration of amino acids, SCFA, 1° and 2° bile acids in cecal content of naïve (n = 5), C. difficile-infected (n = 6) or C. difficile-infected FMT-treated (n = 4 Rag1−/−; n = 6 Rag1HET mice). b Principal coordinate analysis plot comparing metabolite profile in the cecum of naïve, C. difficile-infected, and C. difficile-infected FMT-treated Rag1−/− and Rag1HET mice. Ellipses represent 95% confidence intervals. c Volcano plot of metabolites in the cecum of C. difficile-infected FMT-treated Rag1−/− and Rag1HET mice. Blue circles indicate metabolites enriched in Rag1HET mice. Red circles indicate metabolites enriched in Rag1−/− mice. Significance threshold criteria set at a two-fold change in concentration and an adjusted p-value of 0.05 using an unpaired t-test and adjusted for false discovery rate. d Concentration of individual 2° bile acids. n = 5 naïve Rag1−/− and Rag1HET mice; n = 6 C. difficile-infected Rag1−/− and Rag1HET mice; n = 4 C. difficile-infected FMT-treated Rag1−/−; n = 6 C. difficile-infected FMT-treated Rag1HET mice examined over two independent experiments. Statistical significance was calculated by a one-way ANOVA using Dunnett method for multiple comparison adjustments. DCA ***p < 0.0001, LCA *p = 0.043, TDCA *p = 0.014, ωMCA **p = 0.002. Boxes represent median, first and third quartile. Whiskers extend to the highest and lowest data point. *p < 0.05, **p < 0.01, ***p < 0.001. TCDCA taurochenodeoxycholic acid, αMCA alphamuricholic acid, βMCA betamuricholic acid, γMCA gammamuricholic acid, CDCA chenodeoxycholic acid, TCA taurocholic acid, CA cholic acid, TLCA taurolithocholic acid, TDCA taurodeoxycholic acid, GDCA glycodeoxycholic acid, LCA lithocholic acid, ωMCA omegamuricholic acid, DCA deoxycholic acid. b.d. below detection.

References

    1. Kau AL, Ahern PP, Griffin NW, Goodman AL, Gordon JI. Human nutrition, the gut microbiome and the immune system. Nature. 2011;474:327–336. doi: 10.1038/nature10213. - DOI - PMC - PubMed
    1. Kamada N, Seo SU, Chen GY, Nunez G. Role of the gut microbiota in immunity and inflammatory disease. Nat. Rev. Immunol. 2013;13:321–335. doi: 10.1038/nri3430. - DOI - PubMed
    1. Gopalakrishnan V, Helmink BA, Spencer CN, Reuben A, Wargo JA. The influence of the gut microbiome on cancer, immunity, and cancer immunotherapy. Cancer Cell. 2018;33:570–580. doi: 10.1016/j.ccell.2018.03.015. - DOI - PMC - PubMed
    1. Hartstra AV, Bouter KE, Backhed F, Nieuwdorp M. Insights into the role of the microbiome in obesity and type 2 diabetes. Diabetes Care. 2015;38:159–165. doi: 10.2337/dc14-0769. - DOI - PubMed
    1. Bashiardes S, Tuganbaev T, Federici S, Elinav E. The microbiome in anti-cancer therapy. Semin. Immunol. 2017;32:74–81. doi: 10.1016/j.smim.2017.04.001. - DOI - PubMed

Publication types

MeSH terms