. 2021 Feb 2;12(1):741.
doi: 10.1038/s41467-021-21043-4.

Tumour heterogeneity and intercellular networks of nasopharyngeal carcinoma at single cell resolution

Affiliations

Tumour heterogeneity and intercellular networks of nasopharyngeal carcinoma at single cell resolution

Yang Liu et al. Nat Commun. .

Abstract

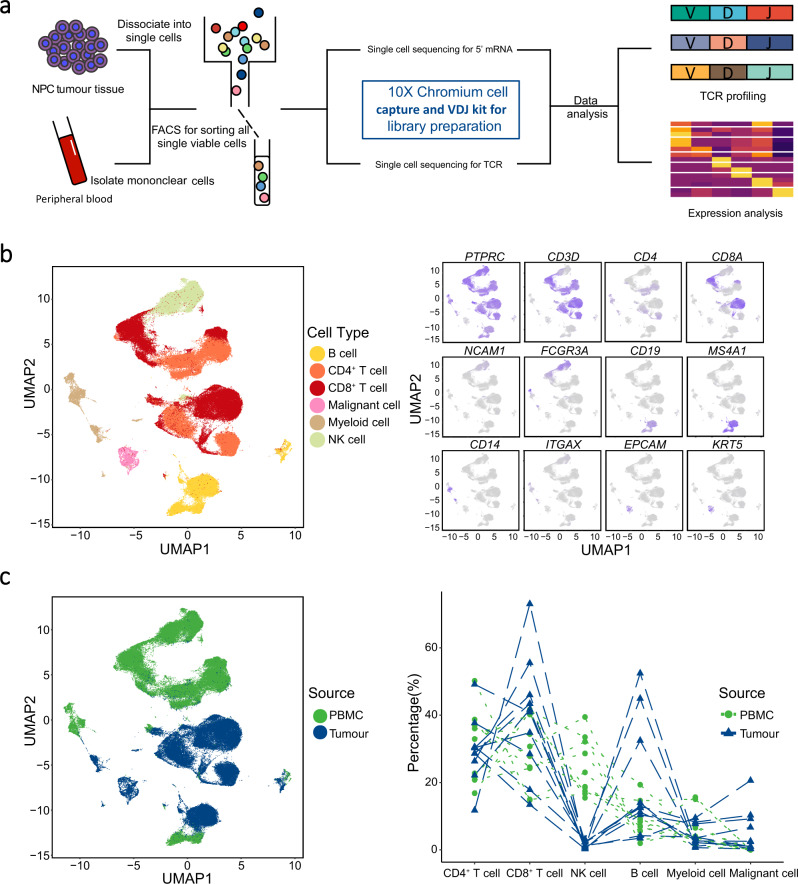
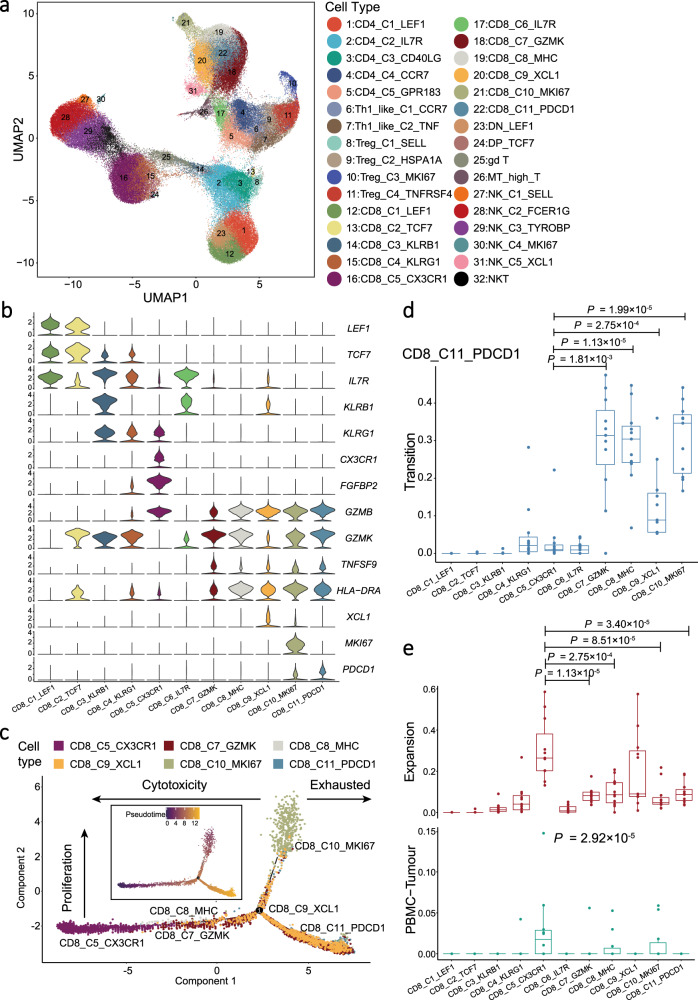
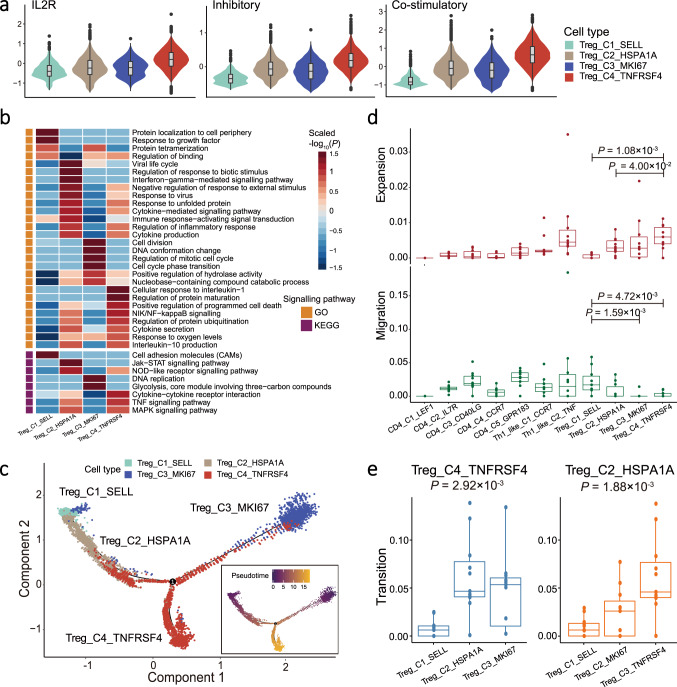
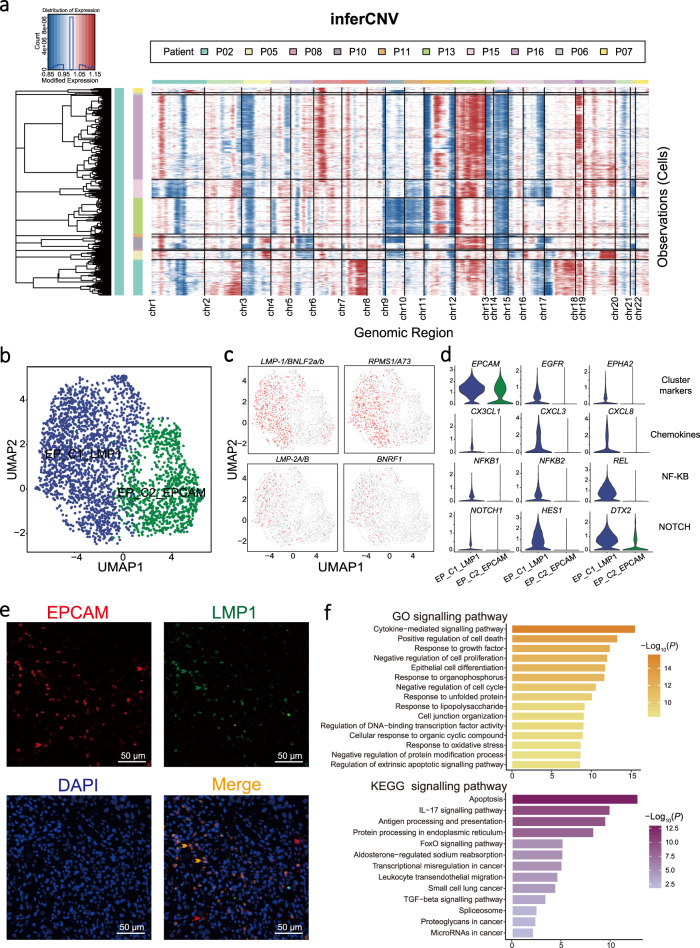
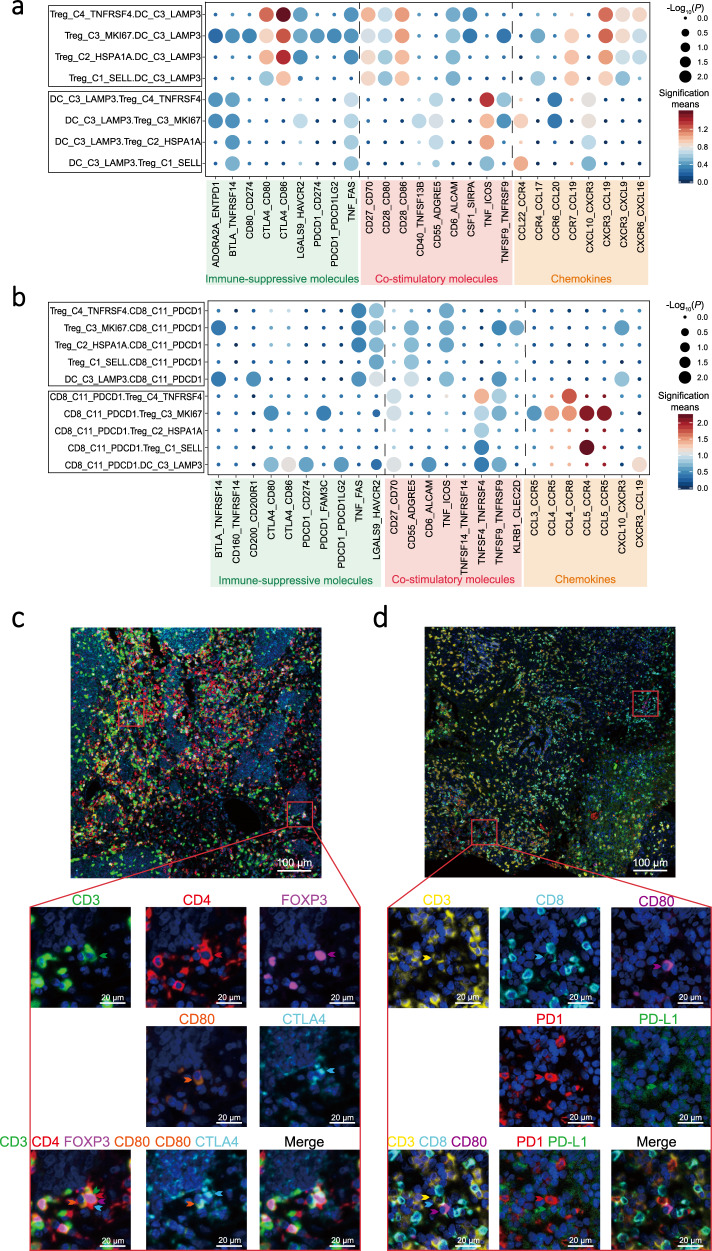
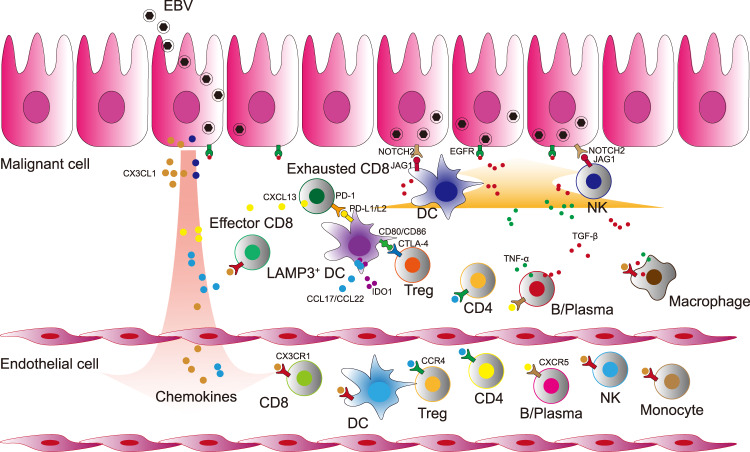
The heterogeneous nature of tumour microenvironment (TME) underlying diverse treatment responses remains unclear in nasopharyngeal carcinoma (NPC). Here, we profile 176,447 cells from 10 NPC tumour-blood pairs, using single-cell transcriptome coupled with T cell receptor sequencing. Our analyses reveal 53 cell subtypes, including tumour-infiltrating CD8+ T, regulatory T (Treg), and dendritic cells (DCs), as well as malignant cells with different Epstein-Barr virus infection status. Trajectory analyses reveal exhausted CD8+ T and immune-suppressive TNFRSF4+ Treg cells in tumours might derive from peripheral CX3CR1+CD8+ T and naïve Treg cells, respectively. Moreover, we identify immune-regulatory and tolerogenic LAMP3+ DCs. Noteworthily, we observe intensive inter-cell interactions among LAMP3+ DCs, Treg, exhausted CD8+ T, and malignant cells, suggesting potential cross-talks to foster an immune-suppressive niche for the TME. Collectively, our study uncovers the heterogeneity and interacting molecules of the TME in NPC at single-cell resolution, which provide insights into the mechanisms underlying NPC progression and the development of precise therapies for NPC.


Conflict of interest statement

The authors declare no competing interests.

Figures

Fig. 1
Fig. 1. The landscape profiling of single cells in NPC tumours and matching PBMC.
a An experimental scheme diagram highlights the overall study design. Single viable cells were collected using flow cytometry sorting (FACS) and subjected for cell barcoding. The cDNA libraries of 5’-mRNA expression and TCR were constructed independently, followed by high throughput sequencing and downstream analyses. b UMAP plot of 176,447 single cells grouped into six major cell types (left panel) and the normalised expression of marker genes for each cell type (right panel). Each dot represents one single cell, coloured according to cell type (left panel), and the depth of colour from grey to blue represents low to high expression (right panel). c UMAP plot of the above single cells coloured according to their origins from peripheral blood or tumour (left panel), and the fraction of cell types originating from each patient (right panel). Each dot represents one single cell, coloured according to sample origin.
Fig. 2
Fig. 2. Expression profile and development of CD8+ T cells.
a UMAP plot of 141,875 T and NK cells grouped into 32 cell types. Each dot represents a cell, coloured according to the cell types indicated at the right legend. b Violin plots showed the normalised expression of CD8+ T cell markers (rows) in each CD8+ T cell cluster (columns). Cell clusters and the expression level of a gene are indicated at the x- and y-axis, respectively. c Pseudotime trajectory analysis of selected CD8+ T cells (CD8_C5, CD8_C7, CD8_C8, CD8_C9, CD8_C10, and CD8_C11; n = 10,000) with high variable genes. Each dot represents one single cell, coloured according to its cluster label. The inlet plot showed each cell with a pseudotime score from dark blue to yellow, indicating early and terminal states, respectively. For CD8+ T cell clusters, 10,000 cells were randomly selected for the analysis. d Box plots showed the transition-index scores of exhausted CD8+ T cells (CD8_C11_PDCD1) and other CD8+ T cells (n = 10). Comparison was made using a two-sided Wilcoxon test. Cell clusters and transition-index scores are indicated at the x- and y-axis, respectively. Endpoints depict minimum and maximum values; centre lines denote median values; whiskers denote 1.5× the interquartile range; coloured dots denote each patient. e Box plots showed the expansion- (top panel) and PBMC-Tumour migration-index (bottom panel) scores of each CD8+ T cell cluster (n = 10). Each comparison was made using either a two-sided Wilcoxon test (top panel) or Kruskal–Wallis test (bottom panel). Cell clusters are indicated at the x-axis, and the y-axis shows the expansion- and PBMC-Tumour migration-index scores at the top and bottom panel, respectively. Endpoints depict minimum and maximum values; centre lines denote median values; whiskers denote 1.5× the interquartile range; coloured dots denote each patient.
Fig. 3
Fig. 3. Expression profile and development of Treg cells.
a Violin plots showed the IL2R (left panel), inhibitory (middle panel), and co-stimulatory (right panel) scores for each Treg cell cluster (n = 11,631). Box plots inside the violins indicated the quartiles of corresponding score levels. Endpoints depict minimum and maximum values; centre lines denote median values; whiskers denote 1.5× the interquartile range; black dots denote each cell. Violin plots are coloured according to cell types, and signature scores are indicated at the y-axis. b Heatmap showed the selected signalling pathways (rows) that were significantly enriched in GO and KEGG analyses for each Treg cell cluster (columns). Filled colours from blue to red represent scaled expression levels (normalised −log10P values) from low to high. P values were calculated by one-sided hypergeometric test and adjusted for multiple comparisons. Orange and purple squares on the left column represent the results derived from GO and KEGG signalling pathways analysis, respectively. c Pseudotime trajectory analysis of Treg cells (Treg_C1, Treg_C2, Treg_C3, and Treg_C4; n = 11,631) with high variable genes. Each dot represents one single cell, coloured according to its cluster label. The inlet plot showed each cell with a pseudotime score from dark blue to yellow, indicating early and terminal states, respectively. d Box plots showed the expansion- (top panel) and migration-index (bottom panel) scores of each CD4+ T cell cluster (n = 10). Comparison was made using two-sided Wilcoxon test. Cell clusters are indicated at the x-axis, and the y-axis shows the expansion- or migration-index at the top or bottom panel, respectively. Endpoints depict minimum and maximum values; centre lines denote median values; whiskers denote 1.5× the interquartile range; coloured dots denote each patient. e Box plots showed the transition-index scores of Treg_C4_TNFRSF4 (left panel) and Treg_C2_HSPA1A (right panel) with other Treg cells (n = 10). Comparison was made using two-sided Kruskal-Wallis test. Cell clusters and the transition-index scores are indicated at the x- and y-axis, respectively. Endpoints depict minimum and maximum values; centre lines denote median values; whiskers denote 1.5× the interquartile range; coloured dots denote each patient.
Fig. 4
Fig. 4. Expression and development of dendritic cells.
a UMAP plot of 8,893 myeloid cells grouped into 10 cell types. Each dot represents a cell, coloured according to cell types. b Heatmap showed the normalised mean expression of genes associated with maturation, activation, migration, and chemokine ligand (rows) in three dendritic cell clusters (DC_C1, DC_C2, and DC_C3; columns). Filled colours from black to yellow represent scaled gene expression levels from low to high. c Heatmap showed the selected signalling pathways (rows) with significant enrichment of GO and KEGG terms for three dendritic cell clusters (DC_C1, DC_C2, and DC_C3; columns). Filled colours from blue to red represent scaled expression levels (normalised −log10P values) from low to high. P-values were calculated by one-sided hypergeometric test and adjusted for multiple comparisons. Orange and purple squares on the left column represent the results derived from GO and KEGG signalling pathways analysis, respectively. d Violin plots showed the differentiation, apoptosis, antigen presentation, and dysfunction scores of three dendritic cell cluster (DC_C1, DC_C2, and DC_C3; n = 1134). Box plots inside the violins indicated the quartiles of corresponding score levels. Endpoints depict minimum and maximum values; centre lines denote median values; whiskers denote 1.5 × the interquartile range; black dots denote each cell. Cell clusters and the signature scores are indicated at the x- and y-axis, respectively. e Pseudotime trajectory analysis of three dendritic cell clusters (DC_C1, DC_C2, and DC_C3; n = 1134) with high variable genes. Each dot represents one single cell, coloured according to its cluster label. The inlet plot showed each cell with a pseudotime score from dark blue to yellow, indicating early and terminal states, respectively. f Venn diagram showed overlapped transcription factors regulating LAMP3 gene, immune-suppressive molecules, and HLA-II in DC_C3_LAMP3 cells.
Fig. 5
Fig. 5. Heterogeneity of malignant cells with distinct EBV infection in tumour tissues.
a Heatmap showed the large-scale CNVs for epithelial cells (rows along y-axis) from 10 NPC tumours. CNVs were inferred according to the average expression of 100 genes spanning each chromosomal position (x-axis). Red: gains; blue: losses. Malignant NPC cells from different patients and the range of different chromosomes are indicated as different colour bars on the left and top to the heatmap, respectively. b UMAP plot of 2,787 malignant cells grouped into two cell clusters (EP_C1_LAMP1 and EP_C2_EPCAM). Each dot represents a cell, coloured according to a cell cluster. c UMAP plots showed the expression of EBV-encoded genes (LMP-1/BNLF2a/b, RPMS1/A73, LMP-2A/B, and BNRF1) in malignant cells. Each dot represents a single cell, and the depth of colour from grey to red represents low to high expression. d Violin plots showed the normalised expression of cluster markers, chemokines, and genes associated with NF-κB and Notch pathways in each cluster. In each plot, cell clusters and the expression level of a gene as the chart tile are indicated at the x- and y-axis, respectively. e Representative images of multiplex immunofluorescence staining of malignant cells in NPC tissues. Proteins detected using respective antibodies in the assays are indicated on top. The red, green, and orange arrows indicated the representative cells positive for EPCAM, LMP1, and co-expression of EPCAM and LMP1 proteins in malignant cells, respectively. Images are representative of three biological replicates. Scale bars, 50 µm. f Bar plots showed the selected signalling pathways with significant enrichment of GO (top panel) and KEGG (bottom panel) terms for EBV+ malignant cells (EP_C1_LMP1) compared to EBV- malignant cells (EP_C2_EPCAM), coloured from light to dark according to their −log10(P-values) from low to high. P-values were calculated by one-sided hypergeometric test and adjusted for multiple comparisons.
Fig. 6
Fig. 6. Intercellular interactions among immune and malignant cells in NPC.
a, b Dot plots showed selected ligand-receptor interactions between two cell clusters, for Treg and DC_C3_LAMP3 cells (a) and for exhausted CD8+ T (CD8_C11_PDCD1) and DC_C3_LAMP3 cells (b). The ligand-receptor interactions and cell-cell interactions are indicated at columns and rows, respectively. The means of the average expression levels of two interacting molecules are indicated by colour heatmap (right panel), with blue to red representing low to high expression. The log10(P-values) were indicated by circle size in one-sided permutation test. Different colour boxes at the bottom represent different function modules of receptor-ligand interactions. c Representative images of multiplex IHC staining for the juxtaposition of CTLA4-expressing Treg cells (CD3+CD4+FOXP3+) and CD80-expressing DC_C3_LAMP3 cells in NPC tissue samples. Proteins detected using respective antibodies are indicated on top. The green, red, magenta, cyan, and orange arrows indicated positive cells with the expression of CD3, CD4, FOXP3, CTLA4, and CD80 proteins in NPC tissue, respectively (bottom panel). Images are representative of three biological replicates. Scale bars, 100 µm and 20 µm for top and bottom panels, respectively. d Representative images of multiplex IHC staining for the juxtaposition of PD1-expressing CD8+ T cells (CD3+CD8+) and PD-L1-expressing DC_C3_LAMP3 cells (CD80+) in NPC tissue samples. Proteins detected using respective antibodies are indicated on top. The yellow, cyan, magenta, red, and green arrows indicated positive cells with the expression of CD3, CD8, CD80, PD1, and PD-L1 proteins in NPC tissue, respectively (bottom panel). Images are representative of three biological replicates. Scale bars, 100 and 20 µm for top and bottom panels, respectively.
Fig. 7
Fig. 7. Schematic diagram of cross-talks among multiple immune cells in the TME of NPC.
EBV infects nasopharyngeal epithelial cells and participates in the tumorigenic process of NPC. EBV-positive malignant NPC cells secret a variety of chemokines (CX3CL1, etc.) and initiate the recruitment and tumoral infiltration of multiple immune cells with the chemokines receptors from the peripheral blood. Multiple tumour infiltrating immune cells activate EGFR and Notch pathway in EBV-positive malignant NPC cells. Naive CD8+ cells infiltrate to the lesion and develop to effector and further exhausted CD8+ cells. Peripheral DCs infiltrate to the tumour and differentiate into LAMP3+ DCs. The mature LAMP3+ DCs with the expression of PD-L1/PD-L2 interact with PD1 on CD8+ T cells whereby the signalling restrains the activation of CD8+ T cells and promotes their exhaustion. Treg cells interact with LAMP3+ DCs through CTLA4-CD80/CD86, which might limit the antigen presentation process of DCs and promote the secretion of IDO1 to induce the proliferation of Treg cells. The intensive cell-cell interactions among LAMP3+ DCs, Treg cells, exhausted CD8+ T cells, and malignant cells foster an immune-suppressive niche for the tumour microenvironment of NPC.

References

    1. Chung GT, et al. Constitutive activation of distinct NF-kappaB signals in EBV−associated nasopharyngeal carcinoma. J. Pathol. 2013;231:311–322. doi: 10.1002/path.4239. - DOI - PubMed
    1. Chen YP, et al. Nasopharyngeal carcinoma. Lancet. 2019;394:64–80. doi: 10.1016/S0140-6736(19)30956-0. - DOI - PubMed
    1. Sun Y, et al. Induction chemotherapy plus concurrent chemoradiotherapy versus concurrent chemoradiotherapy alone in locoregionally advanced nasopharyngeal carcinoma: a phase 3, multicentre, randomised controlled trial. Lancet Oncol. 2016;17:1509–1520. doi: 10.1016/S1470-2045(16)30410-7. - DOI - PubMed
    1. Li WF, et al. Concurrent chemoradiotherapy with/without induction chemotherapy in locoregionally advanced nasopharyngeal carcinoma: Long-term results of phase 3 randomized controlled trial. Int. J. Cancer. 2019;145:295–305. doi: 10.1002/ijc.32099. - DOI - PubMed
    1. Chan AT, et al. Multicenter, phase II study of cetuximab in combination with carboplatin in patients with recurrent or metastatic nasopharyngeal carcinoma. J. Clin. Oncol. 2005;23:3568–3576. doi: 10.1200/JCO.2005.02.147. - DOI - PubMed

Publication types

MeSH terms