. 2021 Feb 2;12(1):753.
doi: 10.1038/s41467-021-21029-2.

3D bioprinting of high cell-density heterogeneous tissue models through spheroid fusion within self-healing hydrogels

Affiliations

3D bioprinting of high cell-density heterogeneous tissue models through spheroid fusion within self-healing hydrogels

Andrew C Daly et al. Nat Commun. .

Abstract

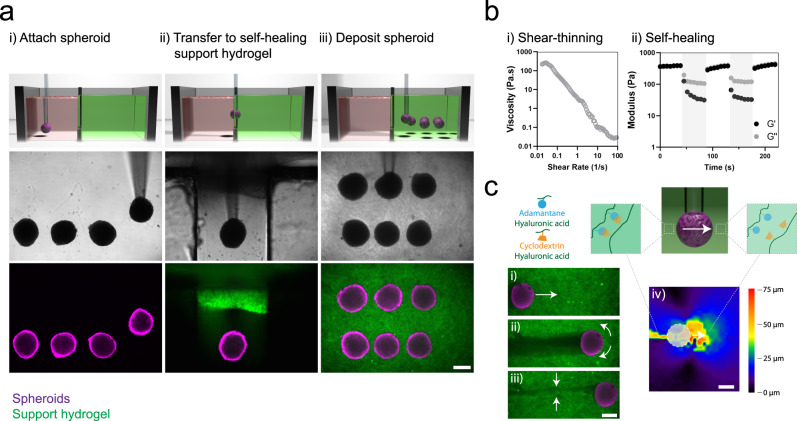
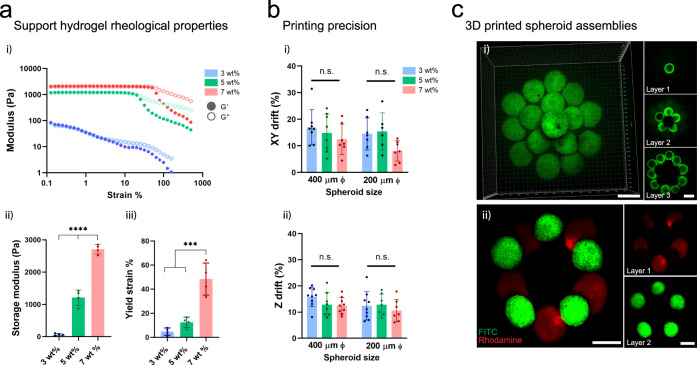
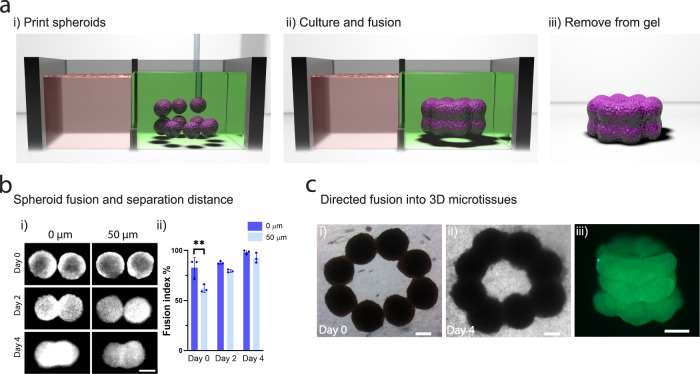
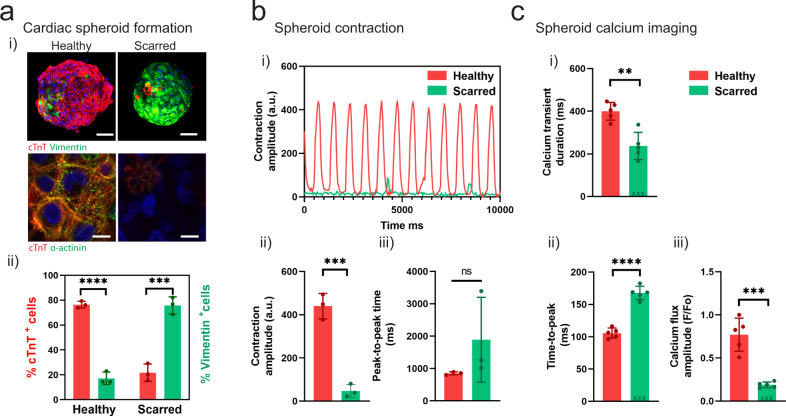
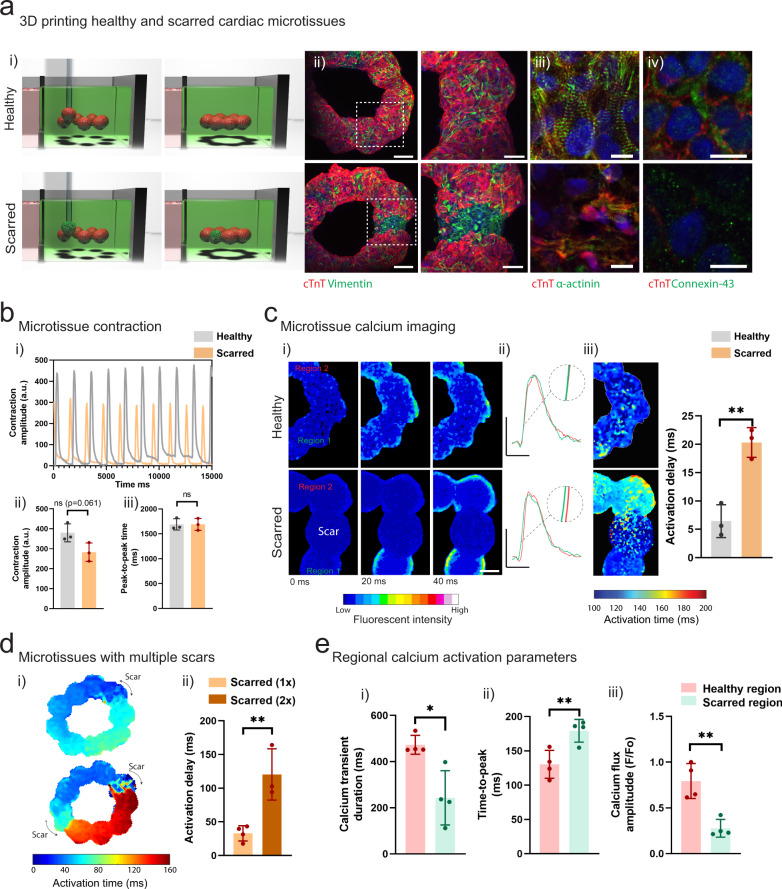
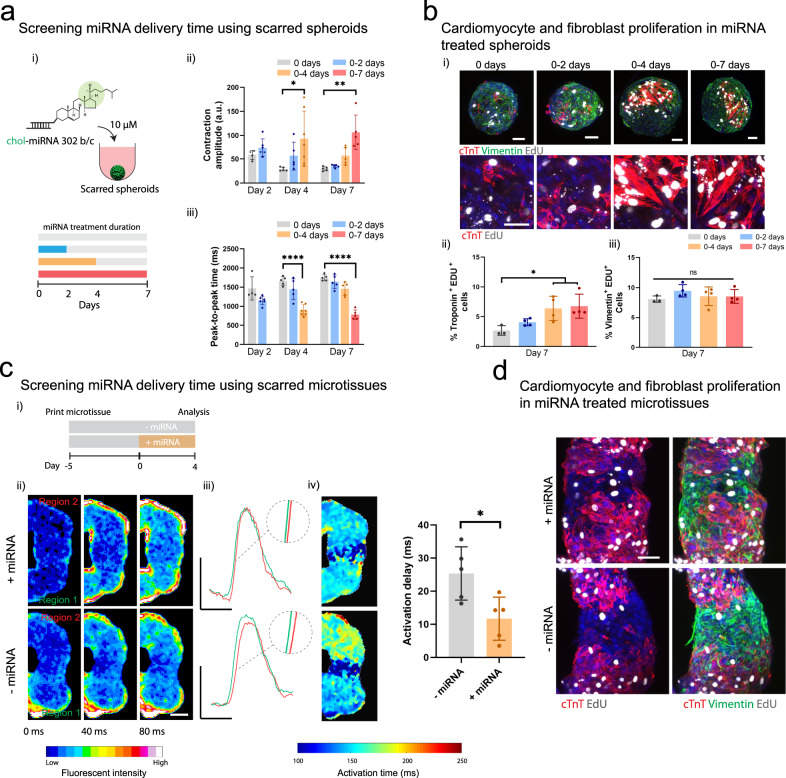
Cellular models are needed to study human development and disease in vitro, and to screen drugs for toxicity and efficacy. Current approaches are limited in the engineering of functional tissue models with requisite cell densities and heterogeneity to appropriately model cell and tissue behaviors. Here, we develop a bioprinting approach to transfer spheroids into self-healing support hydrogels at high resolution, which enables their patterning and fusion into high-cell density microtissues of prescribed spatial organization. As an example application, we bioprint induced pluripotent stem cell-derived cardiac microtissue models with spatially controlled cardiomyocyte and fibroblast cell ratios to replicate the structural and functional features of scarred cardiac tissue that arise following myocardial infarction, including reduced contractility and irregular electrical activity. The bioprinted in vitro model is combined with functional readouts to probe how various pro-regenerative microRNA treatment regimes influence tissue regeneration and recovery of function as a result of cardiomyocyte proliferation. This method is useful for a range of biomedical applications, including the development of precision models to mimic diseases and the screening of drugs, particularly where high cell densities and heterogeneity are important.


Conflict of interest statement

J.A.B. owns equity in Prolifagen, a start-up company exploring miRNA therapeutics for cardiac repair. The remaining authors declare no competing interests.

Figures

Fig. 1
Fig. 1. 3D bioprinting spheroids in self-healing support hydrogels.
a Schematic (top), brightfield images (middle), and fluorescent images (bottom) demonstrating, (i) MSC spheroid aspiration in a media reservoir, (ii) spheroid transfer into a self-healing support hydrogel (FITC-labeled), and (iii) spheroid deposition within the support hydrogel through removal of vacuum from the micropipette tip. Images are representative of n = 4 independent experiments. b Rheological characterization of a guest-host support hydrogel (3 wt%) demonstrating, (i) shear-thinning properties—decreased viscosity with continuously increasing shear rates (0–100 s−1) and (ii) self-healing properties—storage and loss modulus recovery (G′ & G″) through low (0.5% strain, 10 Hz) and high (shaded, 100% strain, 10 Hz) strain cycles. c Reversible interactions between guest (adamantane, blue) and host (β-cyclodextrin, orange) modified hyaluronic acid of the support hydrogel (containing FITC-microparticles) enable, (i–ii) local yielding of the support hydrogel under shear during spheroid translation, and (iii) rapid healing of the support hydrogel after spheroid translation. (iv) Displacement mapping of the support hydrogel (spheroid noted as dashed circle) demonstrating local motion of the hydrogel in front of and behind the spheroid during spheroid translation. Images are representative of n = 3 independent experiments. All scalebars 250 µm.
Fig. 2
Fig. 2. Support hydrogel rheological properties and 3D bioprinting precision.
a (i) Shear-yielding in guest-host support hydrogels with increasing strain (0.1–500%, 10 Hz) at varied macromer concentrations (3, 5, 7 wt%) (storage modulus G′, closed circles; loss modulus G″, open circles). (ii) Storage modulus at low strain (0.5%) at varied macromer concentrations (n = 4 hydrogel samples, mean ± s.d, one-way ANOVA, 3 vs. 5 wt% p = 1.0 × 10−5, 5 vs. 7 wt% p = 1.0 × 10−6, 3 vs. 7 wt% p = 5.0 × 10−9). (iii) Yield point (strain at G′/G″ crossover) at varied macromer concentrations (n = 4 hydrogel samples, mean ± s.d, one-way ANOVA, 3 vs. 7 wt% p = 1.0 × 10−4, 5 vs. 7 wt% p = 4.6 × 10−4). b (i) Bioprinting precision in the XY plane (XY drift %) for 200 and 400 µm diameter spheroids (n = 8, 8, 7, 7, 6, 7 biologically independent samples (from left to right), mean ± s.d, one-way ANOVA). XY drift % = post-printing spheroid drift/spheroid diameter (see Supplementary Fig. 4a i for schematic of measurement). (ii) Bioprinting precision in the Z plane (Z drift %) for 200 and 400 µm diameter spheroids (n = 9, 8, 9, 9, 7, 7 biologically independent samples (from left to right), mean ± s.d, one-way ANOVA). Z drift % = post-printing spheroid drift/spheroid diameter (see Supplementary Fig. 4a ii for schematic of measurement). c 3D bioprinted MSC spheroids within a support hydrogel (3 wt% macromer concentration) into either (i) a multi-layer cone shaped geometry (FITC-labeled spheroids) or (ii) layered rings of distinct MSC spheroid populations (FITC- or rhodamine-labeled) within the support hydrogel. All scalebars 250 µm. All experiments are from a single MSC donor. (n.s. not significant, ***p < 0.001, ****p < 0.0001).
Fig. 3
Fig. 3. 3D bioprinting microtissues through directed spheroid fusion.
a (i) Schematic demonstrating the bioprinting of spheroids into rings within the support hydrogel, (ii) spheroid fusion and microtissue formation within the support hydrogel during culture, and (iii) removal of the microtissue via washing of the support hydrogel. b (i) Spheroid fusion over 4 days as a function of initial separation distance (0 or 50 µm). (ii) Fusion index (%) (see Supplementary Fig. 6a for schematic of measurement) over 4 days of culture (n = 3 biologically independent samples, mean ± s.d, one-way ANOVA, day 0 – 0 vs. 50 µm p = 0.0025). c (i–ii) Brightfield images of spheroid fusion into microtissue rings over 4 days of culture. (iii) 3D bioprinted microtissue tube composed of 3 layers of fused spheroids (after 4 days of culture and then removal from the support hydrogel). All scalebars 200 µm. All experiments are from a single MSC donor. (**p < 0.01).
Fig. 4
Fig. 4. Fabrication of cardiac spheroids for disease modeling applications.
a (i) Development of healthy and scarred spheroids through mixing iPSC-derived cardiomyocytes (iPSC-CMs) with primary adult cardiac fibroblasts (CFs) at defined ratios of cell numbers (4:1 for healthy; 1:4 for scarred). Top: Images (cardiac troponin-T (cTnT) (red; iPSC-CMs); vimentin (green; CFs)) taken 3 days after cell seeding. Scalebar 50 µm. Bottom: Immunofluorescence staining for alpha-actinin (green; sarcomeres) and cTnT (red; iPSC-CMs) in healthy and scarred spheroids at 3 days. Scalebar 10 µm. (ii) Quantification of cellular composition through staining for cTnT (iPSC-CMs) and vimentin (CFs) (n = 3 biologically independent samples, mean ± s.d, two-sided student t test, healthy - cTnT+ vs. Vimentin+ p = 5.6 × 10−5, scarred - cTnT+ vs. Vimentin+ p = 6.7 × 10−4). b (i) Contraction profiles, (ii) contraction amplitude (a.u. absolute units), and (iii) peak-to-peak time (ms) of healthy and scarred cardiac spheroids at 3 days (n = 3 biologically independent samples, mean ± s.d, two-sided student t test, (ii) p = 5.0 × 10−4). c Quantification of calcium activation parameters from calcium mapping experiments in healthy and scarred spheroids at 3 days, including (i) calcium transient duration (ms), (ii) time-to-peak (ms), and (iii) calcium flux amplitude (F/Fo) (n = 5 biologically independent samples, mean ± s.d, two-sided student t test, (i) p = 0.0014, (ii) p = 5.0 × 10−6, (iii) p = 2.0 × 10−4). Note for n = 3 scarred spheroids a significant calcium activation peak was not observed, and these samples were not included in the statistical analysis and are denoted by x mark on the graph. All experiments are from a single iPSC-CM donor (donor A). (n.s. not significant, **p < 0.01, *** p < 0.001, **** p < 0.0001).
Fig. 5
Fig. 5. 3D bioprinting cardiac microtissues for disease modeling applications.
a (i) Schematic of 3D bioprinting of healthy and scarred cardiac microtissue rings and (ii) immunofluorescence staining for cTnT and vimentin in healthy and scarred cardiac microtissues after 5 days of fusion within the support hydrogel. Scalebar 100 µm (insets 50 µm). (iii) Immunofluorescence staining for alpha-actinin (green; sarcomeres) and cTnT (red; iPSC-CMs) and (iv) connexin-43 (green; gap junctions) and cTnT (red; iPSC-CMs), in healthy and scarred regions of microtissues after 5 days of fusion within the support hydrogel. Scalebar 10 µm. b (i) Contraction profiles of healthy and scarred cardiac microtissues following removal from the support hydrogel after 5 days of culture. (ii) Contraction amplitude (a.u. absolute units) and (iii) Peak-to-peak time (ms) at 5 days (n = 3 biologically independent samples, mean ± s.d, two-sided student t test, (ii) p = 0.061). c (i) Calcium mapping in healthy and scarred cardiac microtissues after 5 days culture, each image represents a 20 ms frame. Scalebar 100 µm. (ii) Representative calcium traces from regions 1 and 2 (see methods) in healthy and scarred cardiac microtissues. Scalebars 0.5 ΔF/Fo (y), 500 ms (x). (iii) Activation maps of healthy and scarred cardiac microtissues, and activation delay (ms) (difference in activation time (ms) between regions 1 and 2) in healthy and scarred cardiac microtissues (n = 3 biologically independent samples, mean ± s.d, two-sided student t test, p = 0.0035). d (i) Activation maps of scarred cardiac microtissues with 1 or 2 scars after 5 days of culture and (ii) quantification of activation delay (ms) (n = 3-4 biologically independent samples, mean ± s.d, two-sided student t test, p = 0.0066). e Regional quantification of (i) calcium transient duration (ms), (ii) time-to-peak (ms), and (iii) calcium flux amplitude (F/Fo), in healthy and scarred regions of microtissues (scarred 1x) after 5 days of culture (n = 4 biologically independent samples, mean ± s.d, two-sided student t test, (i) p = 0.010, (ii) p = 0.0098, (iii) p = 0.0029). Note full calcium transient duration, time-to-peak, and activation maps can be found in Supplementary Fig. 8. All experiments from a single iPSC-CM donor (donor A). (n.s. not significant, *p < 0.05, **p < 0.01).
Fig. 6
Fig. 6. Evaluating miRNA on the behavior of cardiac microtissues.
a (i) Schematic of cholesterol modified miR302 (chol-miRNA 302 b/c) delivery to scarred cardiac spheroids for 0, 0–2, 0–4, and 0–7 days. (ii) Contraction amplitude (a.u) and (iii) peak-to-peak time (ms) within scarred spheroids measured after 2, 4, and 7 days for each treatment period (n = 4, 6, 5, 5, 7, 5, 5, 5, 5 biologically independent samples (from left to right), mean ± s.d, one-way ANOVA, (ii) day 4: 0 vs. 0–4 days treatment p = 0.014, (ii) day 7: 0 vs. 0–7 days treatment p = 0.0045, (iii) day 4: 0 vs. 0–4 days treatment p = 1.6 × 10−7, (iii) day 7: 0 vs. 0–7 days treatment p = 4.1 × 10−9). b (i) Immunofluorescence staining for cTnT (red; iPSC-CMs), vimentin (green; cardiac fibroblasts), and EdU (proliferation marker) in scarred spheroids at day 7 for each treatment condition. Top panel scalebar 50 µm, and bottom panel scalebar 40 µm. (ii) Quantification of cardiomyocyte proliferation (EdU+ and cTnT+) and (iii) fibroblast proliferation (EdU+ and Vimentin+) at day 7 for each treatment condition. (n = 3, 4, 4, 4 biologically independent samples (from left to right), mean ± s.d, one-way ANOVA, 0 vs. 0–4 days treatment p = 0.044, 0 vs. 0–7 days treatment p = 0.026). Scalebar 50 µm. c (i) Experimental outline where scarred microtissues are bioprinted in the support hydrogel as previously described, followed by 4 days treatment with miR302, and analysis compared to non-treated controls. (ii) Calcium mapping in scarred cardiac microtissues at 9 days (5 days culture in support hydrogel; (+) and (−) 4 days miRNA treatment) each frame 40 ms. Scalebar 100 µm. (iii) Representative calcium traces from regions 1 and 2 in treated and non-treated scarred cardiac microtissues. Scalebars 0.5 ΔF/Fo (y), 500 ms (x). (iv) Activation time maps across scarred regions for treated and non-treated scarred cardiac microtissues, and quantification of activation delay (ms) (n = 5 biologically independent samples, mean ± s.d, two-sided student t test, p = 0.019). d Immunofluorescence staining for cTnT (iPSC-CMs), vimentin (CFs), and EdU (proliferation) in scarred cardiac microtissues at day 9 for treated and non-treated scarred cardiac microtissues. Scalebar 50 µm. All experiments from a single iPSC-CM donor (donor B). (n.s. not significant, *p < 0.05, **p < 0.01, **** p < 0.0001).

Similar articles

Cited by

References

    1. Lancaster MA, Knoblich JA. Organogenesis in a dish: modeling development and disease using organoid technologies. Science. 2014;345:1247125. - PubMed
    1. Cruz-Acuña R, et al. Synthetic hydrogels for human intestinal organoid generation and colonic wound repair. Nat. Cell Biol. 2017;19:1326–1335. doi: 10.1038/ncb3632. - DOI - PMC - PubMed
    1. Broutier L, et al. Culture and establishment of self-renewing human and mouse adult liver and pancreas 3D organoids and their genetic manipulation. Nat. Protoc. 2016;11:1724–1743. doi: 10.1038/nprot.2016.097. - DOI - PubMed
    1. Takasato M, et al. Kidney organoids from human iPS cells contain multiple lineages and model human nephrogenesis. Nature. 2015;526:564–568. doi: 10.1038/nature15695. - DOI - PubMed
    1. Lancaster MA, et al. Cerebral organoids model human brain development and microcephaly. Nature. 2013;501:373–379. doi: 10.1038/nature12517. - DOI - PMC - PubMed

Publication types

MeSH terms